Blog
Introducing the Redis/Intel Benchmarks Specification for Performance Testing, Profiling, and Analysis
Redis and Intel are collaborating on a “zero-touch” performance and profiling automation to scale Redis’s ability to pursue performance regressions and improve database code efficiency. The Redis benchmarks specification describes cross-language and tools requirements and expectations to foster performance and observability standards around Redis-related technologies.
A primary reason for Redis’s popularity as a key-value database is its performance, as measured by sub-millisecond response time for queries. To continue performance improvement across Redis components, Redis and Intel worked together to develop a framework for automatically triggering performance tests, telemetry gathering, profiling, and data visualization upon code commit. The goal is simple: to identify shifts in performance as early as possible.
The automation provides hardware partners such as Intel with insights about how software uses the platform and identifies opportunities to further optimize Redis on Intel CPUs. Most importantly, the deeper understanding of software helps Intel design better products.
In this blog post, we describe how Redis and Intel are collaborating on this type of automation. The “zero-touch” profiling can scale the pursuit of performance regressions and find opportunities to improve database code efficiency.
A standard specification: the motivation and requirements
Both Redis and Intel want to identify software and hardware optimization opportunities. To accomplish that, we decided to foster a set of cross-company and cross-community standards on all matters related to performance and observability requirements and expectations.
From a software perspective, we aim to automatically identify performance regressions and gain a deeper understanding of hotspots to find improvement opportunities. We want the framework to be easily installable, comprehensive in terms of test-case coverage, and easily expandable. The goal is to accommodate customized benchmarks, benchmark tools, and tracing/probing mechanisms.
From a hardware perspective, we want to compare different generations of platforms to assess the impact of new hardware features. In addition, we want to collect telemetry and perform “what-if” tests such as frequency scaling, core scaling, and cache-prefetchers ON vs. OFF tests. That helps us isolate the impact of each of those optimizations on Redis performance and inform different optimizations and future CPU and platform architecture decisions.
A standard SPEC implementation
Based on the premise described above, we created the Redis Benchmarks Specification framework. It is easily installable via PyPi and offers simple ways to assess Redis performance and underlying systems on which Redis runs. The Redis Benchmark Specification currently contains nearly 60 distinct benchmarks that address several commands and features. It can be easily extended with your own customized benchmarks, benchmark tools, and tracing or probing mechanisms.
Redis and Intel continuously run the framework benchmarks. We break down each benchmark result by branch and tag and interpret the resulting performance data over time and by version. Furthermore, we use the tool to approve performance-related pull requests to the Redis project. The decision-making process includes the benchmark results and an explanation of why we got those results, using the output of profiling tools and probers outputs in a “zero-touch” fully automated mode.
The result: We can generate platform-level insights and perform “what-if” analysis. That’s thanks to tracing and probing open source tools such as memtier_benchmark, redis-benchmark, Linux perf_events, bcc/BPF tracing tools, Brendan Greg’s FlameGraph repo, and Intel Performance Counter Monitor for collecting hardware-related telemetry data.
If you’re interested in further details on how we use profilers with Redis, see our extremely detailed Performance engineering guide for on-CPU profiling and tracing.
So, how does it work? Glad you asked.
Software architecture
A primary goal of the Redis Benchmarks Specification is to identify shifts in performance as early as possible. This means we can (or should) assess the performance effect of the pushed change, as measured across multiple benchmarks, as soon as we have a set of changes pushed to Git.
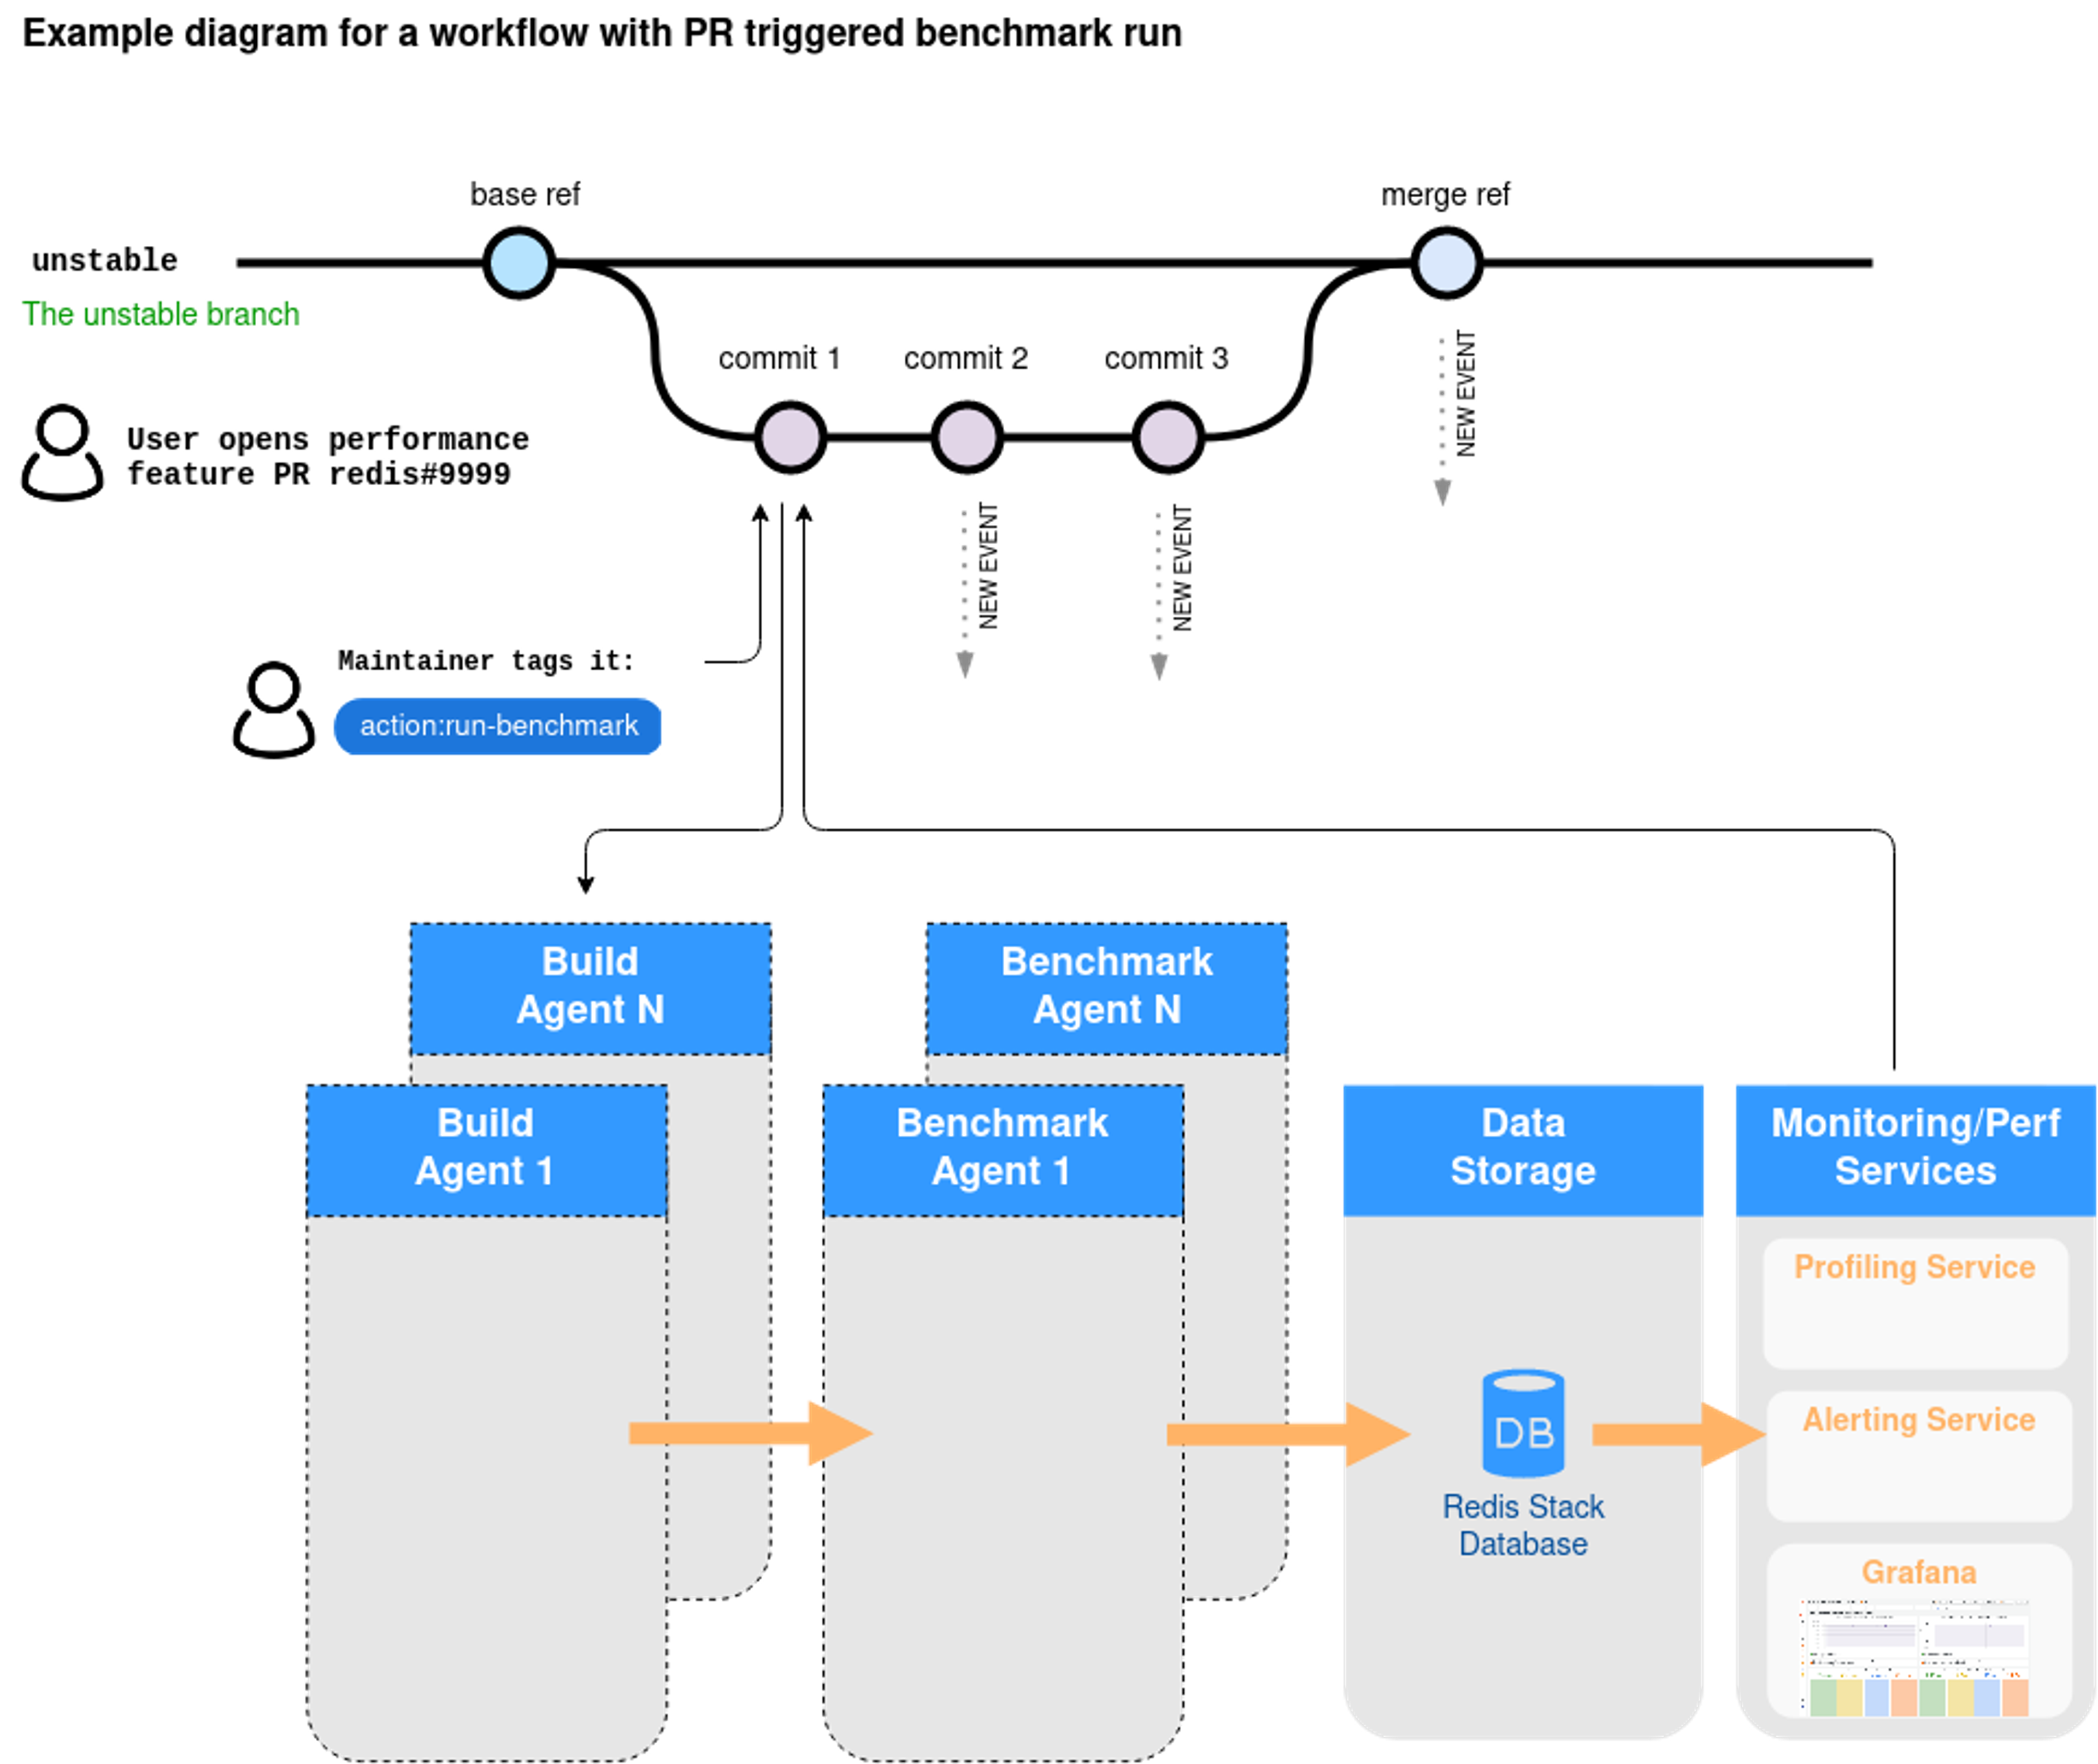
One positive effect is that the core Redis maintainers have an easier job. Triggering CI/CD benchmarks happens by simply tagging a specific pull request (PR) with ‘action run:benchmarks‘. That trigger is then converted into an event (tracked within Redis) that initiates multiple build variants requests based upon the distinct platforms described in the Redis benchmarks spec platforms reference.
When a new build variant request is received, the build agent (redis-benchmarks-spec-builder) prepares the artifact(s). It adds an artifact benchmark event so that all the benchmark platforms (including the ones on the Intel Lab) can listen for benchmark run events. This also starts the process of deploying and managing the required infrastructure and database topologies, running the benchmarks, and exporting the performance results. All of the data is stored in Redis (using Redis Stack features). It is later used for variance-based analysis between baseline and comparison builds (such as the example of the image below) and for variance over time analysis on the same branch/tag.
New commits to the same work branch produce a set of new benchmark events and repeat the process above.

Figure 1. Architecture of the platform from the stage of triggering a workflow from a pull request until the multiple benchmark agents produce the final benchmark and profiling data.
Hardware configuration of Intel Lab
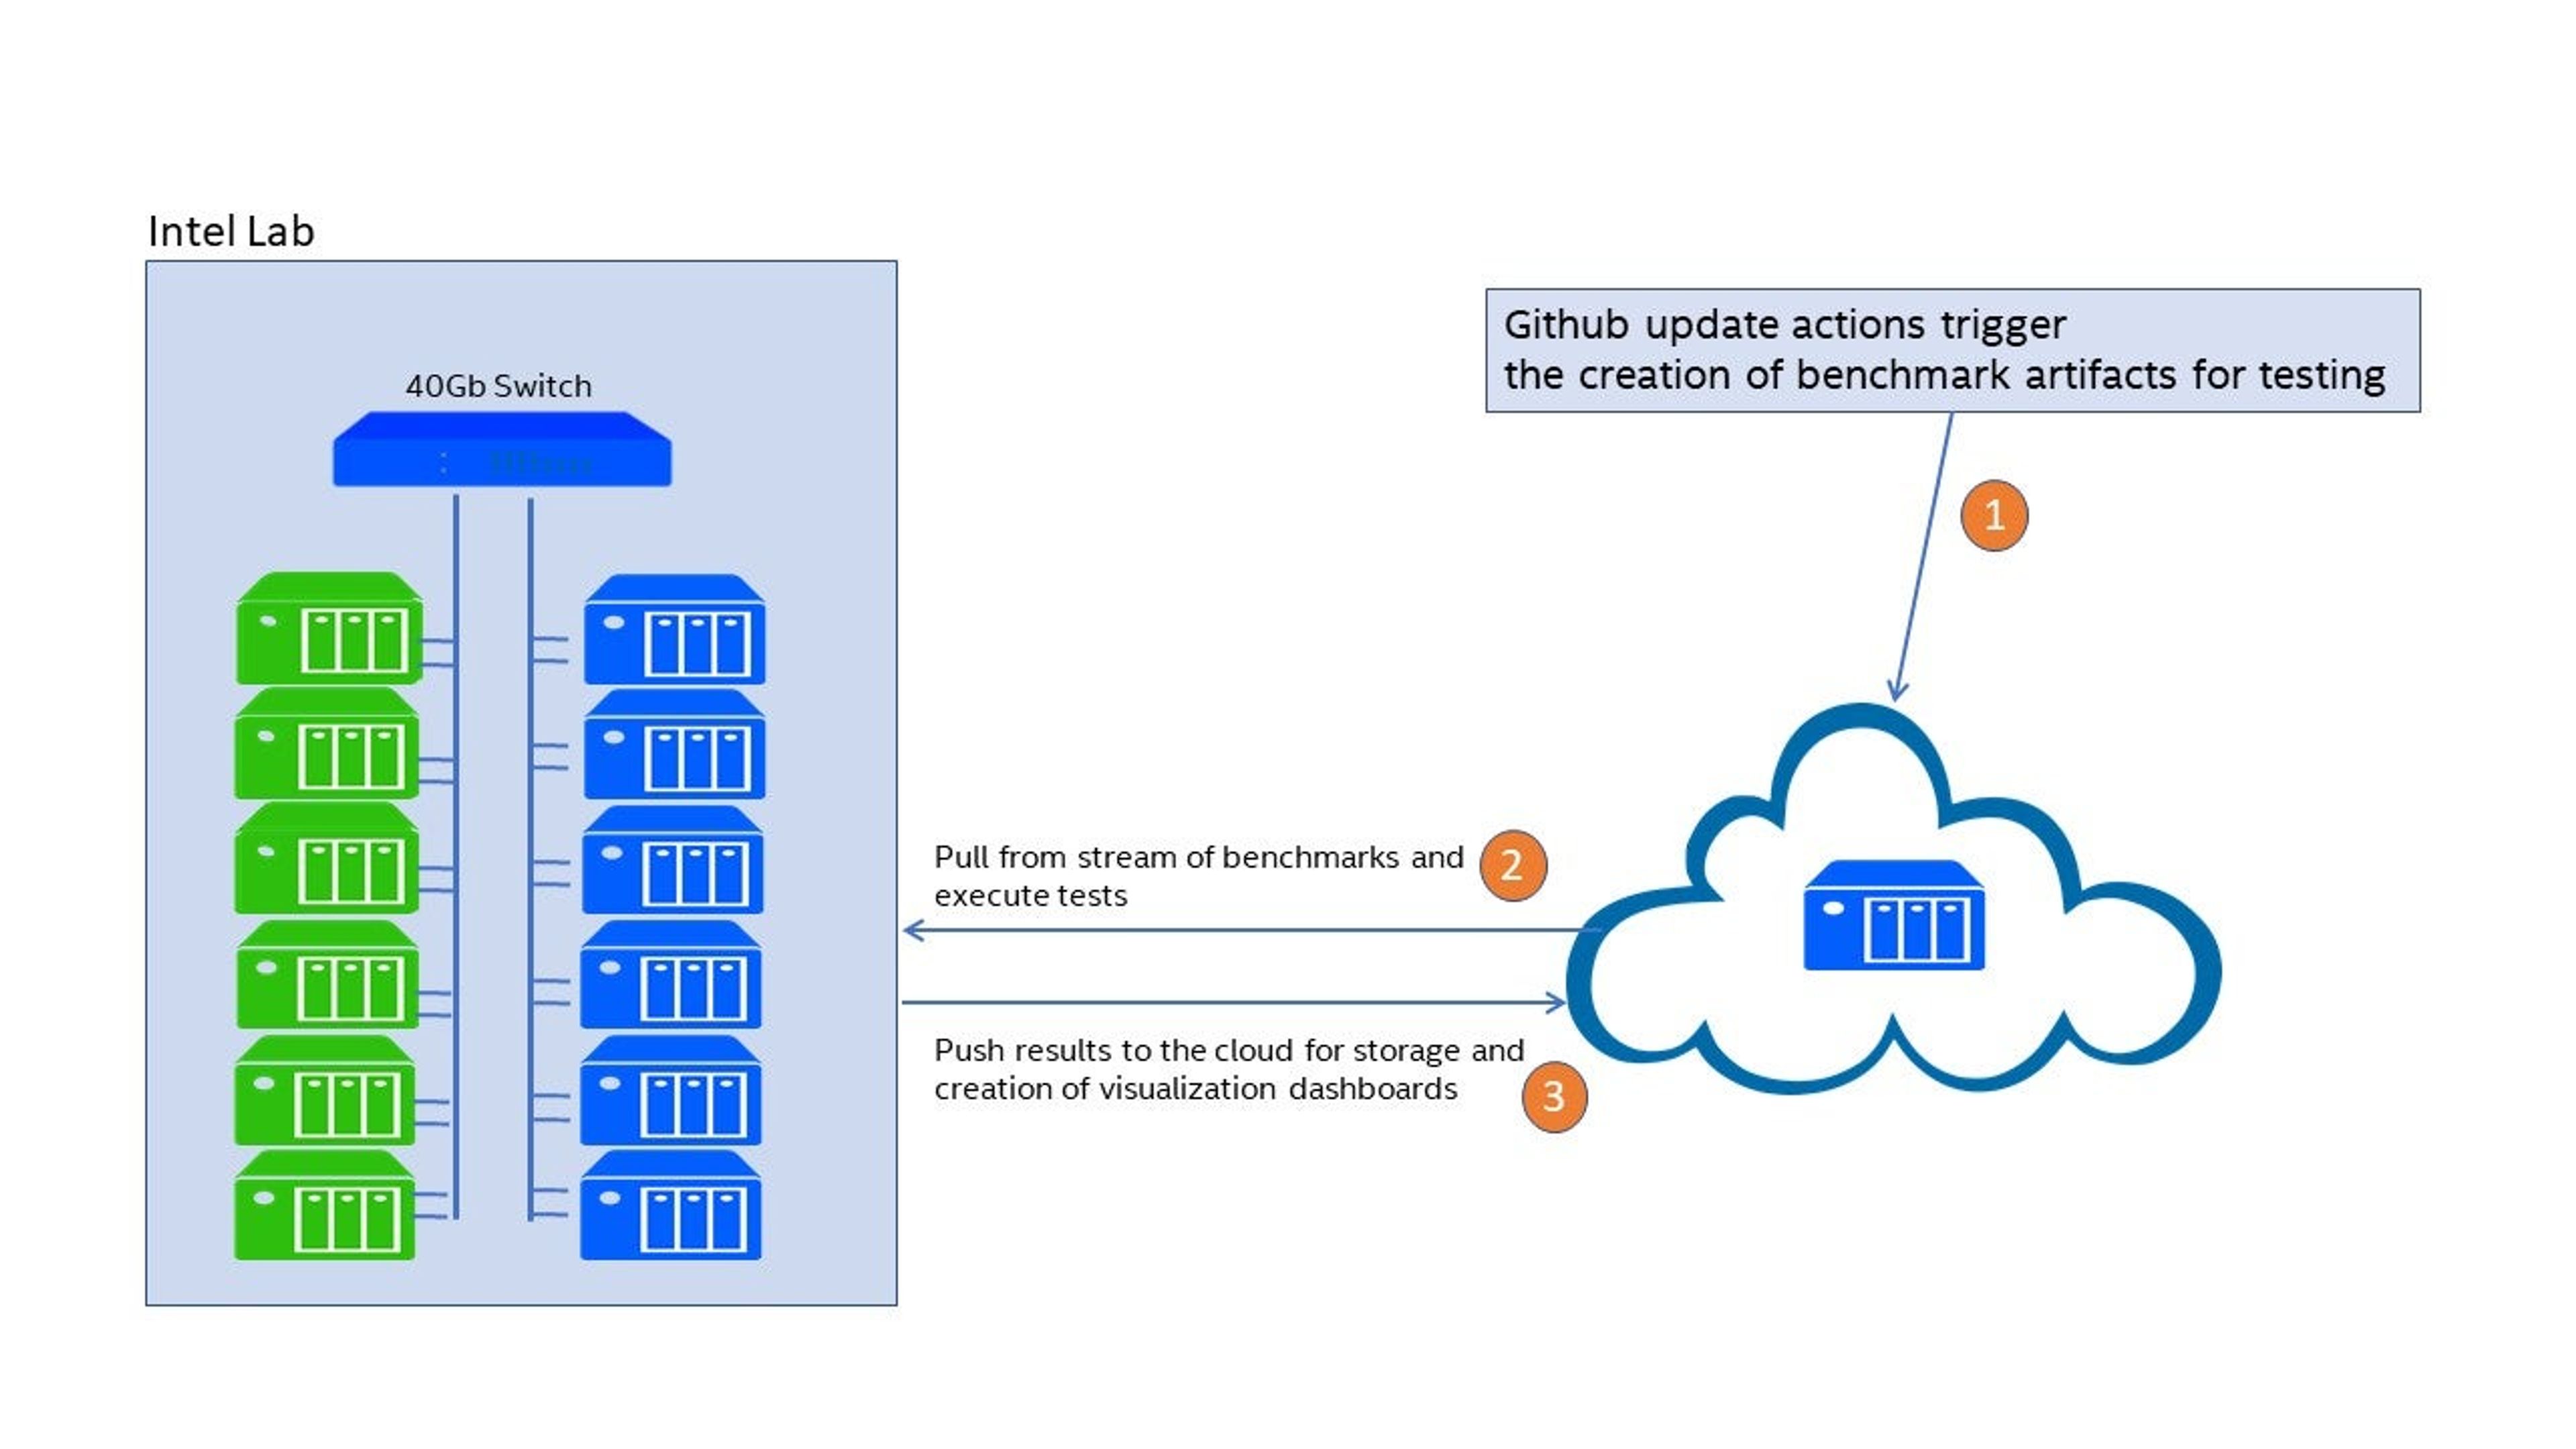
The framework can be deployed both on-prem and on the cloud. In our collaboration, Intel is hosting an on-prem cluster of servers dedicated to the always-on automatic performance testing framework (see Figure 2).

Figure 2. Intel lab setup
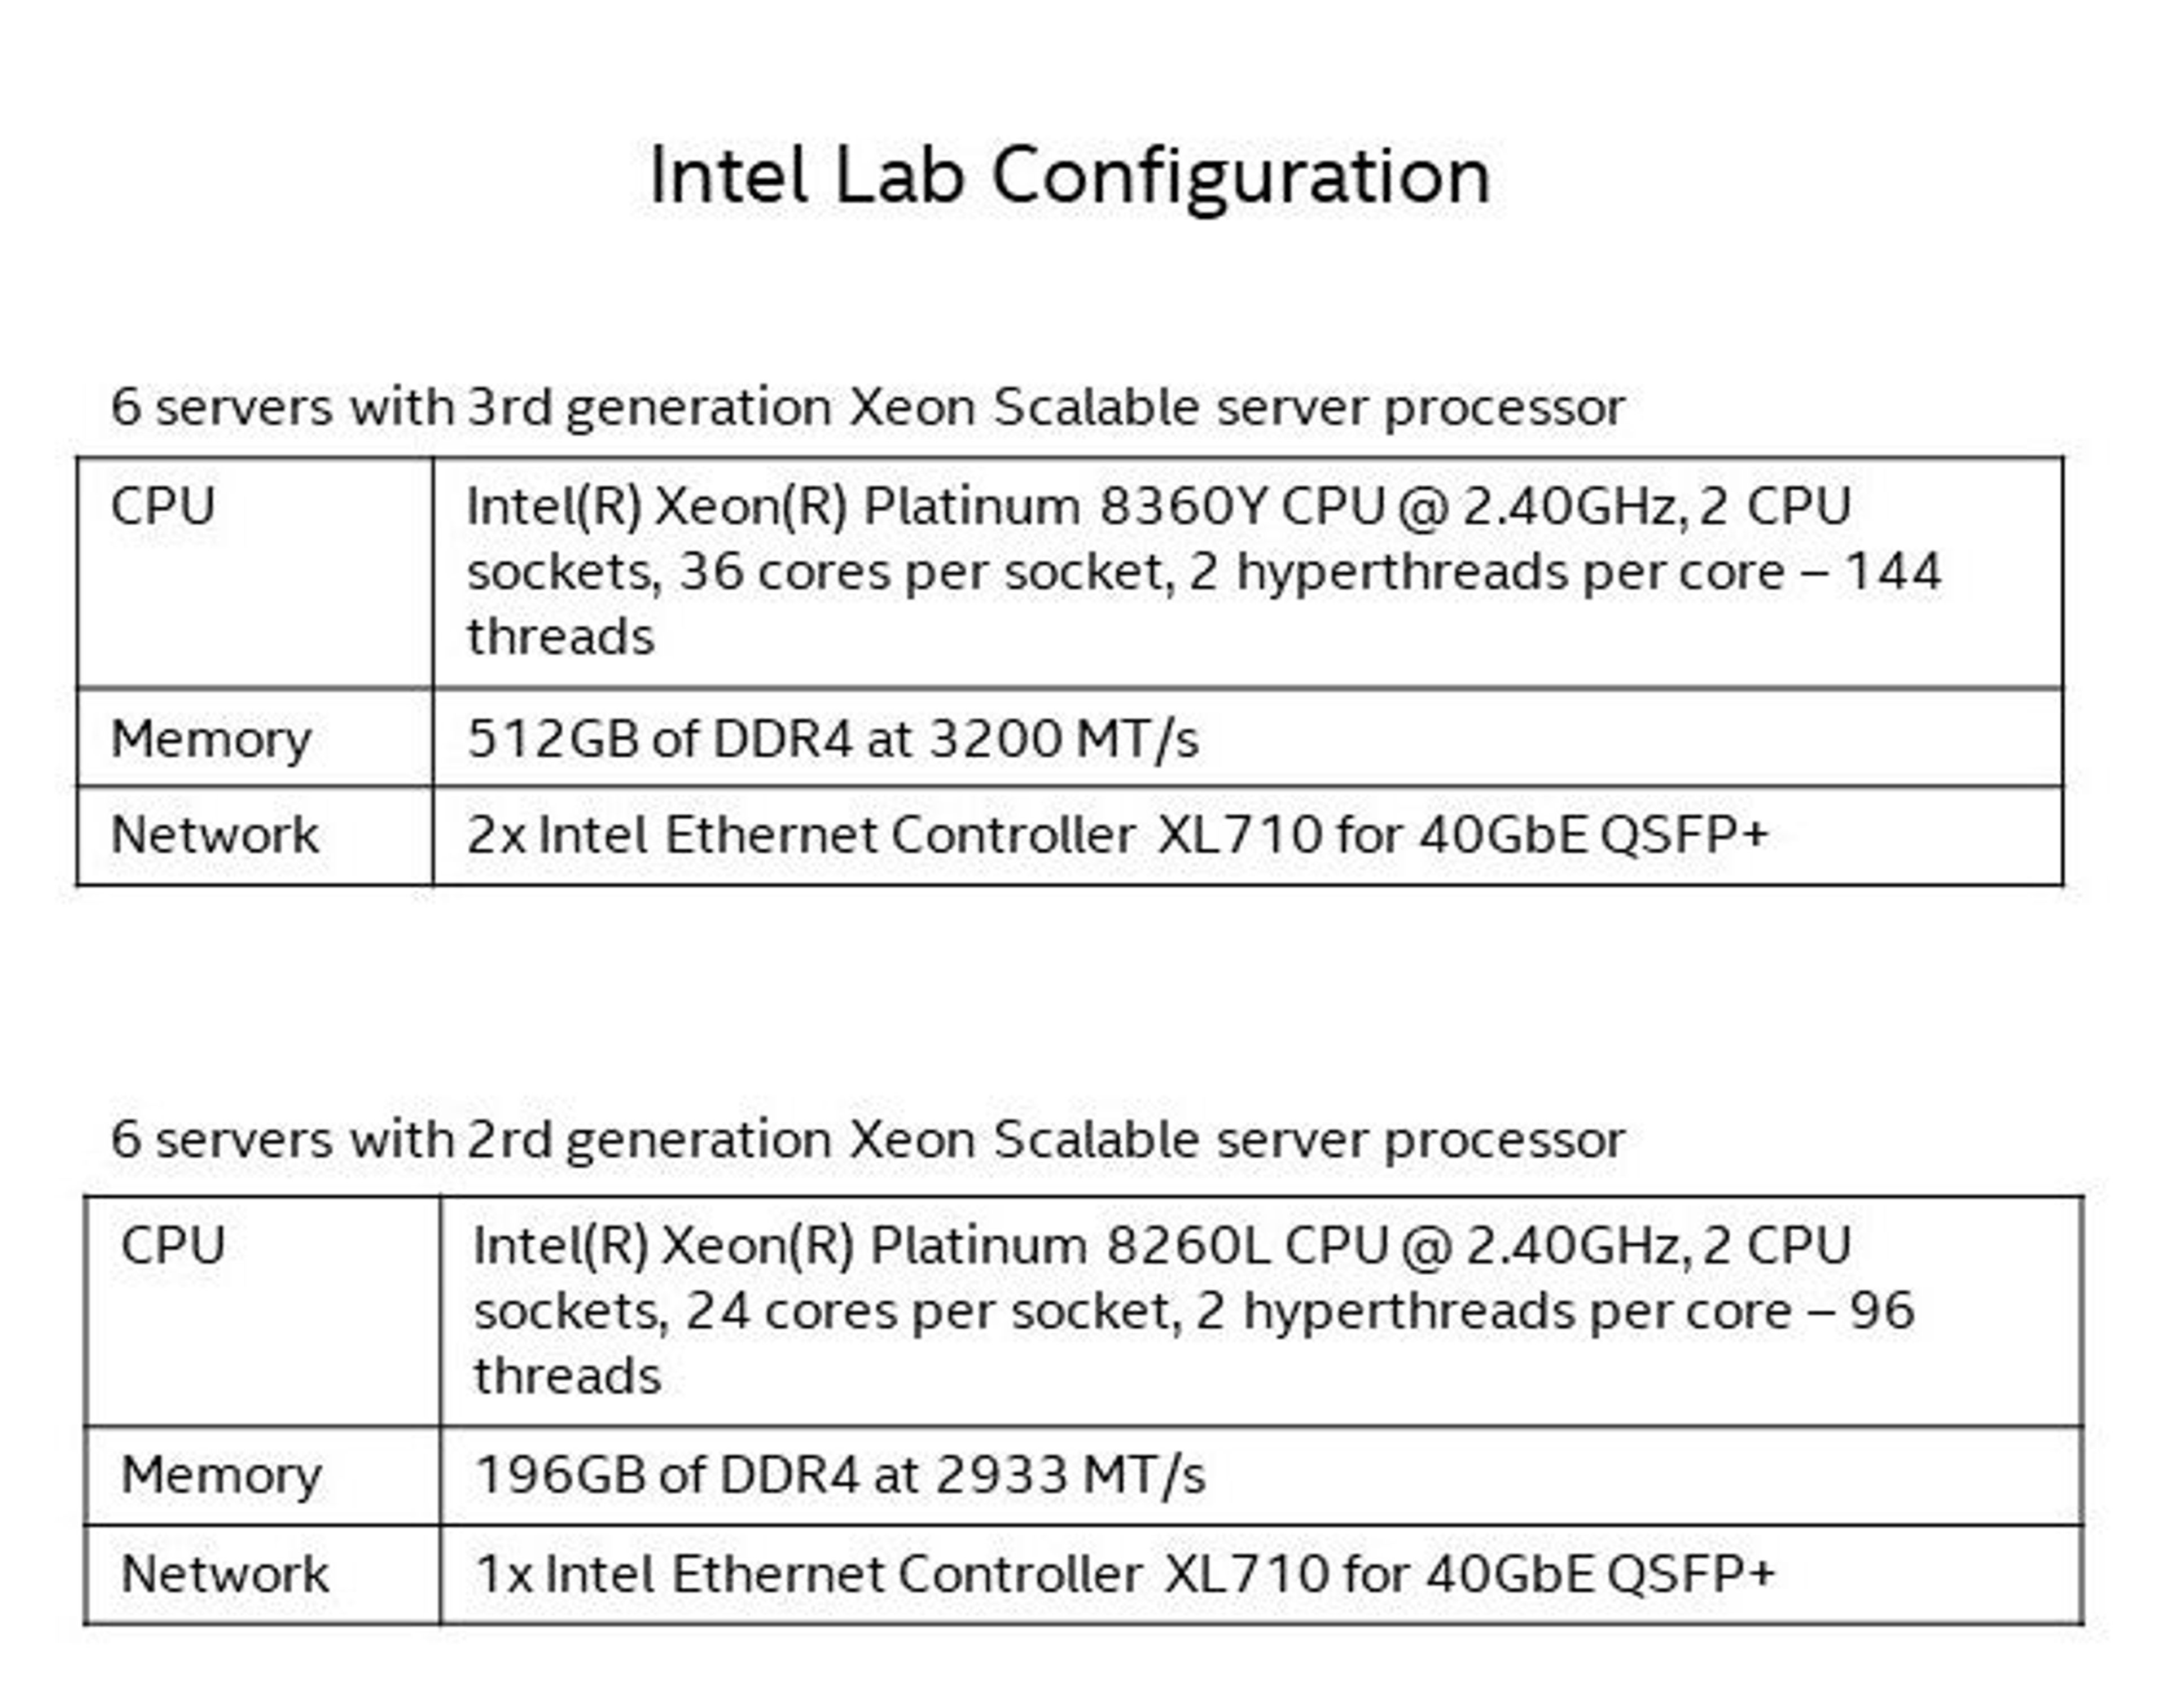
The cluster contains six current generation (IceLake) servers and six prior generation (CascadeLake) servers connected to a high-speed 40Gb switch (see Figure 3). The older servers are used for performance testing across hardware generations, as well as for load generation clients in client-server benchmarks.
We plan to expand the lab to include multiple generations of servers, including BETA (pre-release) platforms for early evaluation and “what-if” analysis of proposed platform features.
One of the observed benefits of the dedicated on-prem setup is that we can obtain more stable results with less run-to-run variation. In addition, we have the flexibility to modify the servers to add or remove components as needed.

Figure 3. Server configuration
Looking forward
Today, the Redis Benchmarks Specification is the de-facto performance testing toolset in Redis used by the performance team. It runs almost 60 benchmarks in daily continuous integration (CI), and we also use it for manual performance investigations.
We see benefits already. In the Redis 7.0 and 7.2 development cycle, the new spec has already allowed us to prepare net new improvements like the ones in these pull requests:
- Change compiler optimizations to -O3 -flto. Measured up to 5% performance gain in the benchmark SPEC tests.
- Use snprintf once in addReplyDouble. Measured improvement of simple ZADD of about 25%.
- Moving client flags to a more cache friendly position within client struct. Regained the lost 2% of CPU cycles since v6.2.
- Optimizing d2string() and addReplyDouble() with grisu2. If we look at ZRANGE WITHSCORES command impact we saw 23% improvement on the achievable ops/sec on replies with 10 elements, 50% on replies with 100 elements and 68% on replies with 1,000 elements.
- Optimize stream id sds creation on XADD key *. Results: about 20% saved CPU cycles.
- Use either monotonic or wall-clock to measure command execution time. ,Regained up to 4% execution time.
- Avoid deferred array reply on ZRANGE commands BYRANK. Regain from 3 to 15% lost performance since v5 due to added features.
- Optimize deferred replies to use shared objects instead of sprintf. Measured improvement from 3% to 9% on ZRANGE command.
In summary, the above work allowed for up to 68% performance boost on the covered commands.

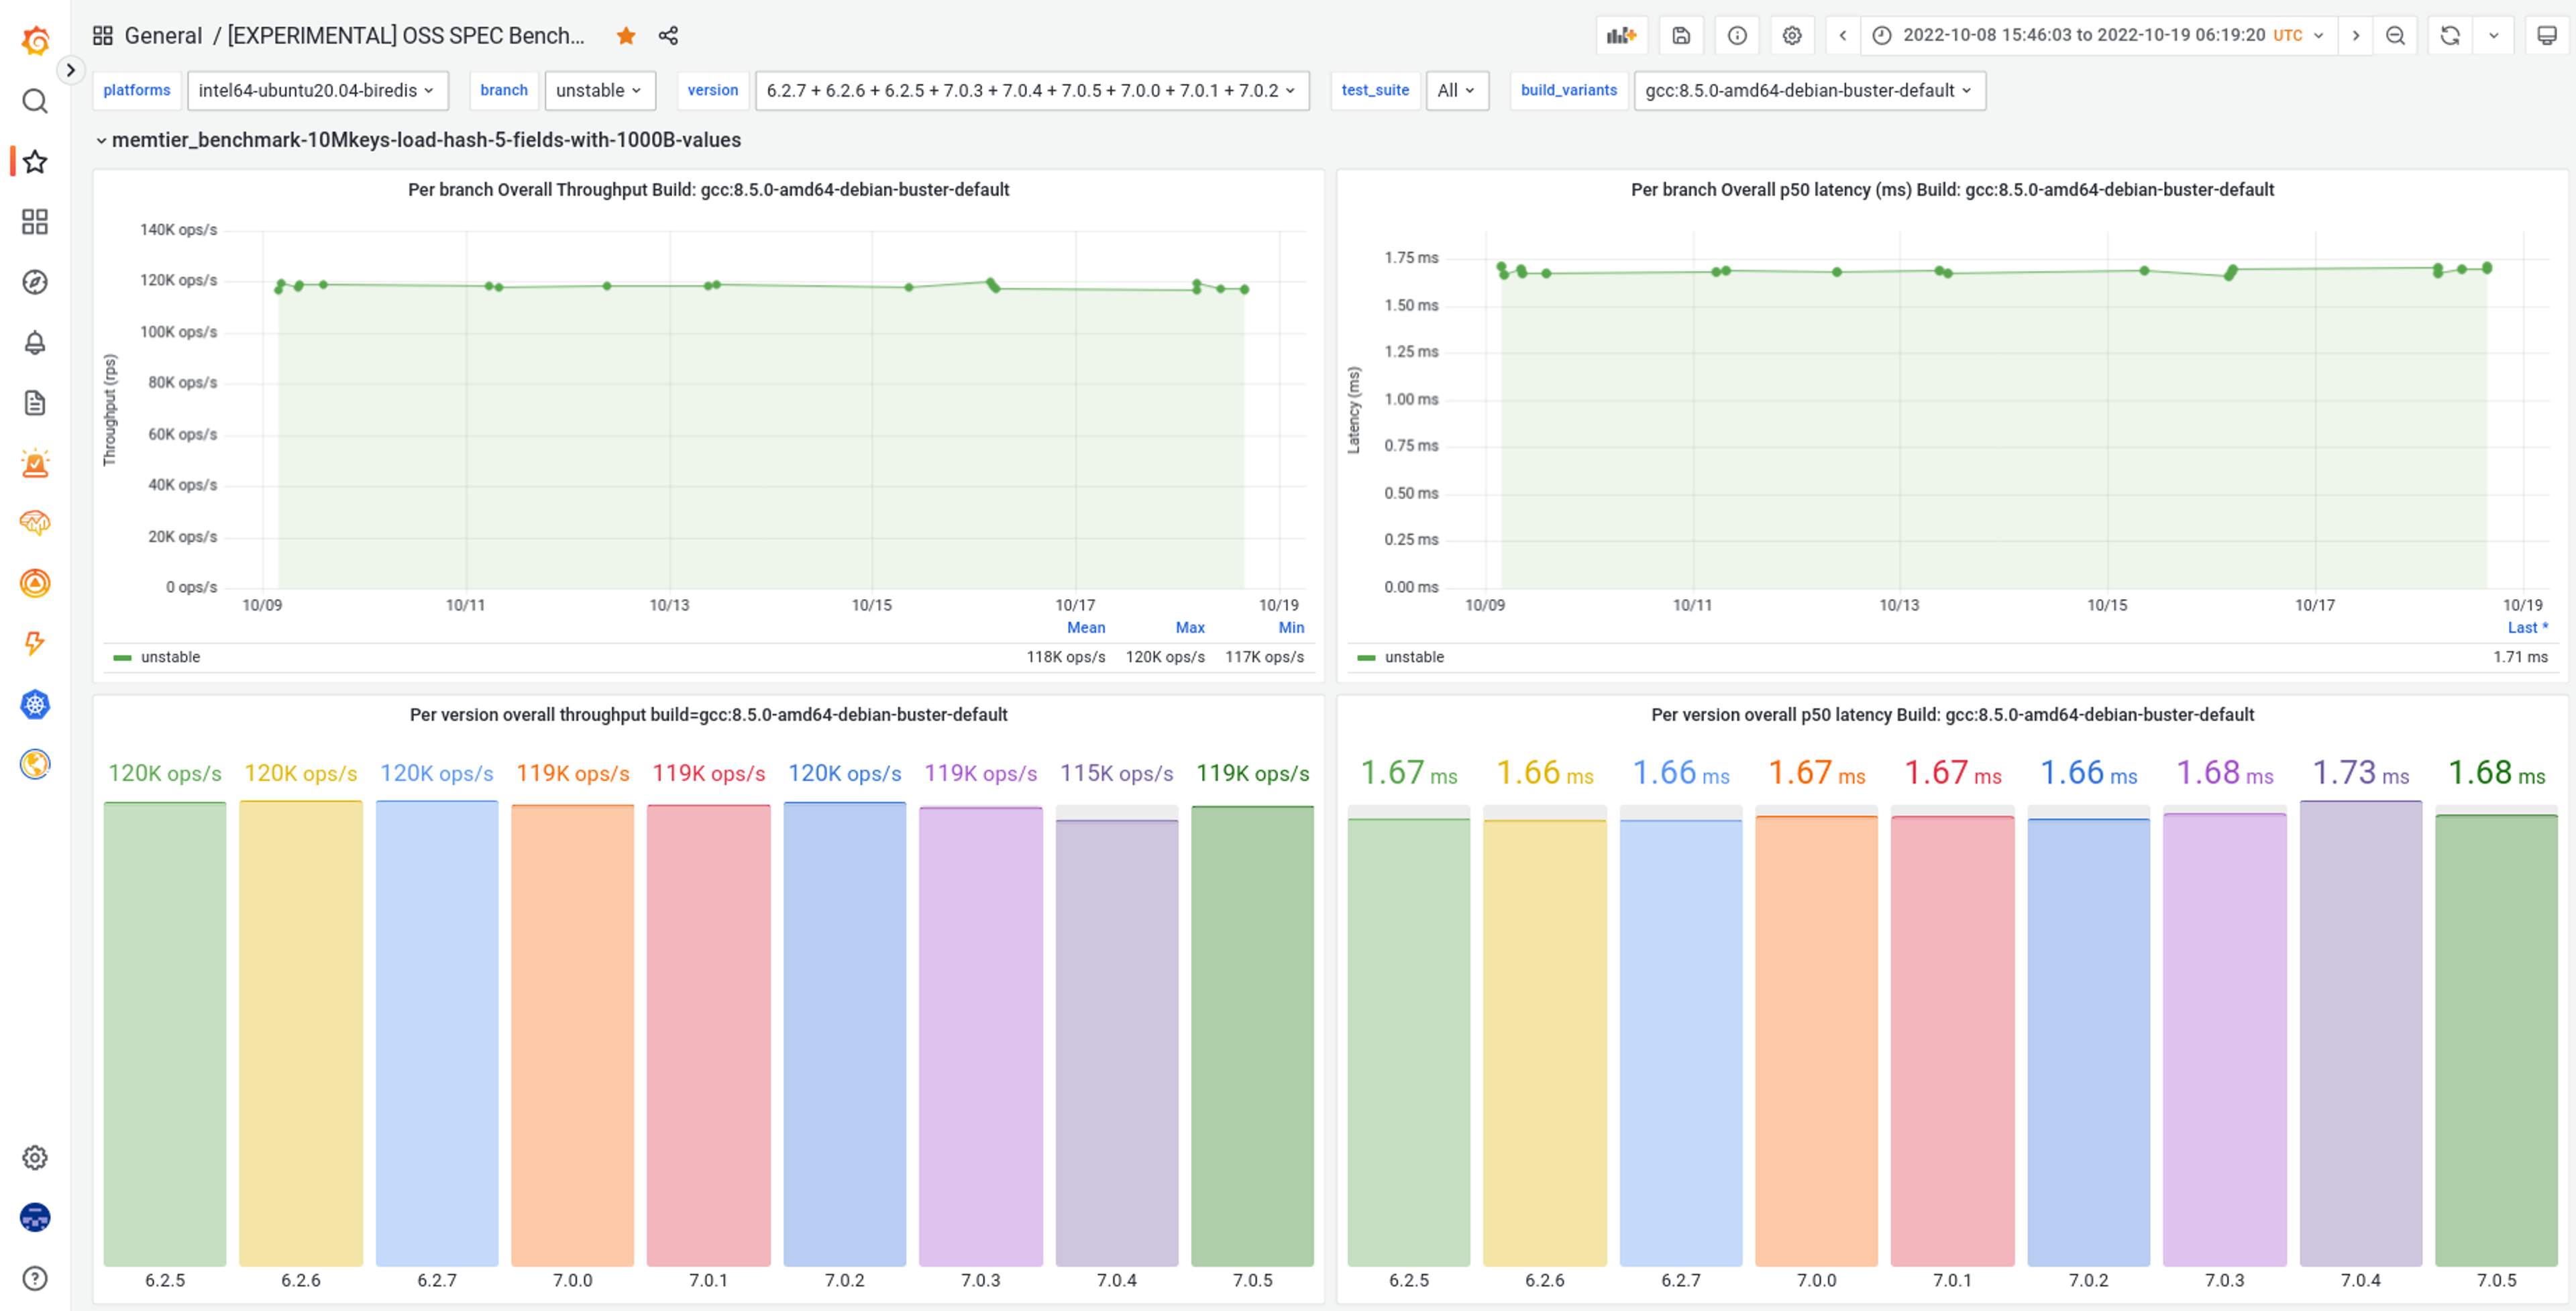
Figure 4. Sample visualization of the Redis Developer Group Grafana tracking the performance of each platform/benchmark/version over time.
Future work
Our present performance engineering system enables us to detect performance changes during the development cycle and to enable our developers to understand the impact of their code changes. While we have made significant progress, there is still much that we would like
to improve.
We are working to improve the ability to aggregate performance data across a group of benchmarks. That will let us answer questions like, “What are the top CPU-consuming stacks across all benchmarks?” and “What is the lowest hanging fruit to optimize and produce the largest impact across all commands?”
Furthermore, our baseline versus comparison analysis deeply depends upon simple variance-based calculation. We intend to approach better statistical analysis methods that permit trend-based analysis on more than a group of data points and for finer-grained analysis to avoid the “boiling-frog issue” of the cloud’s noisy environments.
Redis API has more than 400 commands. We need to keep pushing for greater visibility and better performance across the entire API performance. And we need to do that while also focusing on the most-used commands, as determined by community and customer feedback.
We expect to expand the deployment options, including cluster-level benchmarking, replication, and more. We plan to enrich the visualization and analysis capabilities, and we plan to expand testing to more hardware platforms, including early (pre-release) platforms from Intel.
Our goal is to grow to a larger usage of our performance platform across the community and the Redis Developer group. The more data and the more different perspectives we get into this project, the more likely we are to deliver a faster Redis.
Get started with Redis today
Speak to a Redis expert and learn more about enterprise-grade Redis today.

