Monitor clusters and databases
Read fleet health, capacity, usage, and alerts across every cluster Radar collects from.
| Redis Radar |
|---|
Radar has five views:
| View | Description |
|---|---|
| Overview | Fleet-wide health at a glance. |
| Clusters | Every cluster in your fleet, with type, status, and capacity. |
| Databases | Every database across your fleet, independent of which cluster it's on. |
| Usage | Consumption against your licensed limits. |
| Alerts | Alerts raised by your clusters, ordered by severity. |
All the views are read-only. You must access the cluster itself to take action or make changes.
How current the data is
Radar shows the result of the last successful collection — one pull of a cluster or database's state — not live state. The Clusters, Databases, and Alerts lists carry a Last Seen column detailing the age of the information you are seeing.
Different data refreshes at different rates. Radar aims to collect the Usage report about once an hour, and the rest of a cluster's state every 5 to 15 minutes. Collection runs through a queue, so these are targets rather than guarantees, and some cluster versions collect faster.
If a cluster's Last Seen value stops advancing, Radar has stopped successfully collecting that cluster's state. Do not read it as a healthy cluster. The cause can be anywhere between Radar and the cluster, including the cluster being down. Radar keeps showing the last state it successfully collected, so check the cluster itself.
On a Redis Cloud database's detail view, Force refresh collects that database's state again instead of waiting for the next scheduled collection. Use it after changing something on the cluster, to confirm Radar has caught up.
When a value reads N/A
N/A means Radar has no value for that metric, not that the value is zero. Radar also hides the utilization meter, because a 0 would read as an idle fleet.
This affects memory and ops/sec. Older Redis Software versions do not expose the per-database statistics behind those figures, so a fleet of Redis Software 7.2 or 7.4 clusters can show N/A where a newer fleet shows a number.
Shard counts always show a number, because zero shards is a real answer rather than a missing one.
Overview
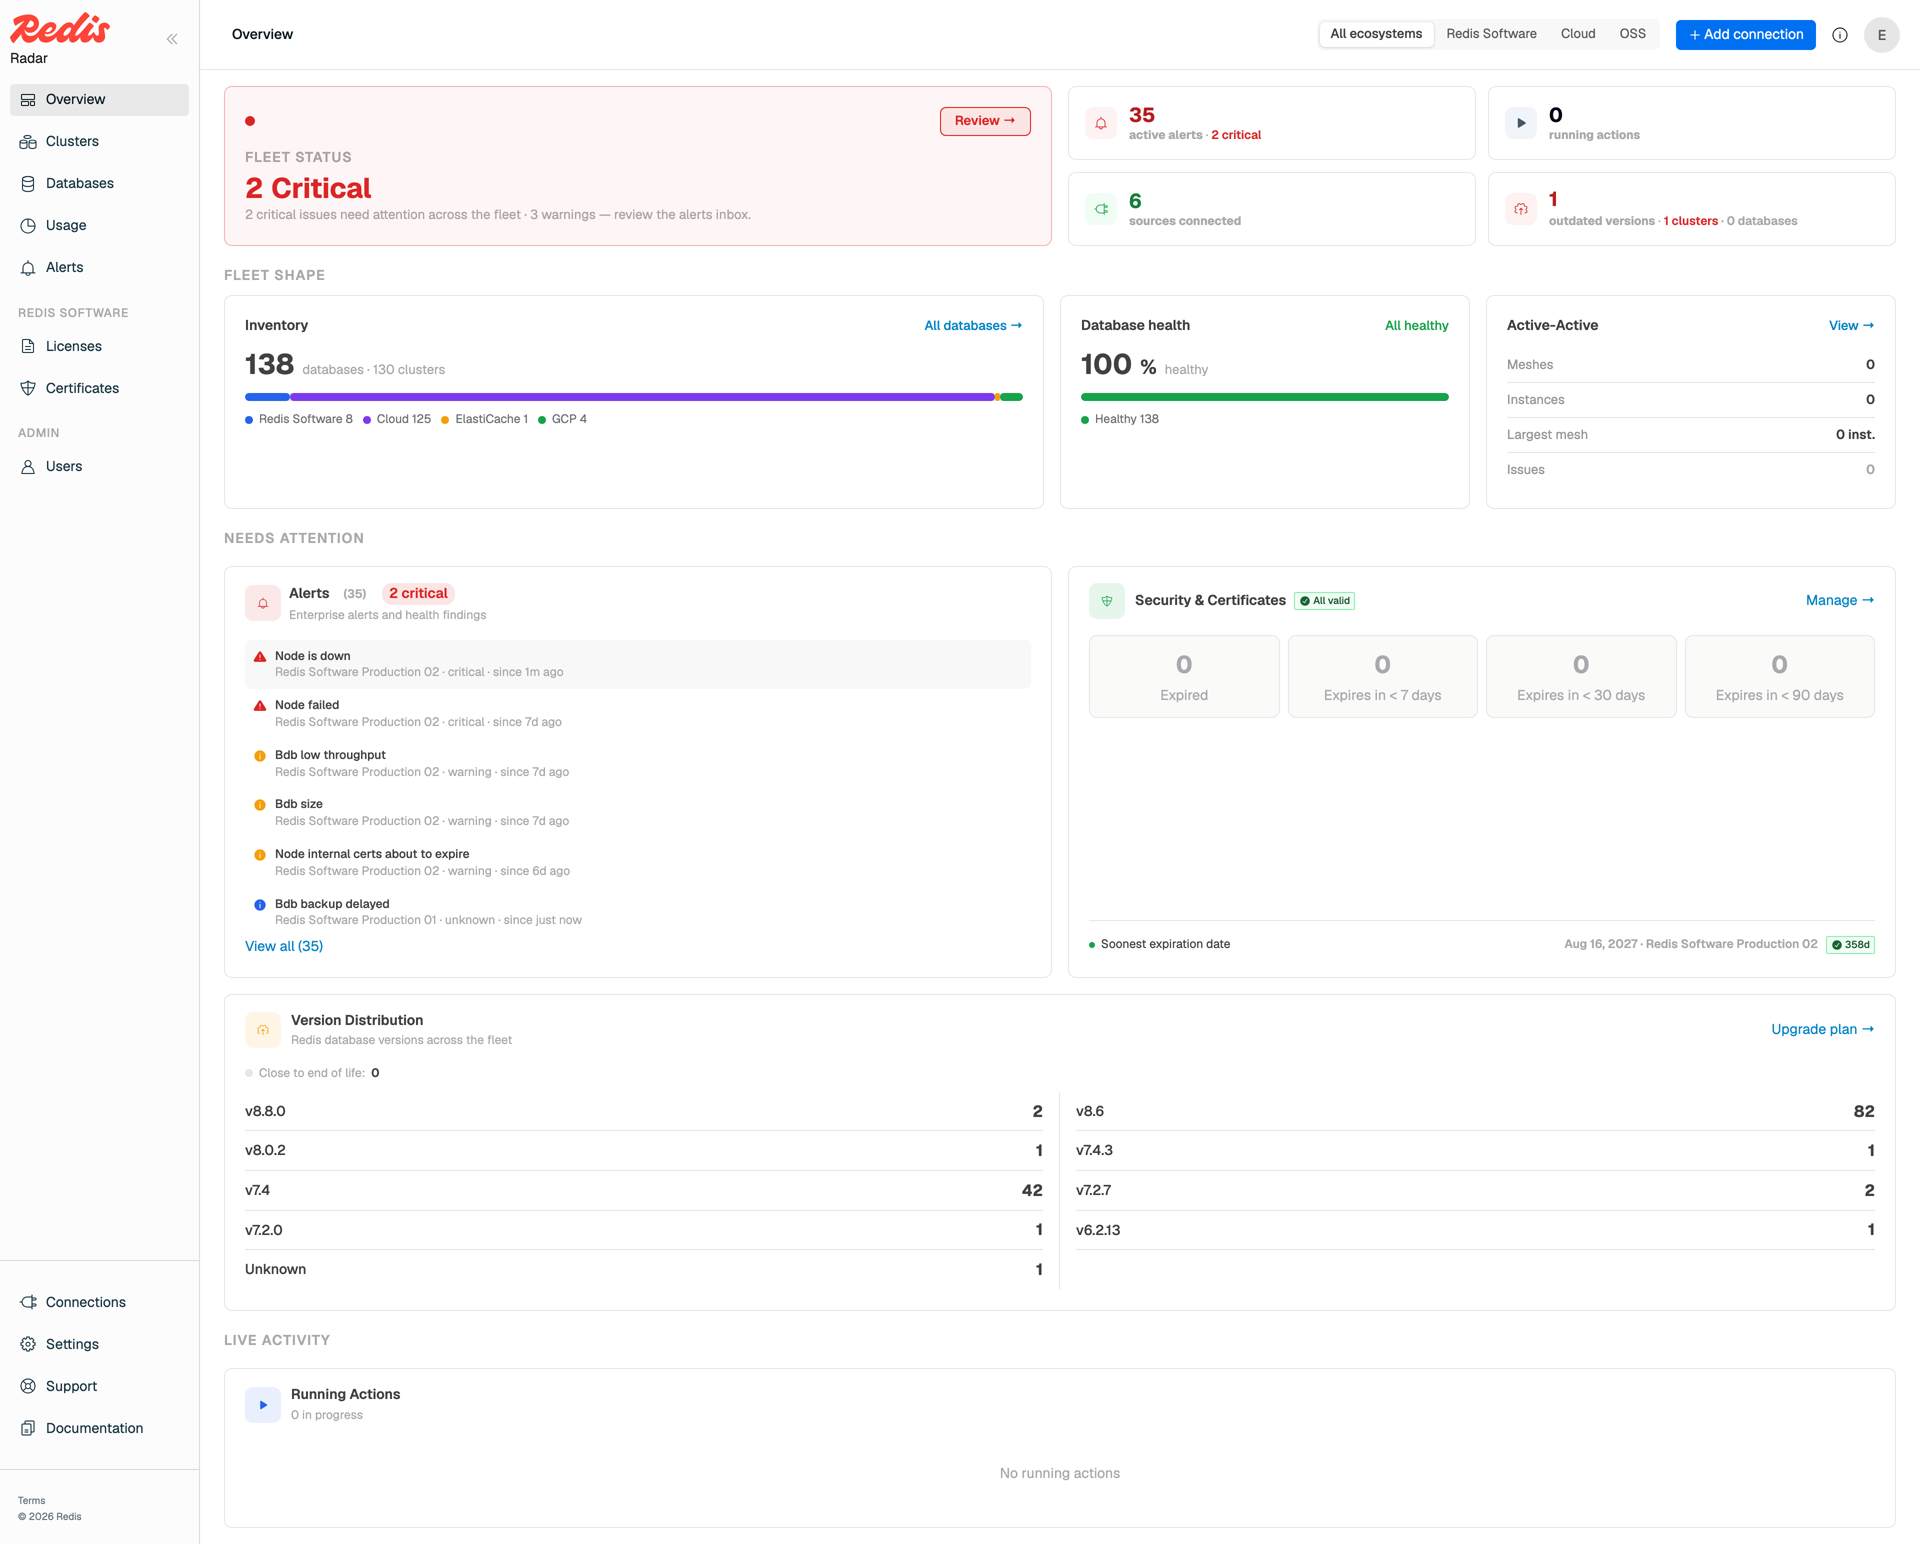
The Overview answers one question for a fleet too large to check by hand: is anything wrong anywhere?
- Fleet health. Cluster and database health side by side, so a problem that affects one database in one cluster is still visible at the top level.
- Redis deployments and version distribution. What you are running and how many versions you are spread across. Version sprawl is usually invisible until you look at a fleet-wide count.
- Hosts. Host inventory behind the fleet, so you can see what's backing your clusters without opening each one.
- Licenses and certificates. Anything expiring, summarized. See Licenses and certificates.
- Alerts. The most severe alerts currently raised. See Alerts.
- Running actions. Operations in progress on your clusters.
Clusters
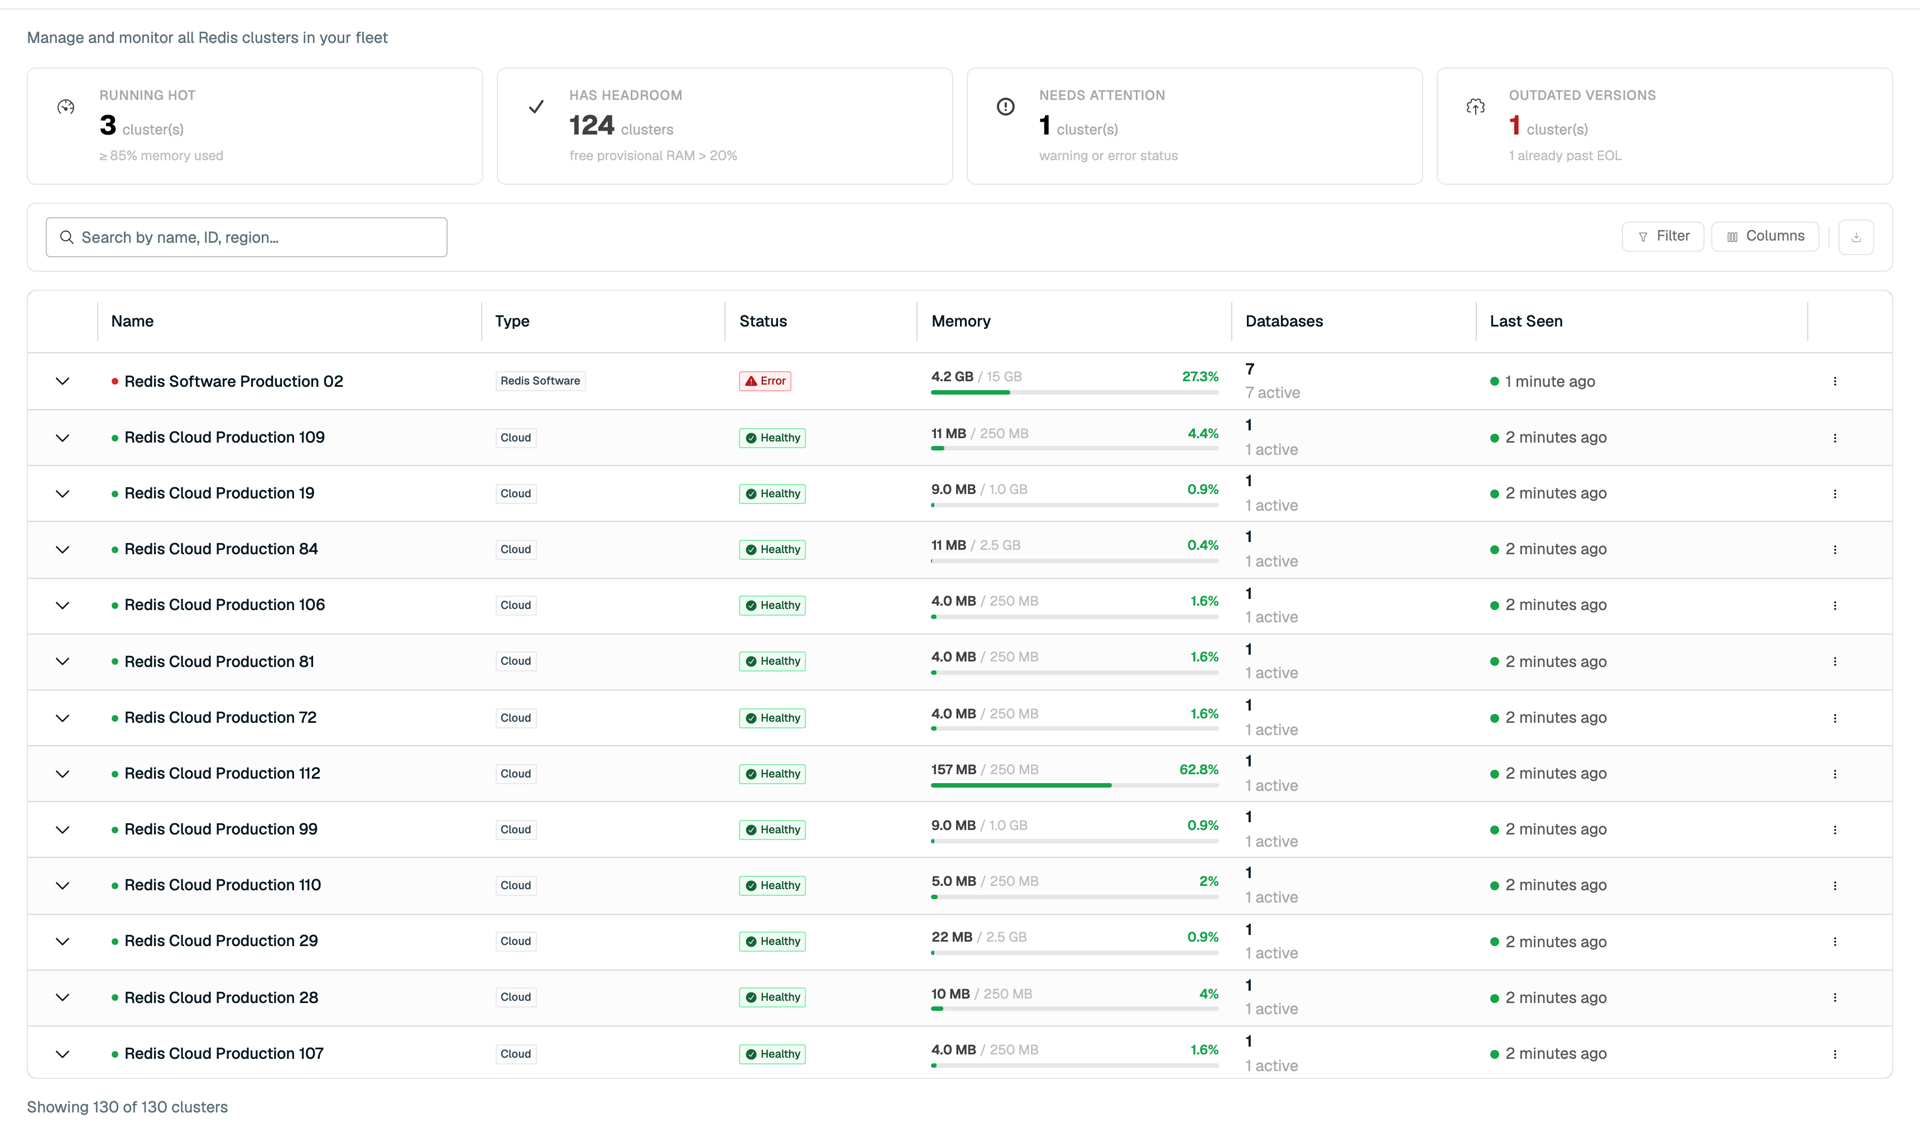
The Clusters list is one row per cluster, whichever deployment type it came from:
| Column | Description |
|---|---|
| Name | Your display name for the cluster. |
| Type | Deployment type: Redis Software, Redis Cloud, or Redis Open Source. |
| Account ID | The account the cluster belongs to, for cloud connections. |
| Region | The cloud region it runs in, for cloud connections. |
| Status | Current health: Healthy, Warning, or Error. |
| License | Shards used against the license's shard limit, as a count and percentage. Reads N/A if the cluster has no license or limit. |
| Plan | The subscription plan, for cloud connections. |
| Memory | Memory in use. |
| Hosts | Number of hosts. |
| Databases | Number of databases. |
| Version | Redis database version. |
| Last Seen | When Radar last collected this cluster's state. |
Sort by Name or Memory; the other columns are display-only.
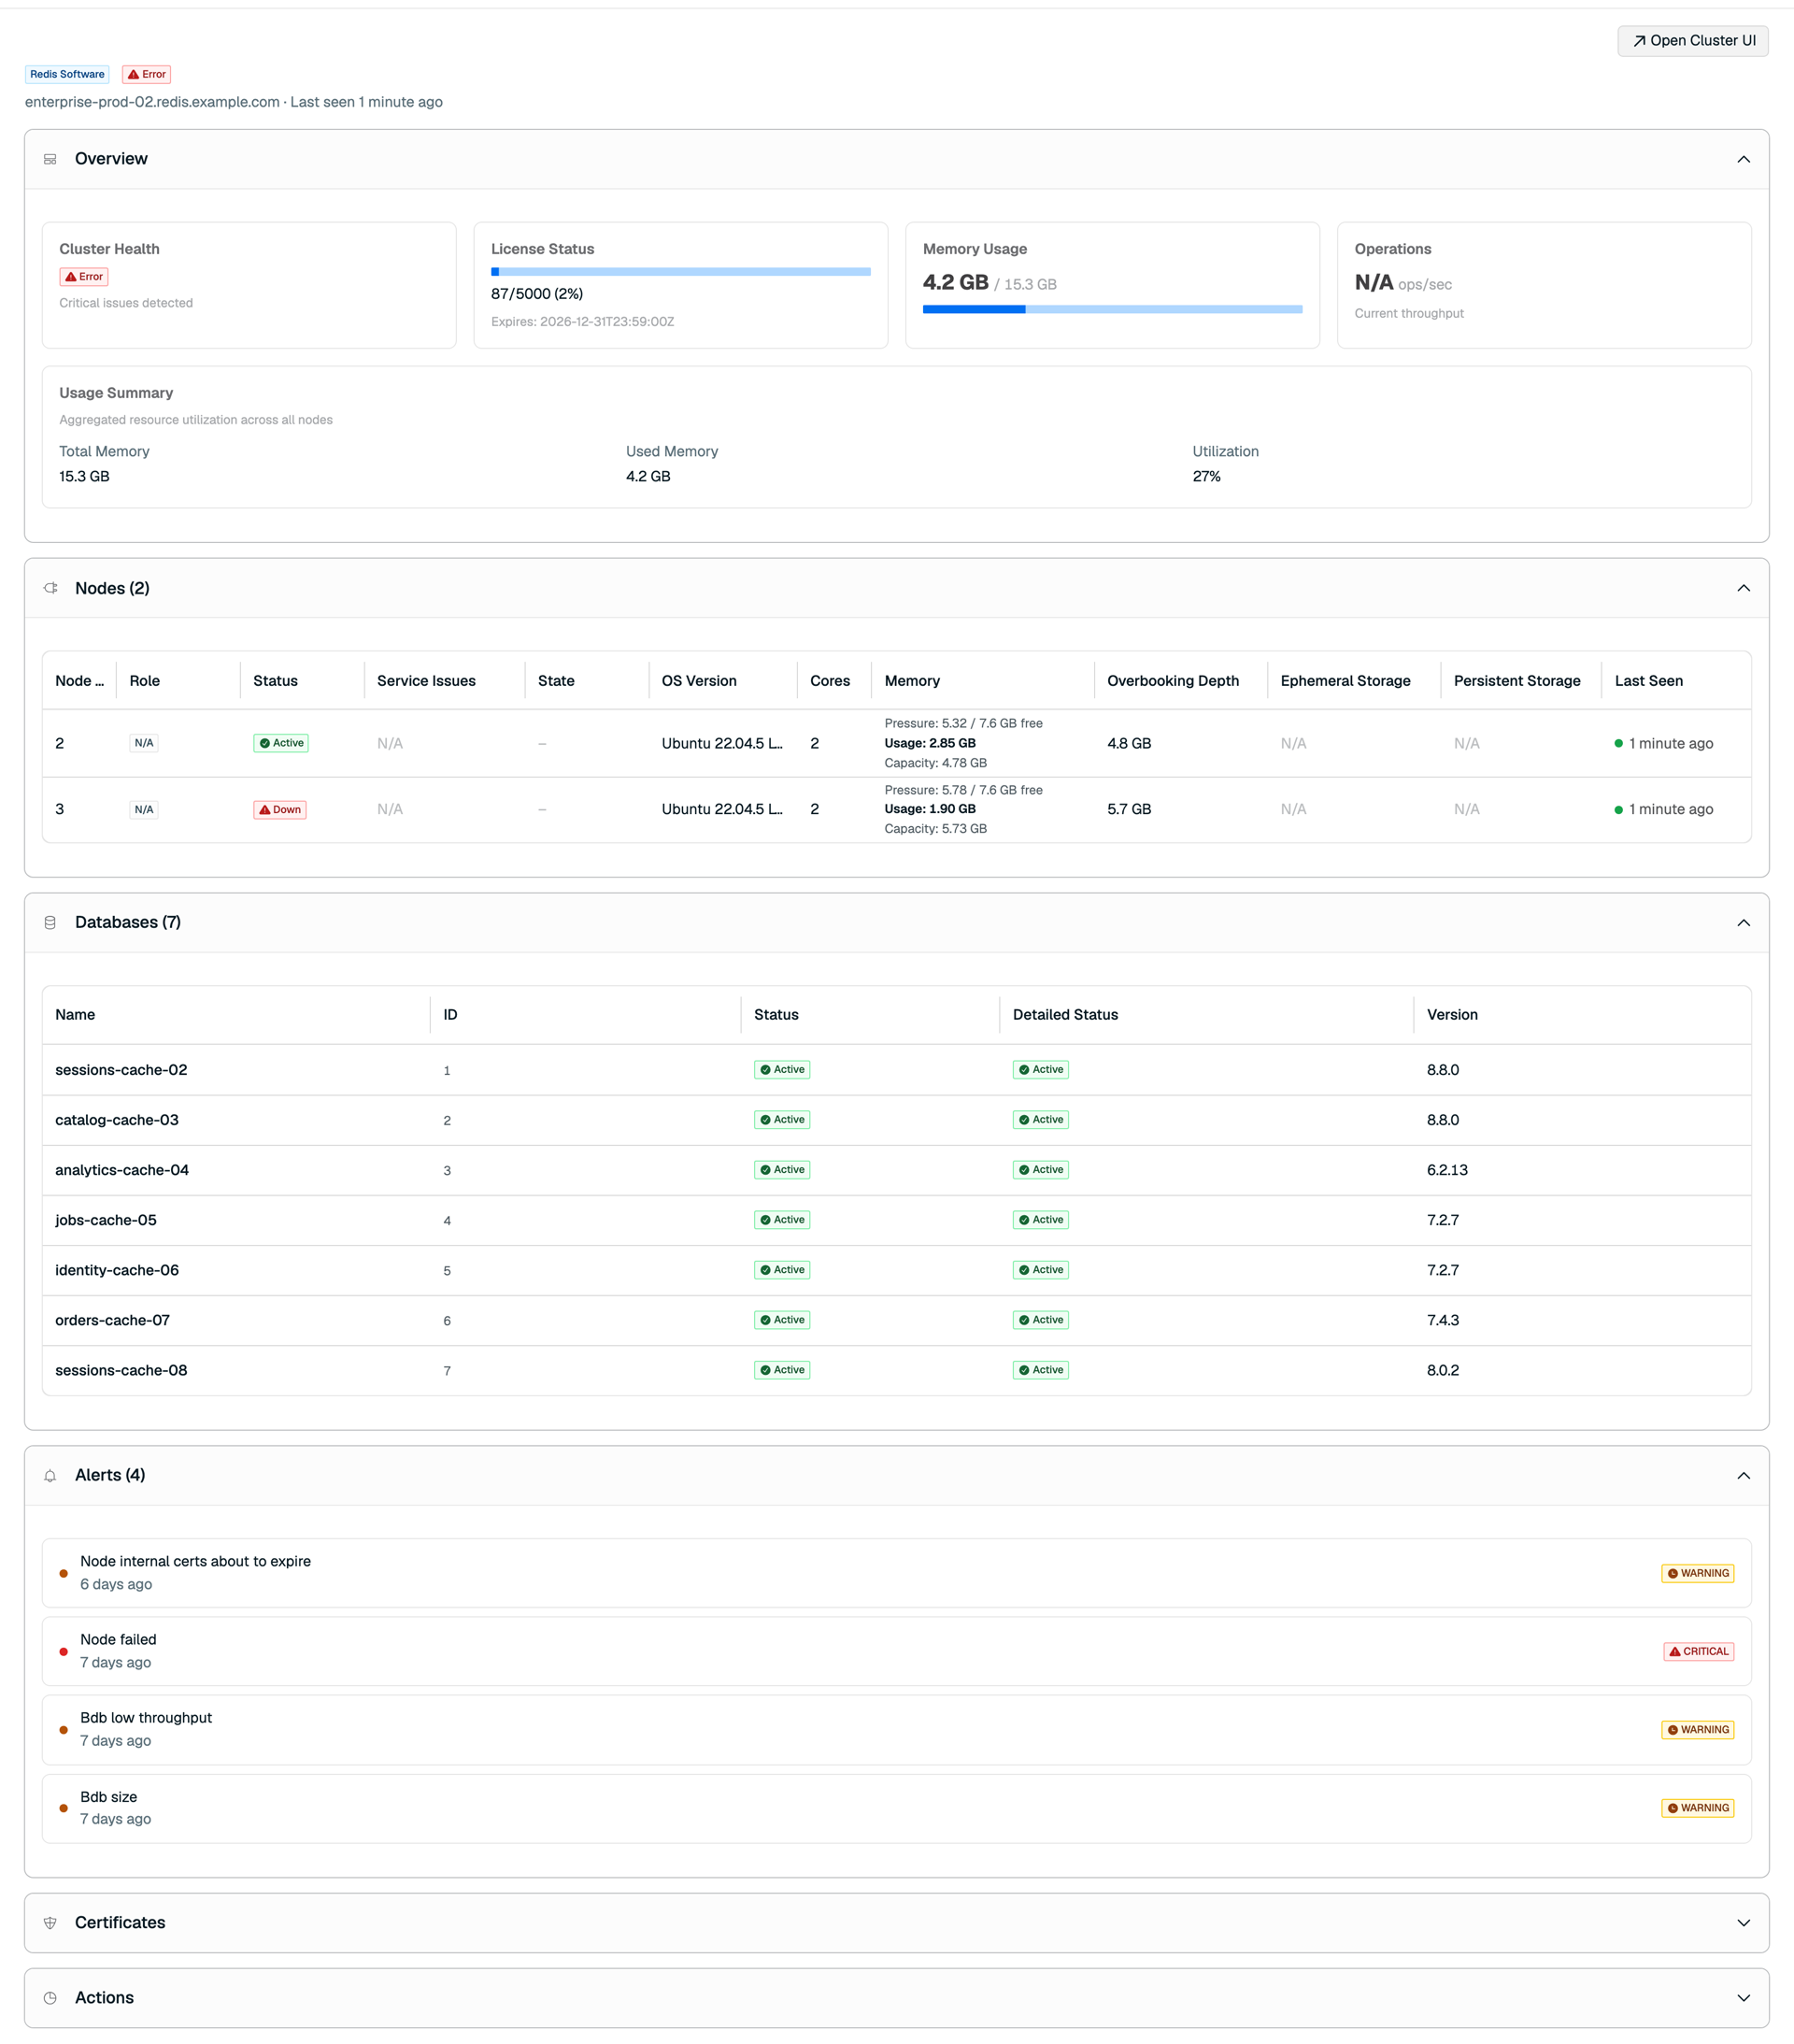
Select any cluster to open its detail view, which carries that cluster's nodes, databases, and configuration.
For Redis Software clusters, select a row's More options menu and choose Open cluster UI to jump straight to that cluster's own management console in a new tab.
Databases
The Databases list crosses cluster boundaries, so you can find a database without knowing which cluster it lives on:
| Column | Description |
|---|---|
| Name | The name reported by the source: an administrator-set name for Redis Software, Redis Cloud, and Redis Open Source, or the AWS or Google Cloud resource identifier for Amazon ElastiCache and Google Memorystore. |
| Cluster / Resource | The Redis cluster it belongs to, or the Amazon ElastiCache or Google Memorystore resource it came from. |
| Type | Deployment type: Redis Software, Redis Cloud, Redis Open Source, Amazon ElastiCache, or Google Memorystore. |
| Status | Current health: Active, Warning, or Down. |
| HA Status | High-availability state, including Active-Active replication health. |
| Version | Redis database version. |
| Memory | Memory in use. |
| Last Seen | When Radar last collected this database's state. |
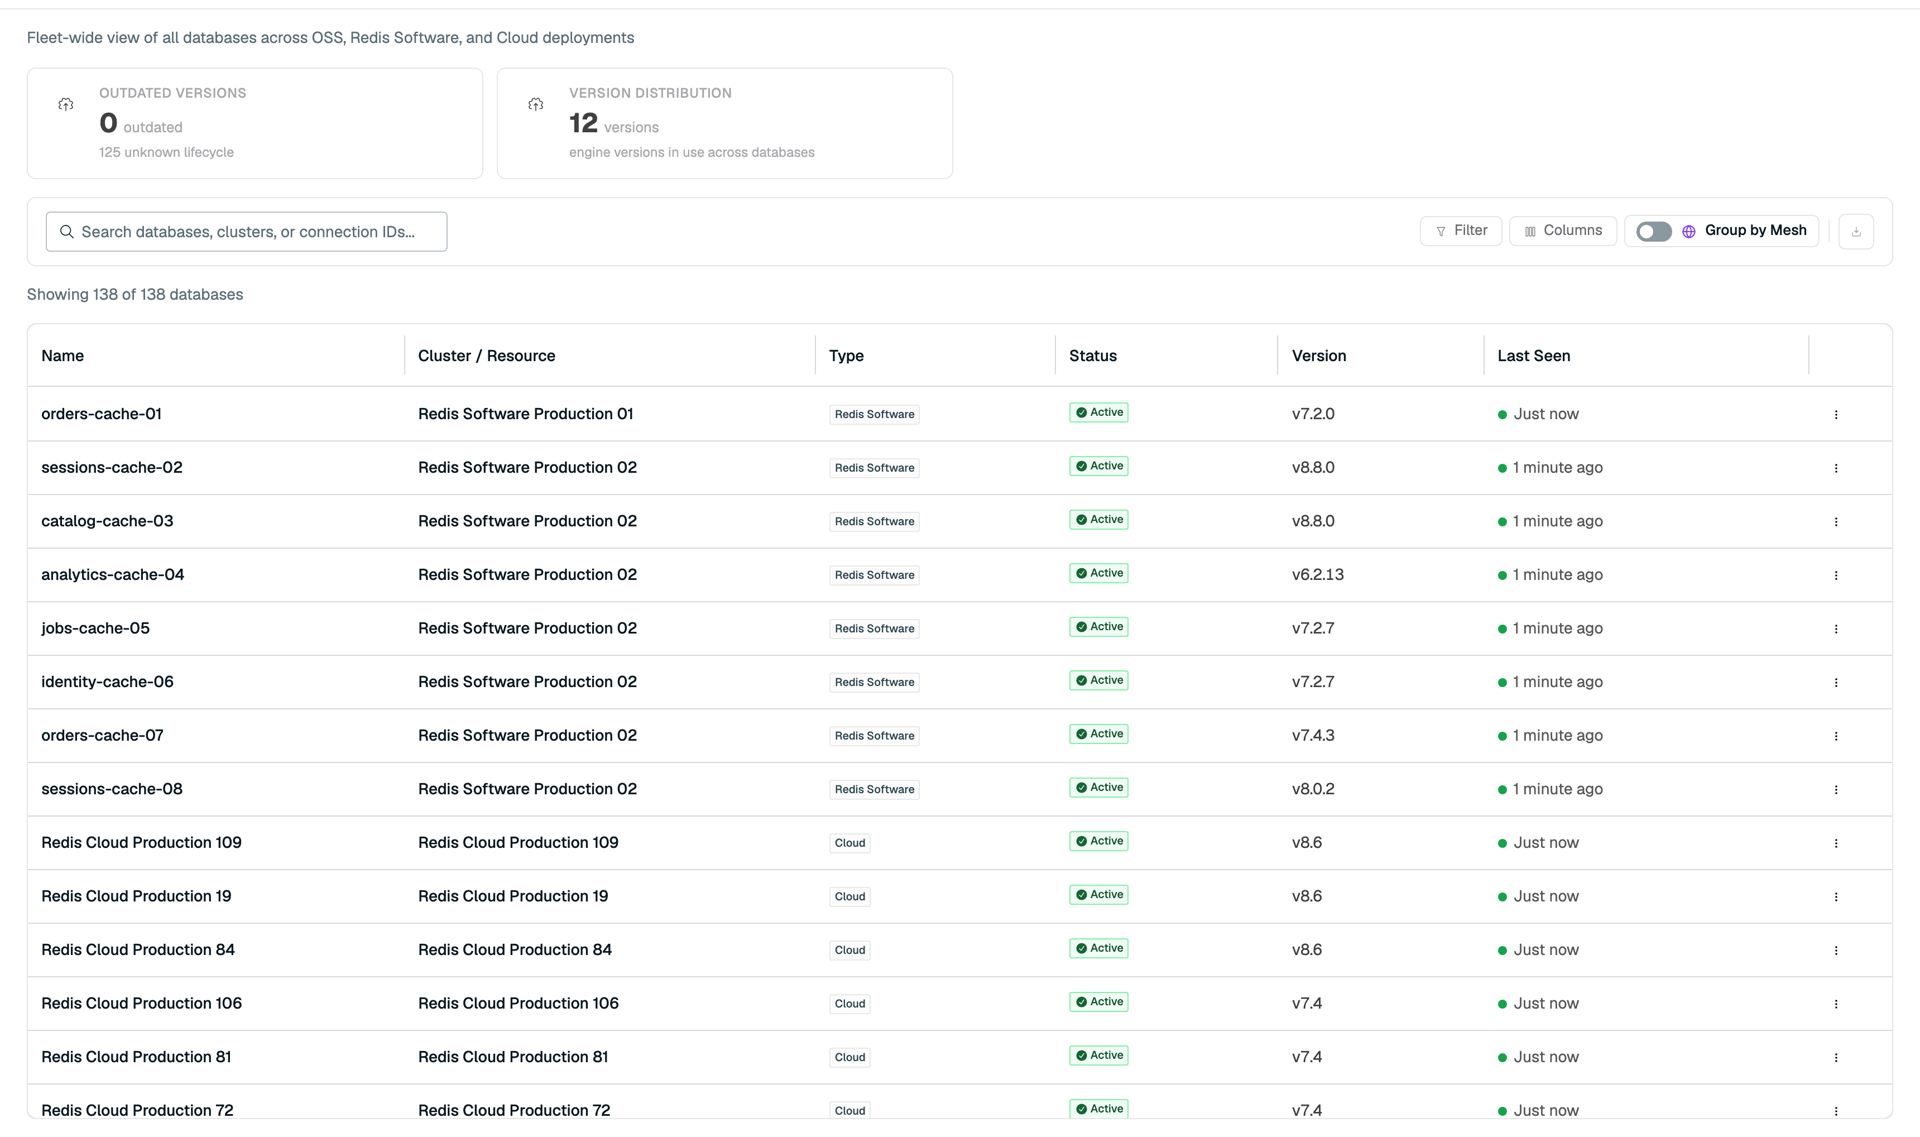
Select a database to open its detail view.
Active-Active databases
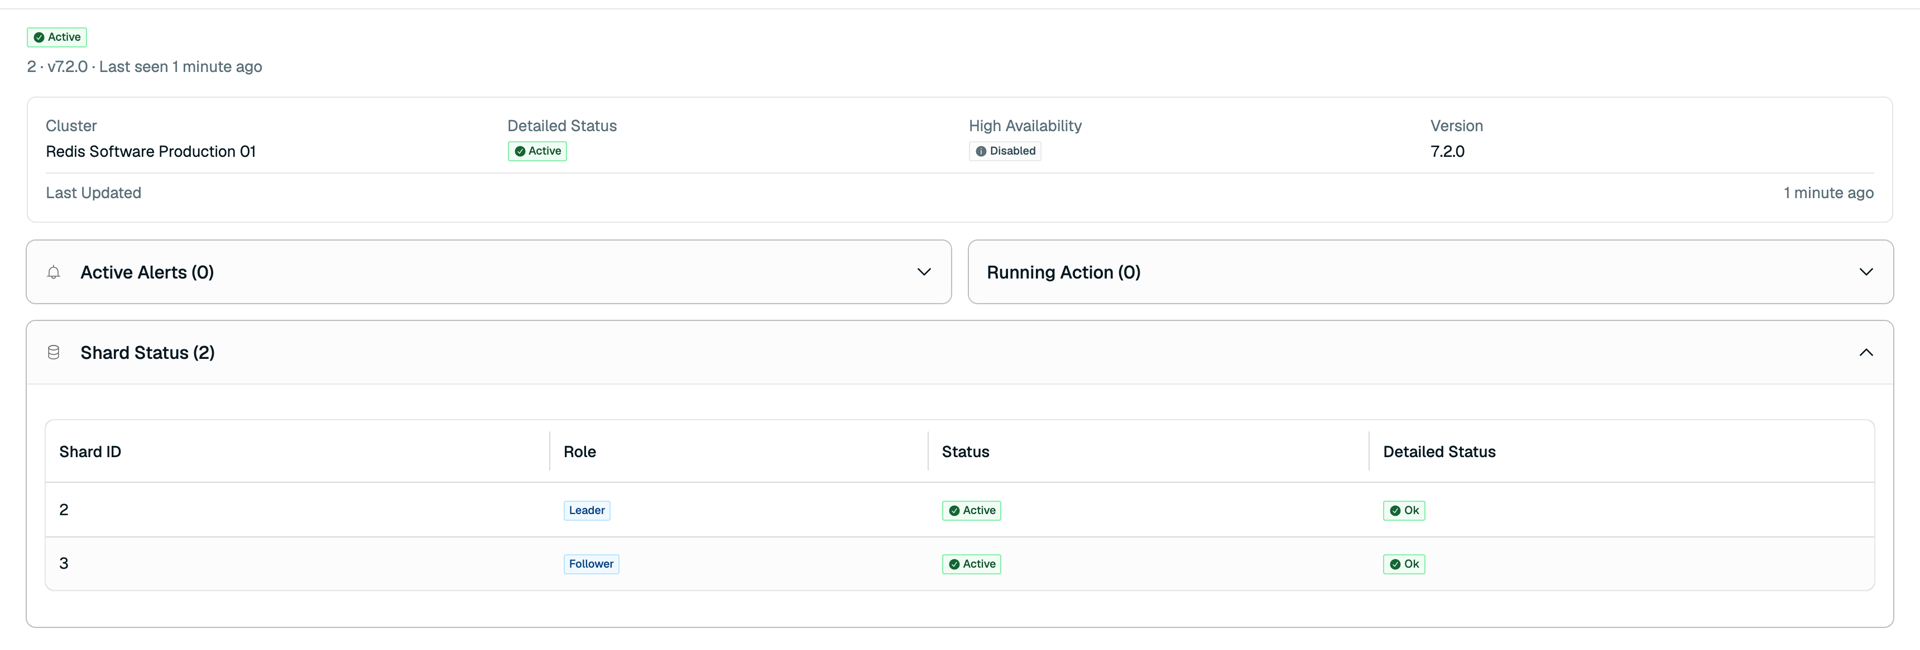
Radar identifies Active-Active databases and reports their replication health as the cluster reports it, so a replication problem between regions shows up in the same list as everything else. Radar passes through the health values the cluster supplies rather than reinterpreting them.
Usage
The Usage view is about consumption against your licensed limits, rather than health. It covers Redis Software clusters only; databases from other Redis deployments do not appear here.
Usage is collected about once an hour, so a number here can be up to an hour behind the health figures on the Overview.
Select a row to open that cluster's usage report, which breaks memory, ops/sec, and shard usage down by database.
| Column | Description |
|---|---|
| Cluster | The Redis Software cluster this usage report covers. |
| Memory (Used / Provisioned) | Memory consumed against memory provisioned. Can read N/A — see When a value reads N/A. |
| Ops/Sec | Throughput. Can read N/A — see When a value reads N/A. |
| Shards (Used / Limit) | Shards in use against the licensed shard limit. |
Alerts
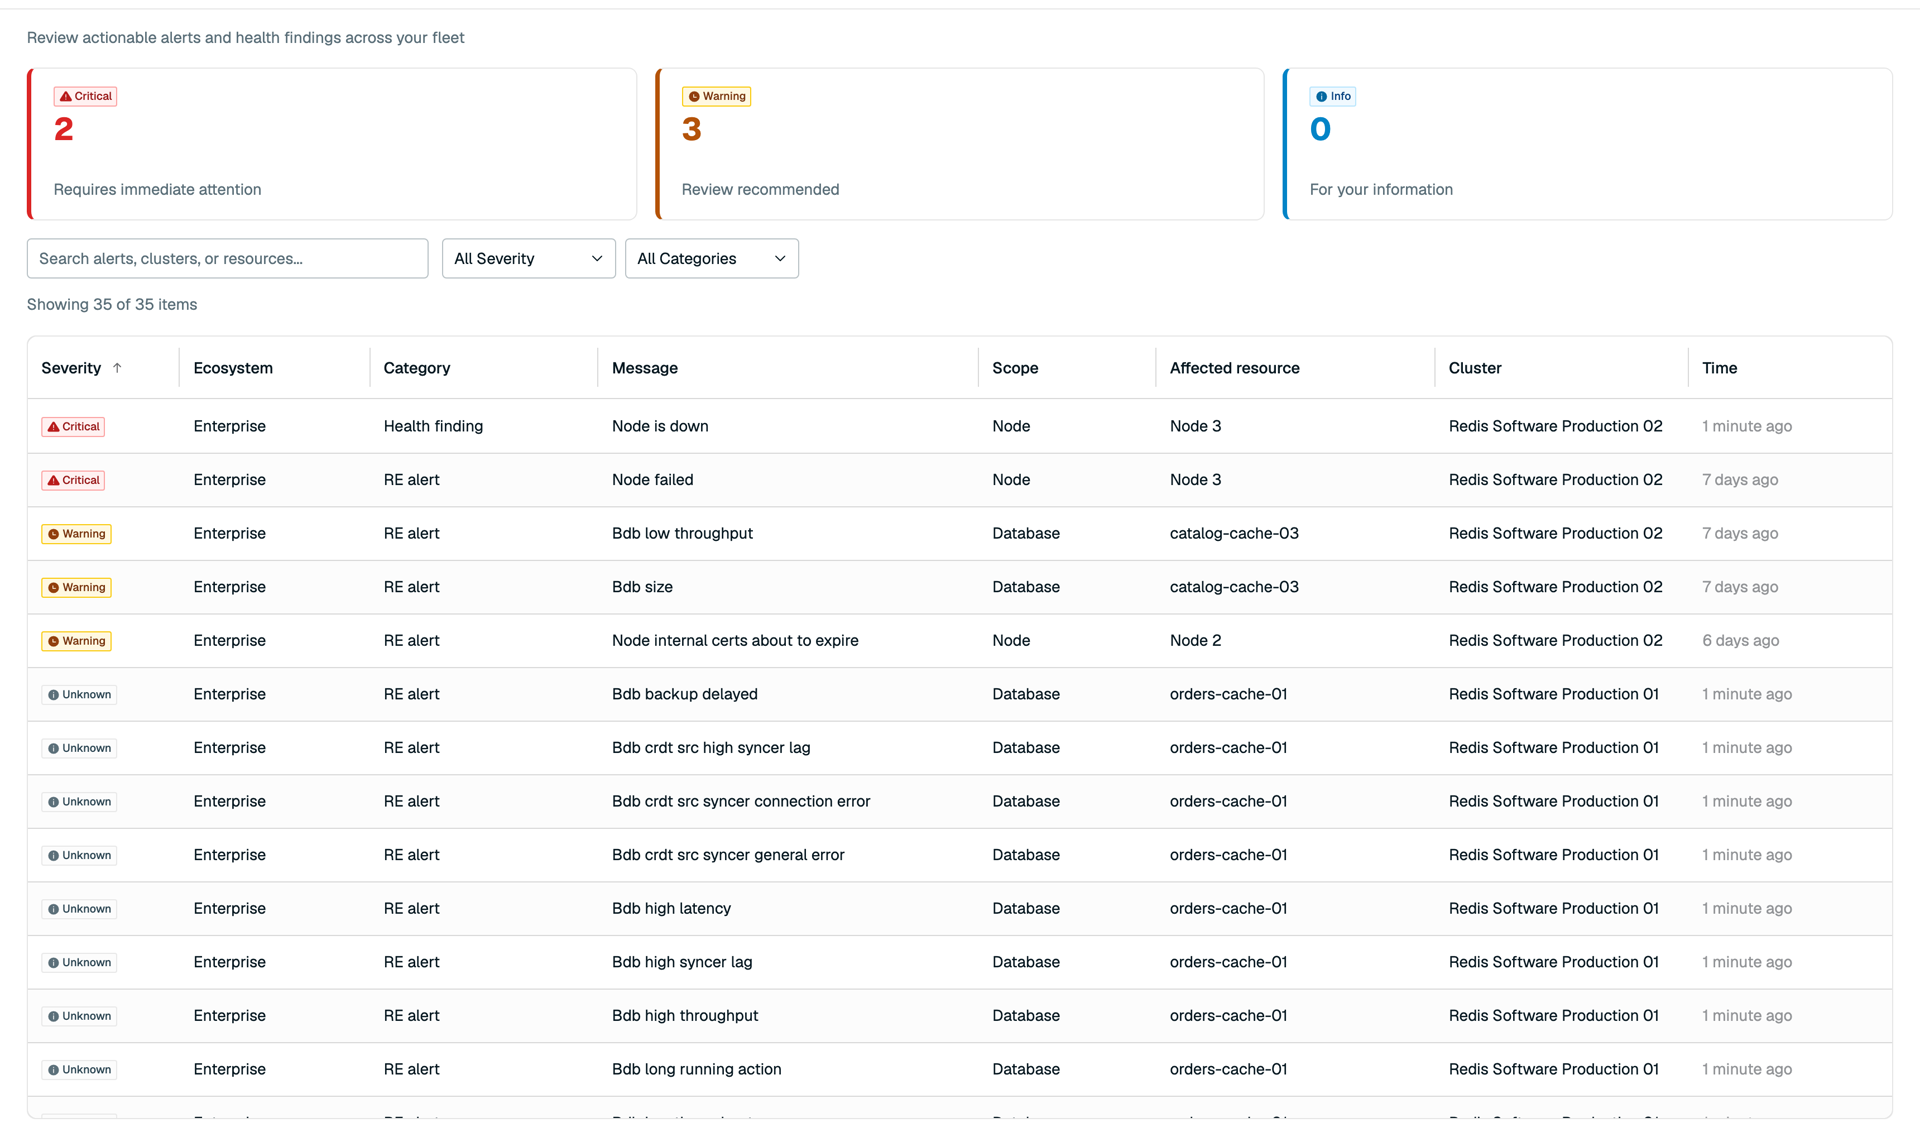
The Alerts view collects the alerts your clusters are already raising and puts them in one list, ordered by severity: critical, warning, then informational. It covers Redis Software clusters and nodes only; alerts from other Redis deployments do not appear here.
Radar reads alerts from each cluster's own alert endpoints, at the cluster and node level. The alert rules live on the cluster, not in Radar. To change what raises an alert, change it on the cluster; Radar reflects the change the next time it collects that cluster's state.
Filter by severity or search by alert, cluster, or FQDN. Select the cluster name in an alert to open that cluster's detail view.
Download a support package
Download a diagnostics package from a Redis Software cluster to attach to a Redis Support ticket. Only administrators can do this. See Manage access to view the administrators for your Radar deployment.
Download it from the cluster's detail view, or from the Support page if you'd rather pick the cluster from a list.
The download runs in your browser, so it might take several minutes to prepare the package for a large cluster. The download will continue while you navigate elsewhere in Radar, but will cancel if the tab is closed or reloaded.
To send Redis Support information about Radar itself rather than a cluster, see Download Radar diagnostic logs.
Download Radar diagnostic logs
On a self-managed install, you can download Radar's own diagnostic data to attach to a Redis Support ticket. Only administrators can do this. This option is not available in Radar on Redis Cloud.
To download the diagnostic logs:
- Open Settings.
- Select Download logs in the page header.
Download logs is also on the Data & Monitoring tab, under Diagnostic Export.
Radar downloads a ZIP file named mcm-diagnostic-logs-<timestamp>.zip. It holds CSV files covering the last 30 days of connections, collection requests and runs, connection actions, audit events, and errors.
It does not include stored credentials or a Redis Software support package. It does include usernames, IP addresses, connection names, and warning and error messages from Radar's services. To get diagnostics from a cluster, download a support package instead.