Blog
Redis Enterprise Monitoring Options
What would you say if you started a new role and arrived at your very first meeting with your very first customer, equipped with two days worth of plans for capacity planning, DNS matters, geo-distribution, and development in .NET … and the first question you got was: “How do we efficiently monitor the cluster and database?”
Well, with 16 years years of operations experience, I thought I was ready. In reality, of course, “The more I learn, the more I realize how much I don’t know.” Now, when I see a new piece of software, one of the first questions comes to my mind is how to ensure it runs properly in production? In other words, how do I monitor it?
With that in mind, I wrote this summary of Redis Enterprise monitoring options, from the system’s built-in monitoring capabilities to Prometheus Metrics Exporter—the best choice for many organizations—and the REST API for the most flexible way to integrate with third-party monitoring systems. I dedicate this blog post to my fellow operations people everywhere—the ones who don’t just want to run Redis Enterprise, but fully enjoy its flawless performance.
Redis Enterprise’s built-in monitoring capabilities
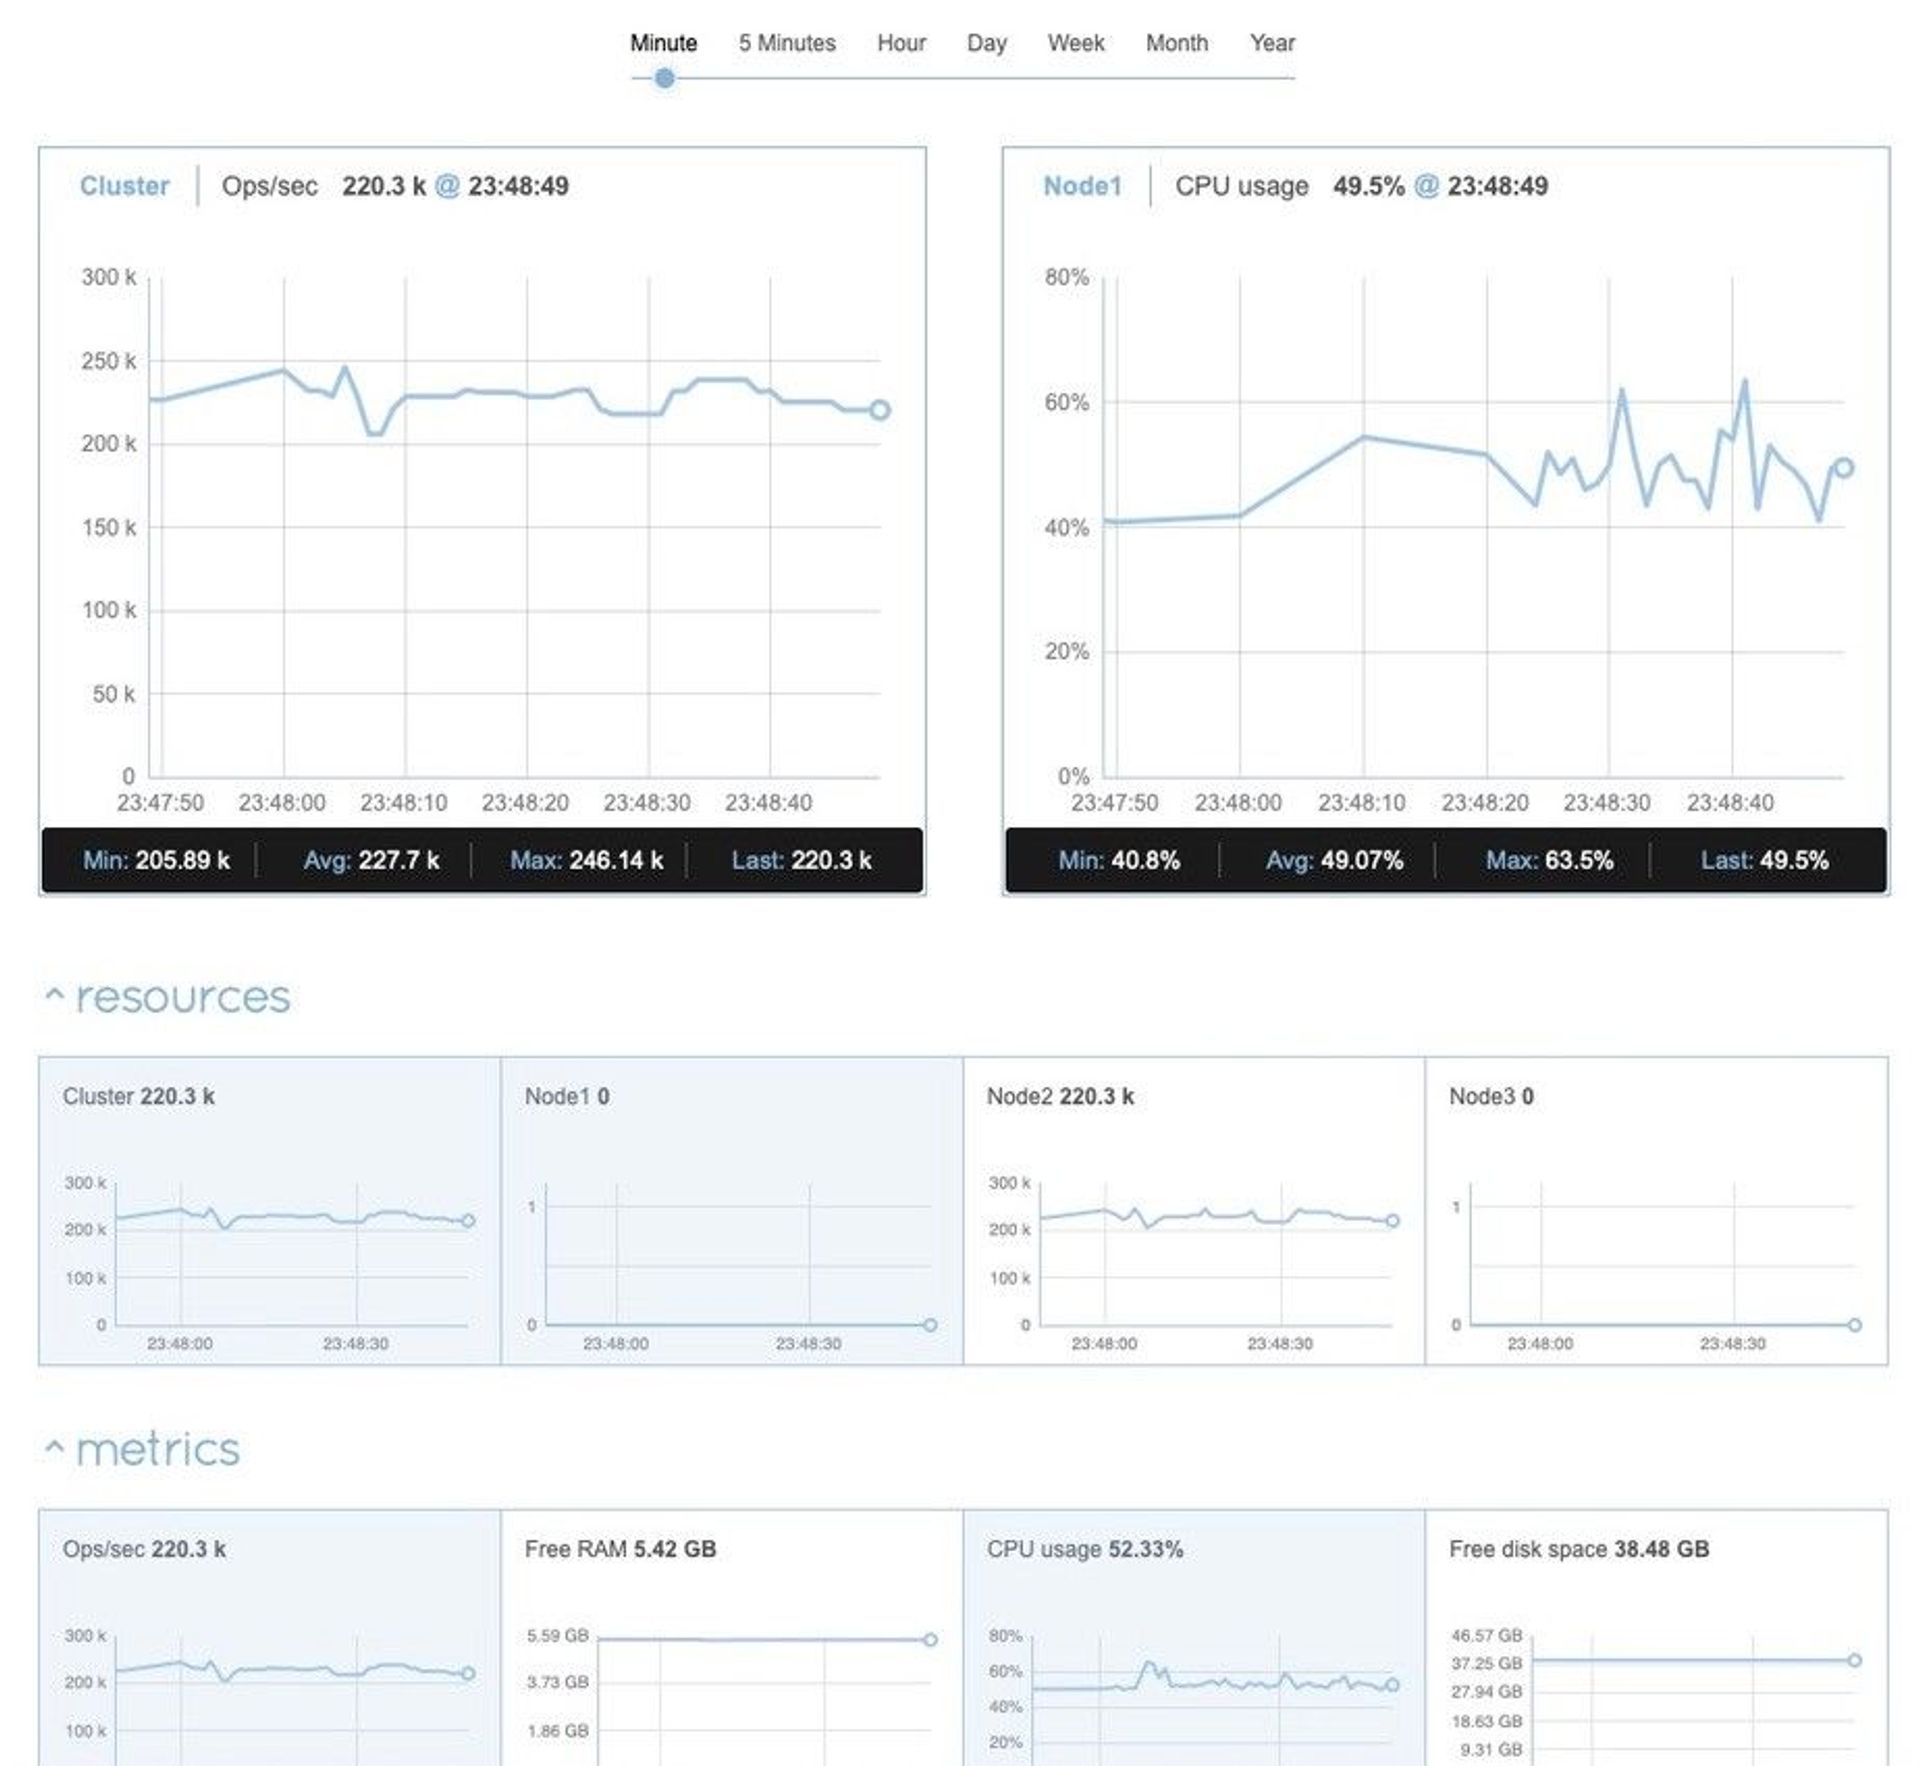
The Redis Enterprise cluster management UI monitoring console is often the best place to start with monitoring Redis. It’s visually appealing and doesn’t require any additional installation or configuration. Using the “minute” interval, it works almost real-time; and you also can switch between 5-minute, hour, day, week, month, and year intervals. The UI provides metrics for the cluster, each cluster node, and each database, all in separate screens:

The Redis Enterprise cluster management UI monitoring console provides separate screens for cluster, node, and database metrics.
Redis Enterprise also has an alert mechanism. You can set separate alerts for a cluster and each database. Alerts are displayed in the management UI on relevant pages (alerts for the cluster show up on the Cluster page, and so on) and you can configure alerts to be sent by email (SMTP), as shown here:

The set of the displayed metrics and alarms includes all major indicators, so you can start to monitor your Redis Enterprise just minutes after completing the installation. But what if you need more? Specifically, what if you want to integrate Redis Enterprise into your company’s existing monitoring infrastructure? That’s where Prometheus and Grafana come in.
Prometheus Metrics Exporter
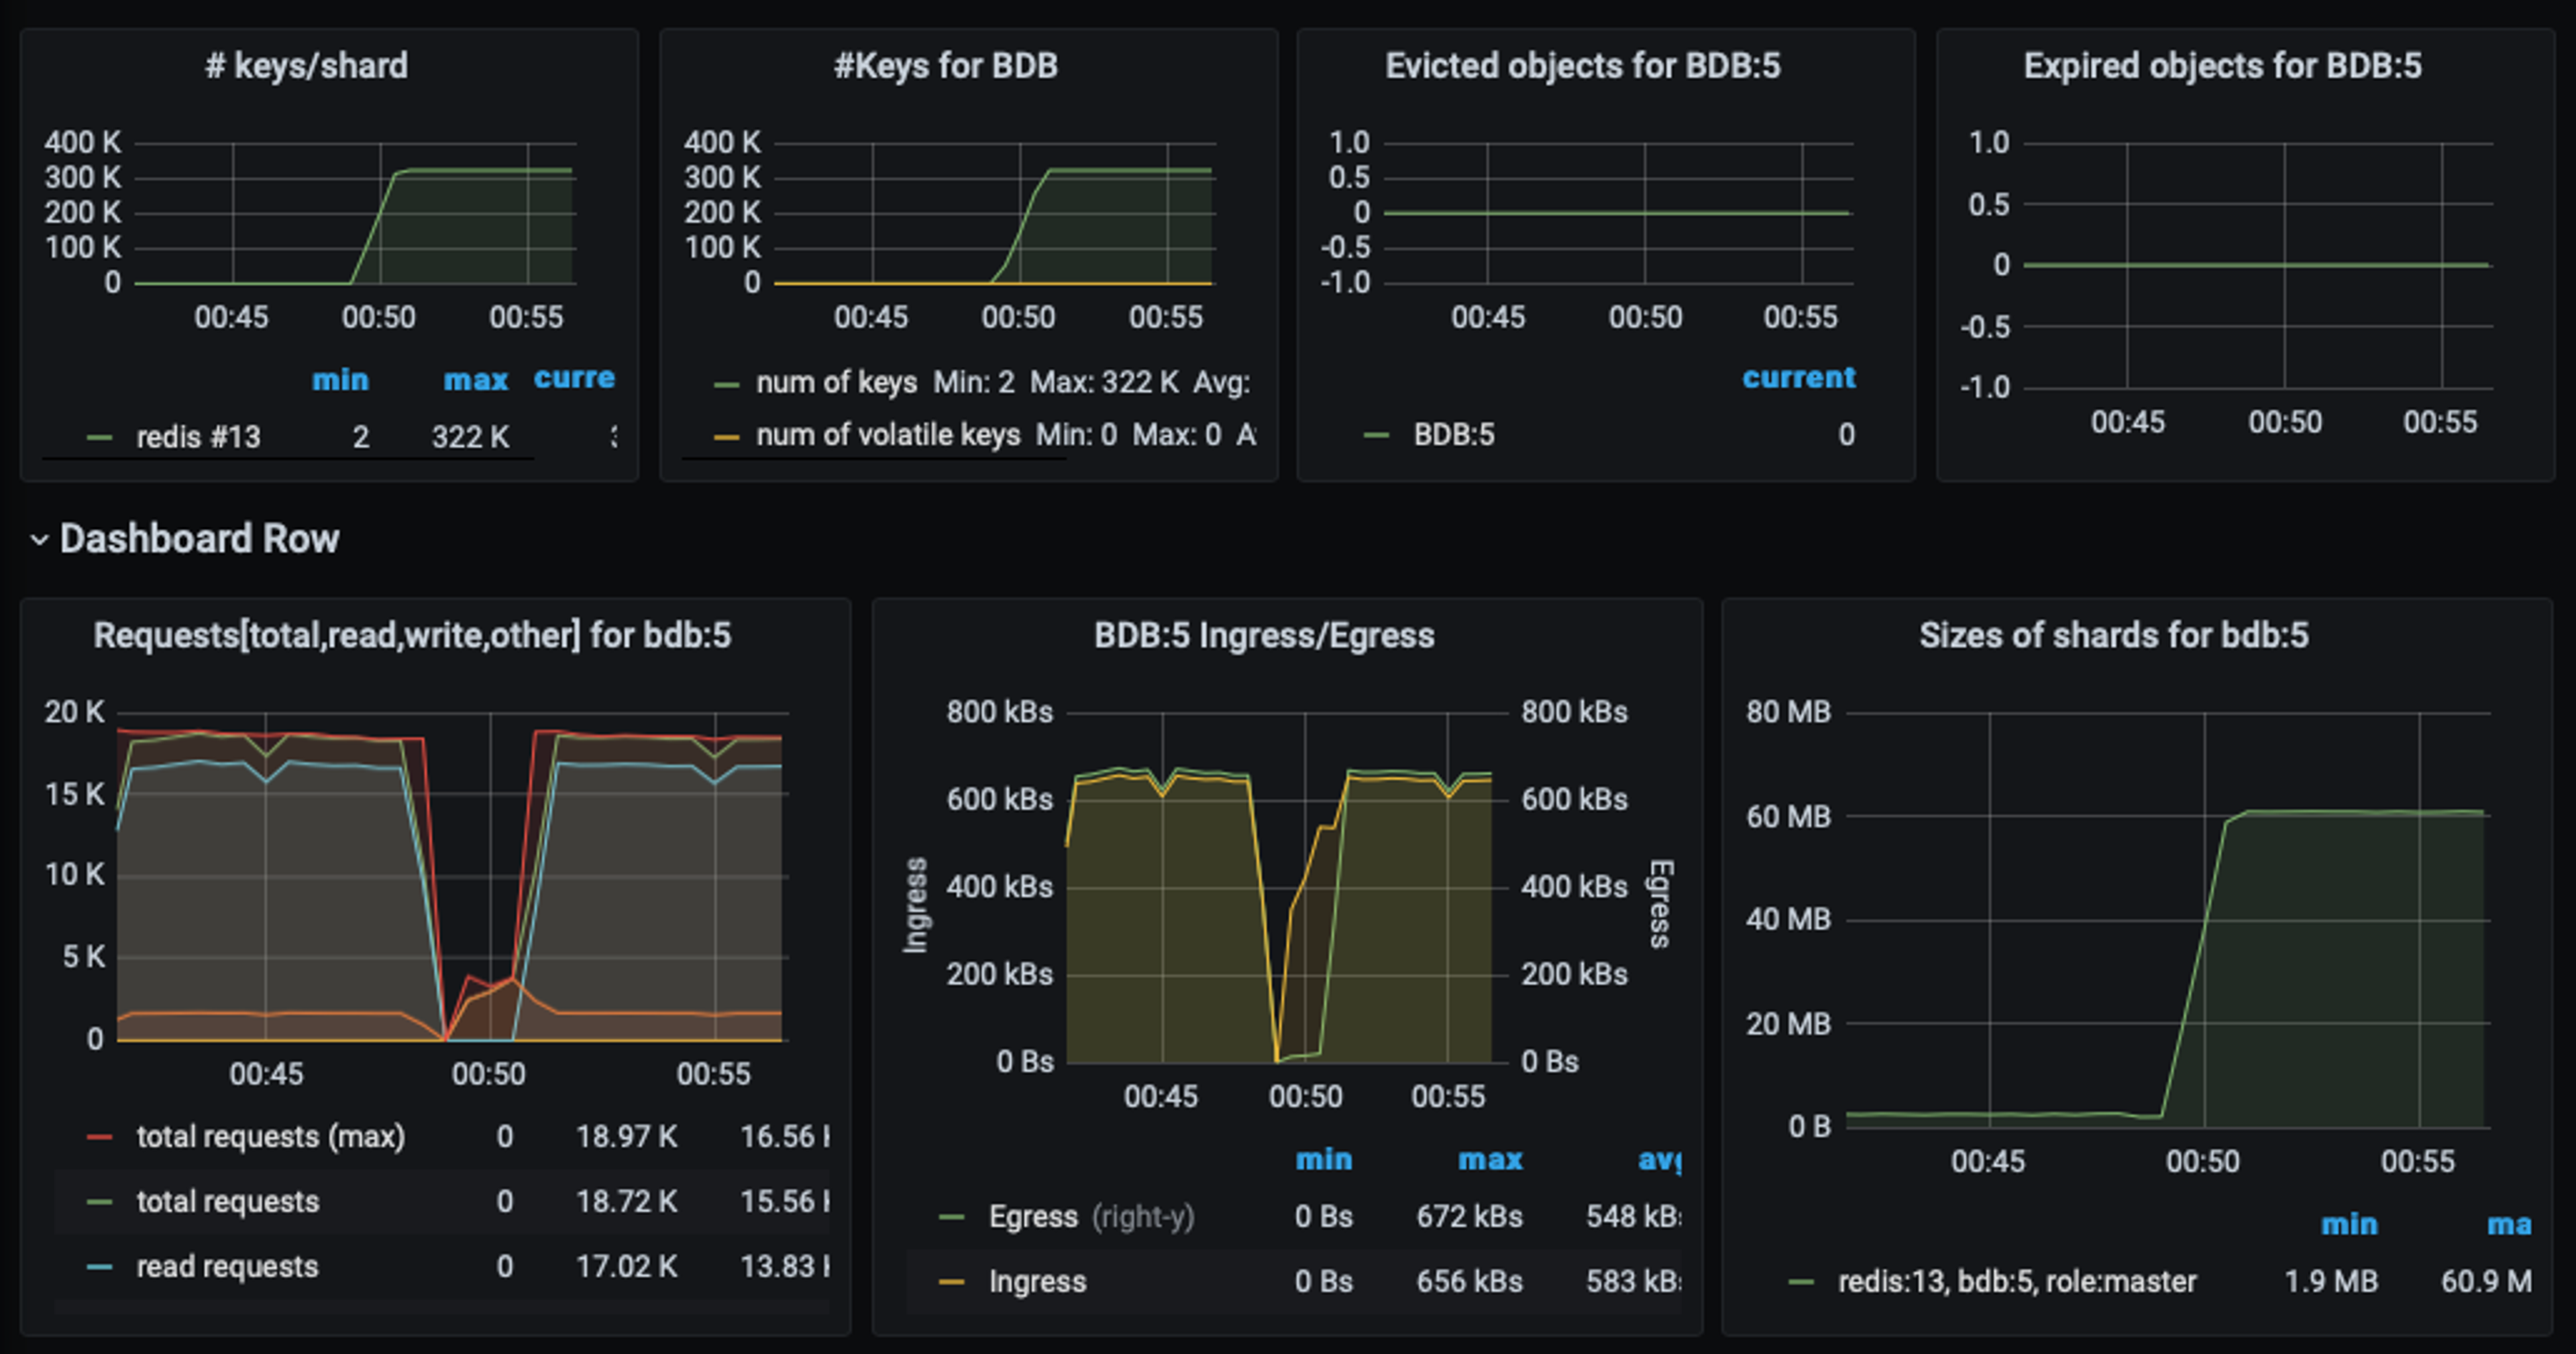
Prometheus and Grafana are a world-famous couple, together creating one of the most reliable modern monitoring tools. Redis Enterprise Cluster software includes an exporter for Prometheus metrics, so the most challenging task of any monitoring integration—collecting the proper metrics—is taken care of automatically.
That helps make setup and configuration of Prometheus and Grafana quick and easy. The Redis documentation includes instructions for integration with Prometheus, a comprehensive list of exported metrics, and basic Grafana dashboards. Metrics are exposed at the node, database, shard, and proxy levels. Alerts can be set up in Prometheus AlertManager and conveniently delivered via the dozen different channels including email, Slack, PagerDuty, and others.

For many companies, Prometheus and Grafana represent the best way to monitor Redis, not to mention a wide variety of other modern hardware and software.
Just as important, using the Prometheus Metrics Exporter, a wide variety of monitoring platforms with the capability to scrape the metrics from the Prometheus exporter can be connected to Redis Enterprise. For example, New Relic recently published a blog post about integrating New Relic with Prometheus exporters.
REST API
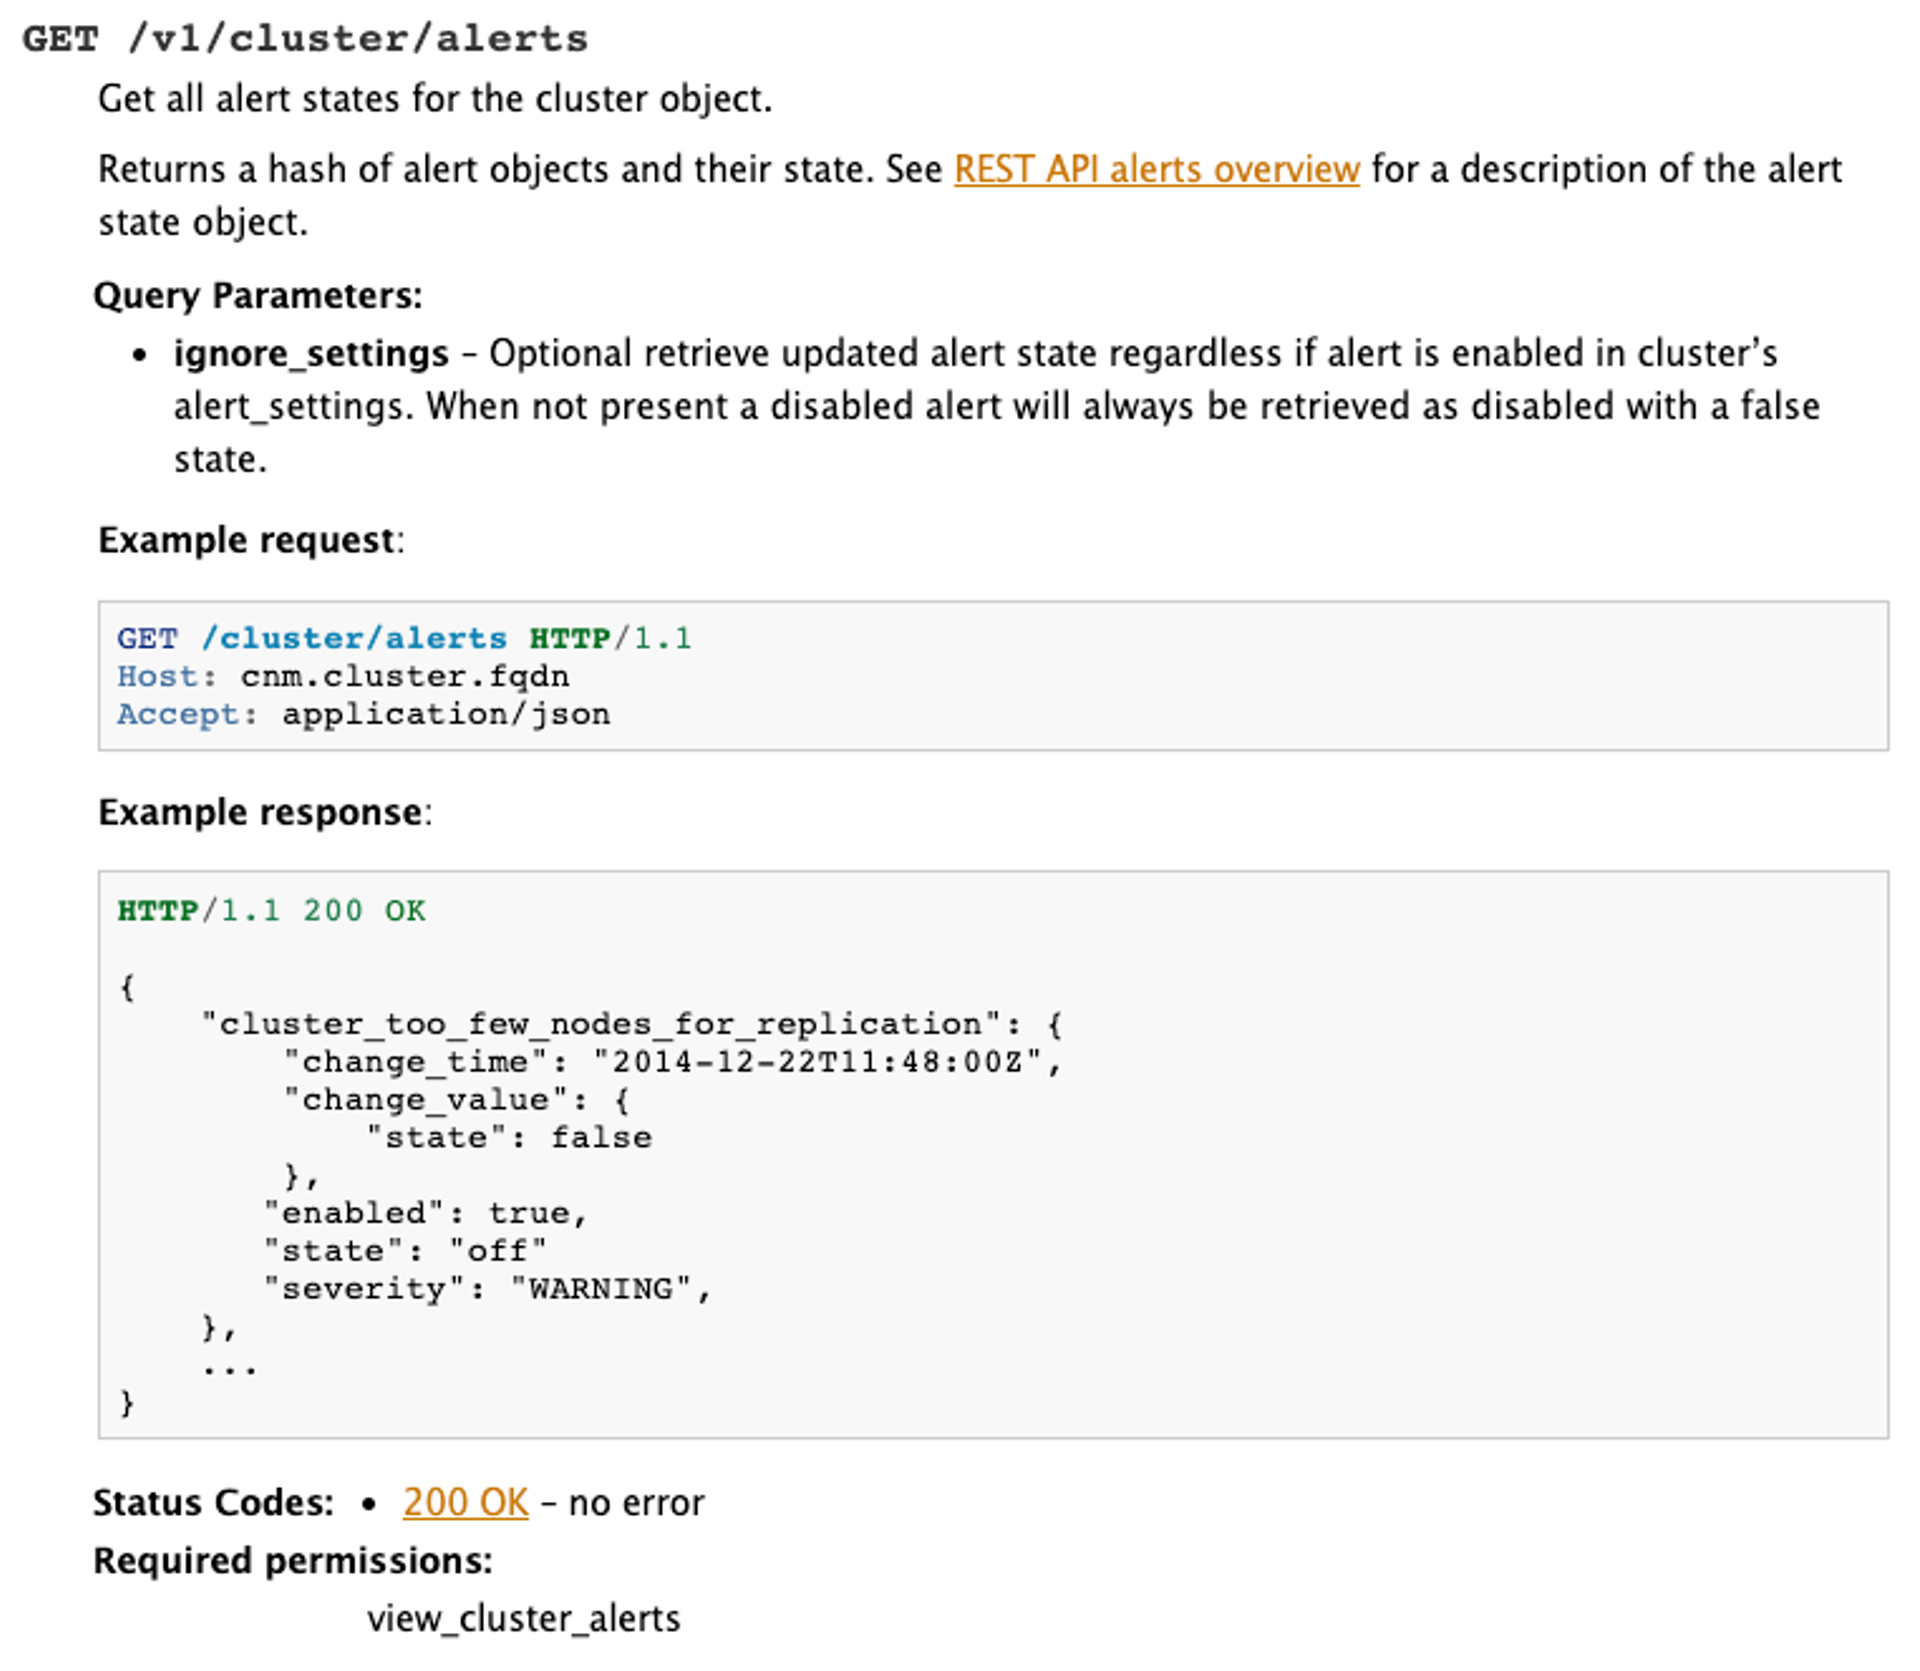
For companies that need even more flexibility, the Redis Enterprise REST API provides a great deal of functionality, including getting both statistical metrics and alerts. The REST API is the most universal and flexible way to achieve a third-party monitoring integration, both internal or industry standard. The REST API documentation can be found in the usr/share/doc/redis/rlec_rest_api.tar.gz directory on each node where Redis Enterprise software is installed.

A great example of using the REST API is the Redis Enterprise Add-On for Splunk, available in the Splunk marketplace. Another good example is the AppDynamics plugin, available at AppDynamics Exchange.
Conclusion
Put it all together, and it’s clear that Redis Enterprise is well equipped with monitoring capabilities, giving customers a choice of which monitoring solution to use in a particular situation.
In my opinion, if Redis Enterprise’s built-in monitoring is not enough for you, the best choice is usually Prometheus and Grafana. Especially since it can work with many popular enterprise monitoring systems. If that solution is not applicable for your organization, you can use the REST API to integrate with virtually any third-party monitoring system. If none of those options are acceptable, well, it’s time to get creative!
Get started with Redis today
Speak to a Redis expert and learn more about enterprise-grade Redis today.
