Blog
3 Real-Life Apps Built with Redis Data Source for Grafana
Update 3/29/21: https://coronavirusapi.com/ has recently closed free access to its data, making it only available for registered first-responders. While this unfortunately means the coronavirus case visualization project demo won’t work anymore, our hints will still be useful for many other implementations when you need to display RedisTimeSeries data on the Grafana Worldmap panel.
In previous posts, we introduced and showed how to use the new Redis Data Source for Grafana:
- Introducing the Redis Data Source Plug-in for Grafana
- How to Use the New Redis Data Source for Grafana Plug-in
In this post, we want to explore some real-life examples designed to give you ideas about the many interesting datasets you can store in Redis and visualize in Grafana. We’ll cover three different applications:
- Weather dashboard
- Coronavirus cases visualization
- Pop-up store demo
1. Weather dashboard
Do I really think that the world needs yet another weather dashboard? Yes, I do!
Sure, most of the time I’m not much of a weather geek. I often don’t really care what the weather is like. And even when I do, the best weather dashboard is usually just a window looking out of my house. But sometimes, perhaps when I find some spare time to go out to take some pictures or fly my drone, my inner weather geek awakens.
The big question, of course, is where should I go? There are a lot of interesting locations within a couple of hours drive from my house in New Jersey, and the weather can be very different from one to another. What I really want is a dashboard that shows the weather in a dozen locations on one screen, so I can compare conditions at a glance. Critically, I don’t just want to compare locations near each other.

Just as important, I love working with numbers. I know that landscape photography works best when the amount of cloud cover is somewhere between 20% – 50%. For flying my drone, wind speeds below 10 mph are ideal, 10 – 20 mph is tough, and anything above 20 mph can be dangerous. So a cute weather icon like this doesn’t do me much good:
With that in mind, here is how I built a weather dashboard using Redis.
Fortunately, raw weather data is now widely available via a broad selection of weather APIs, many of them free (with some limitations). I chose to use OpenWeatherMap API, because its free plan gives me everything I need: a 48-hour hourly forecast, a 7-day daily forecast, and current conditions.
I wrote a simple Python script to pull the data from the API and put hourly/daily forecasts into the Redis database using the RedisTimeSeries module and current conditions into another set of time series for history.
My weather dashboard follows my two mandatory dashboard rules:
- All the data should be displayed on one screen, no scrolling required.
- A person should be able to understand the situation displayed on the dashboard as quickly as possible.
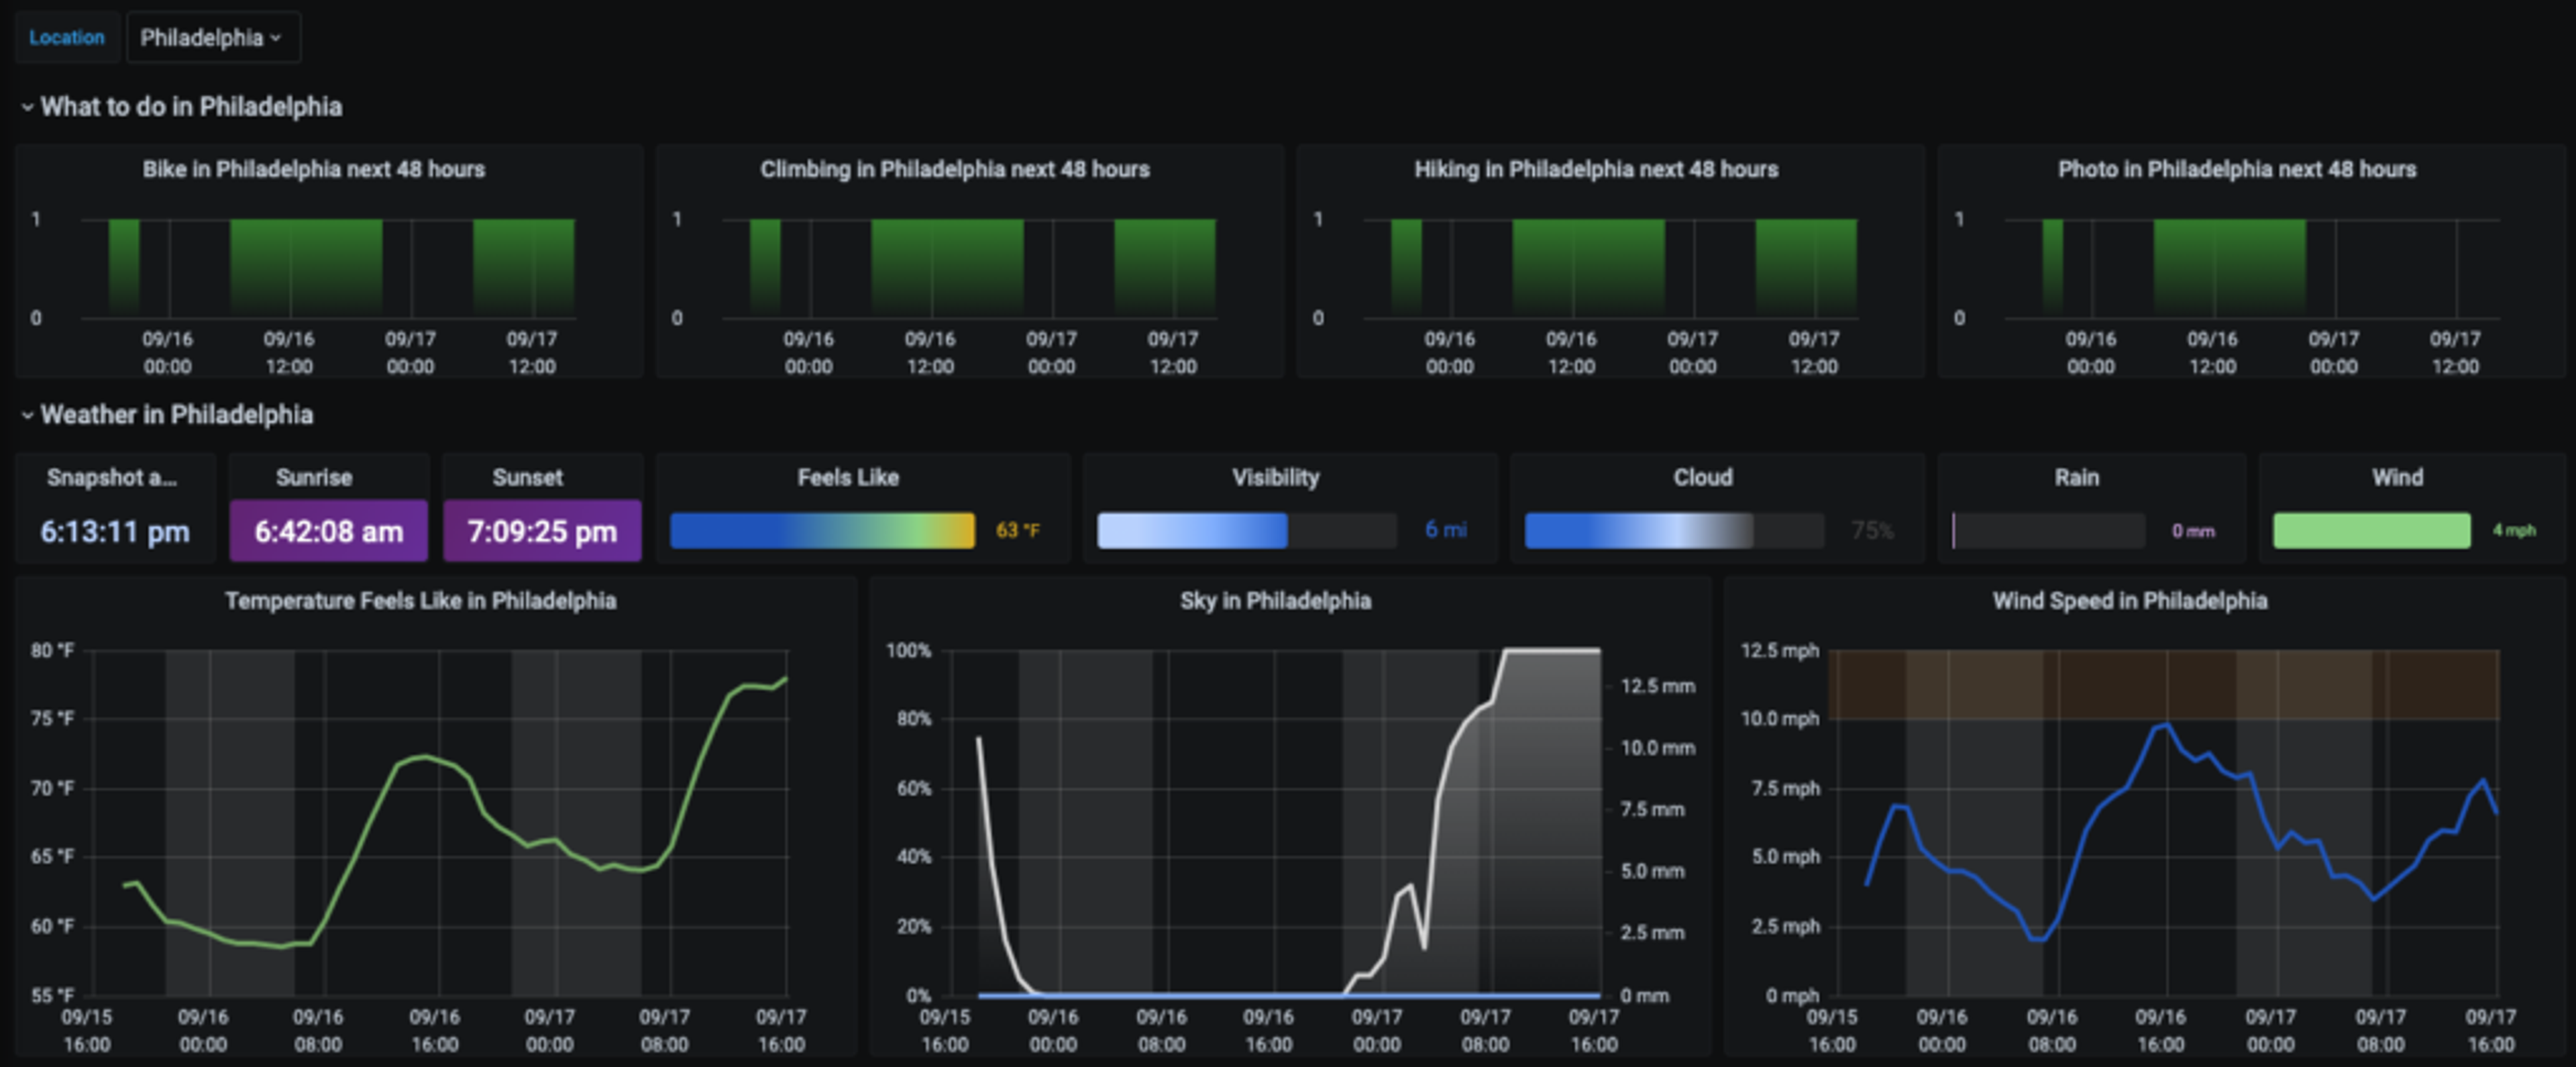
The top section of the dashboard shows the current conditions for one location, which can be the primary or favorite or just selected from the list of available places (there is a Grafana template variable selection list in the top left corner of the dashboard). It also displays the periods of time good for the particular activity at that location. Grafana allows me to highlight low/high zones for temperature, dangerous zones for wind speed, display the degree of cloudiness, and mark periods of daytime and nighttime.
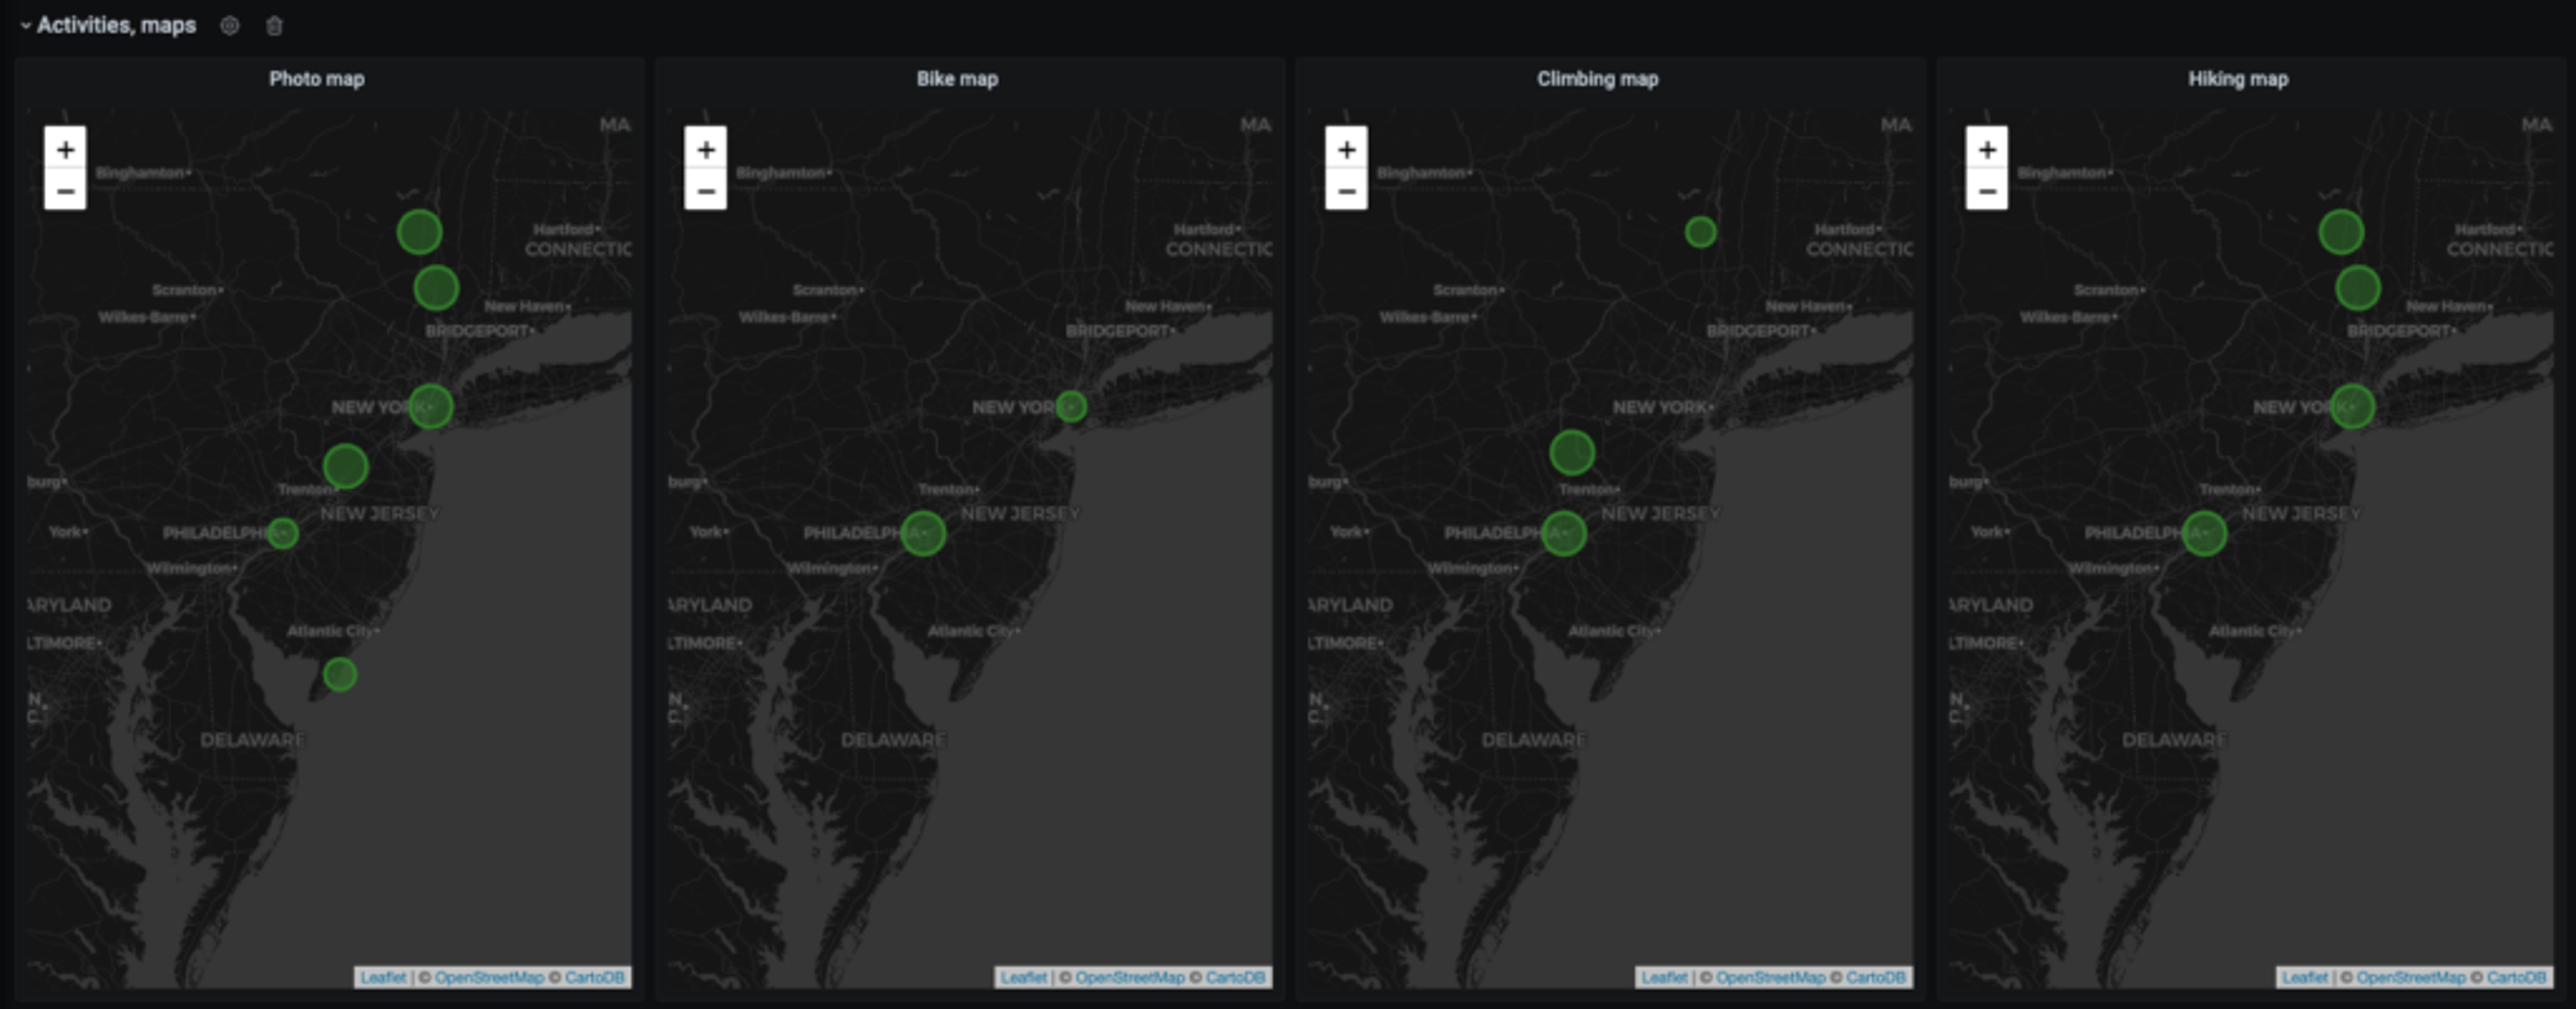
The bottom section group locations by activity, making it easy to compare them. The bigger the circle, the more hours are good for a certain activity in a certain location.
2. Coronavirus cases visualization
I love traveling, but 2020 made millions of people stay home for months on end (I hope not forever!). Now, as many states gradually start to reopen, it’s very important to travel smart and understand the COVID-19 situation in both your origin and destination locations. That means paying attention not only to the current picture but also the longer-term trends.
This is what my Grafana U.S. States Coronavirus Dashboard shows. It is based on the Coronavirus API data, loaded into the RedisTimeSeries module.
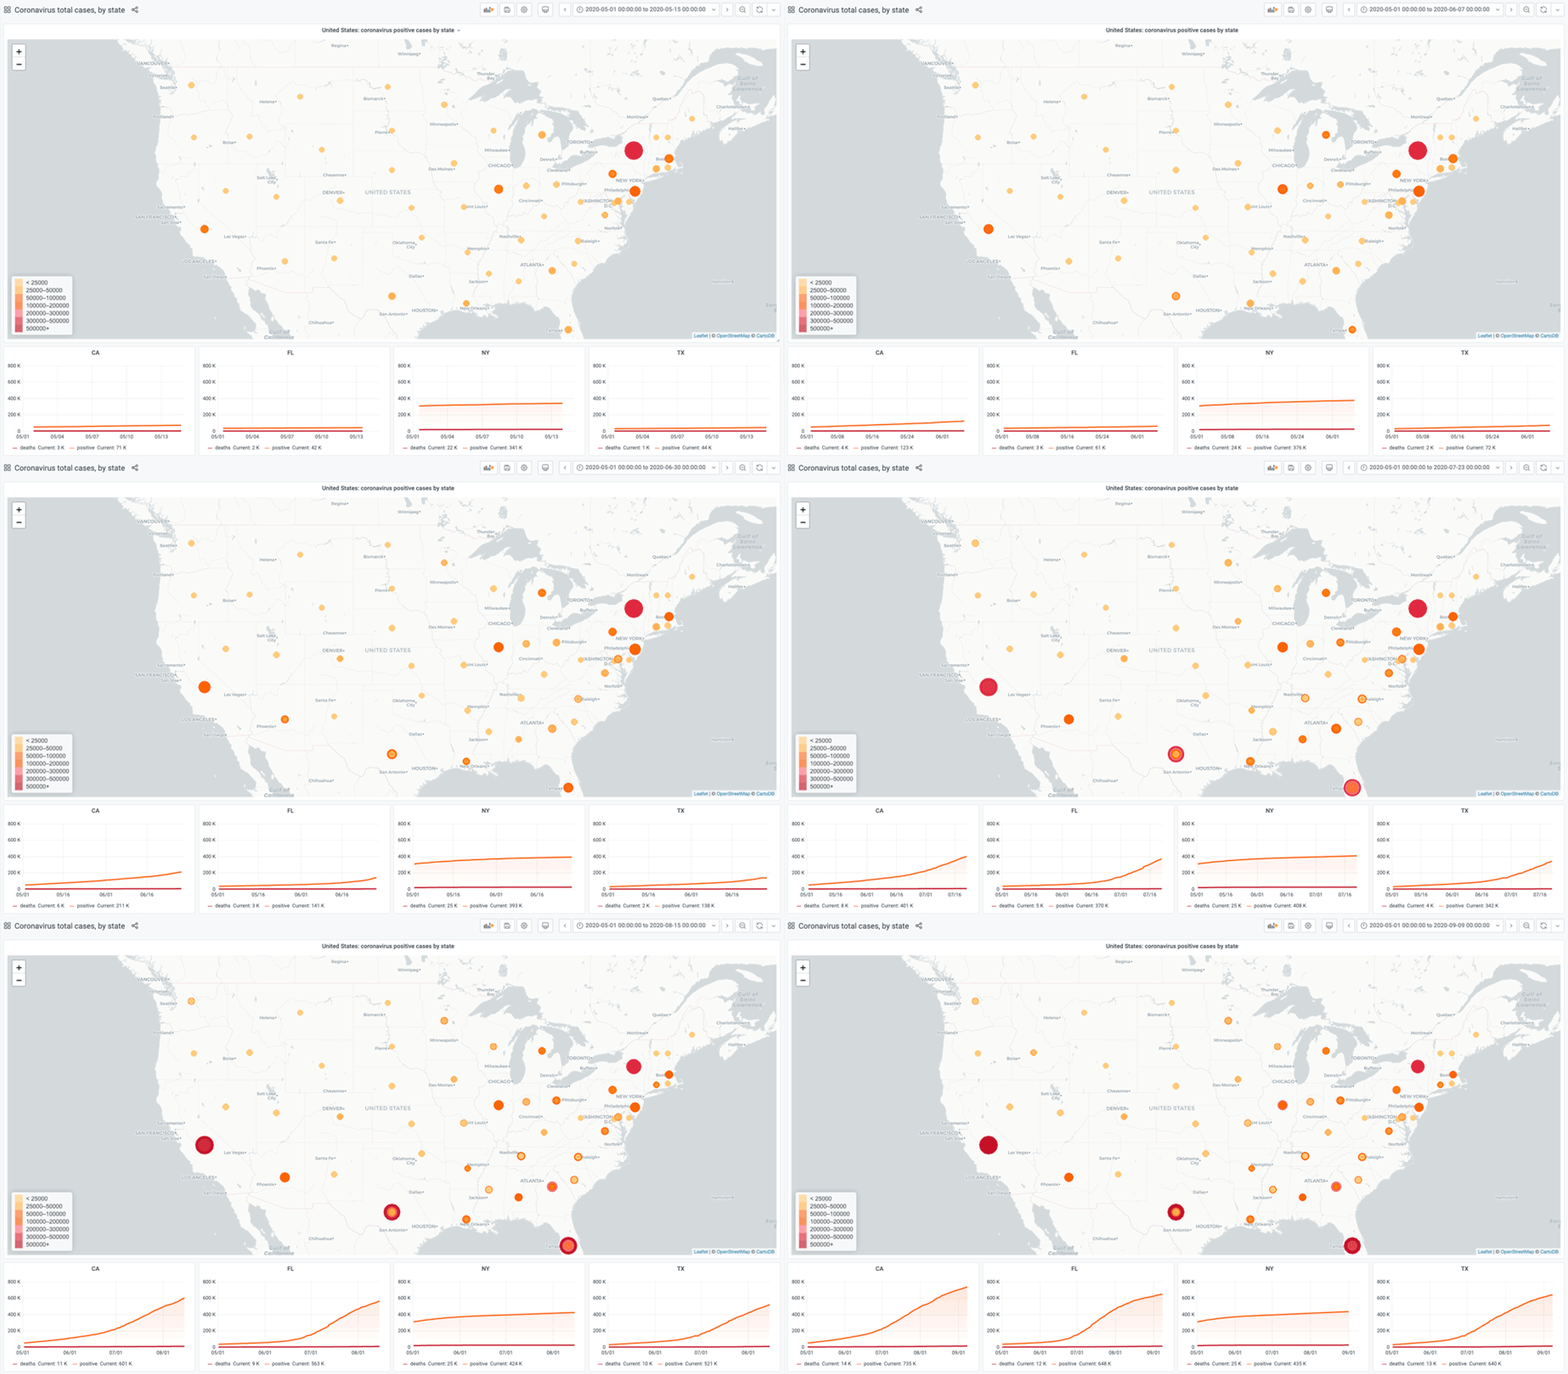
Besides standard graph representation, data is also drawn on the map. The Redis Data Source plug-in is not officially supported by the Grafana Worldmap panel, but you can make it work in two simple steps:
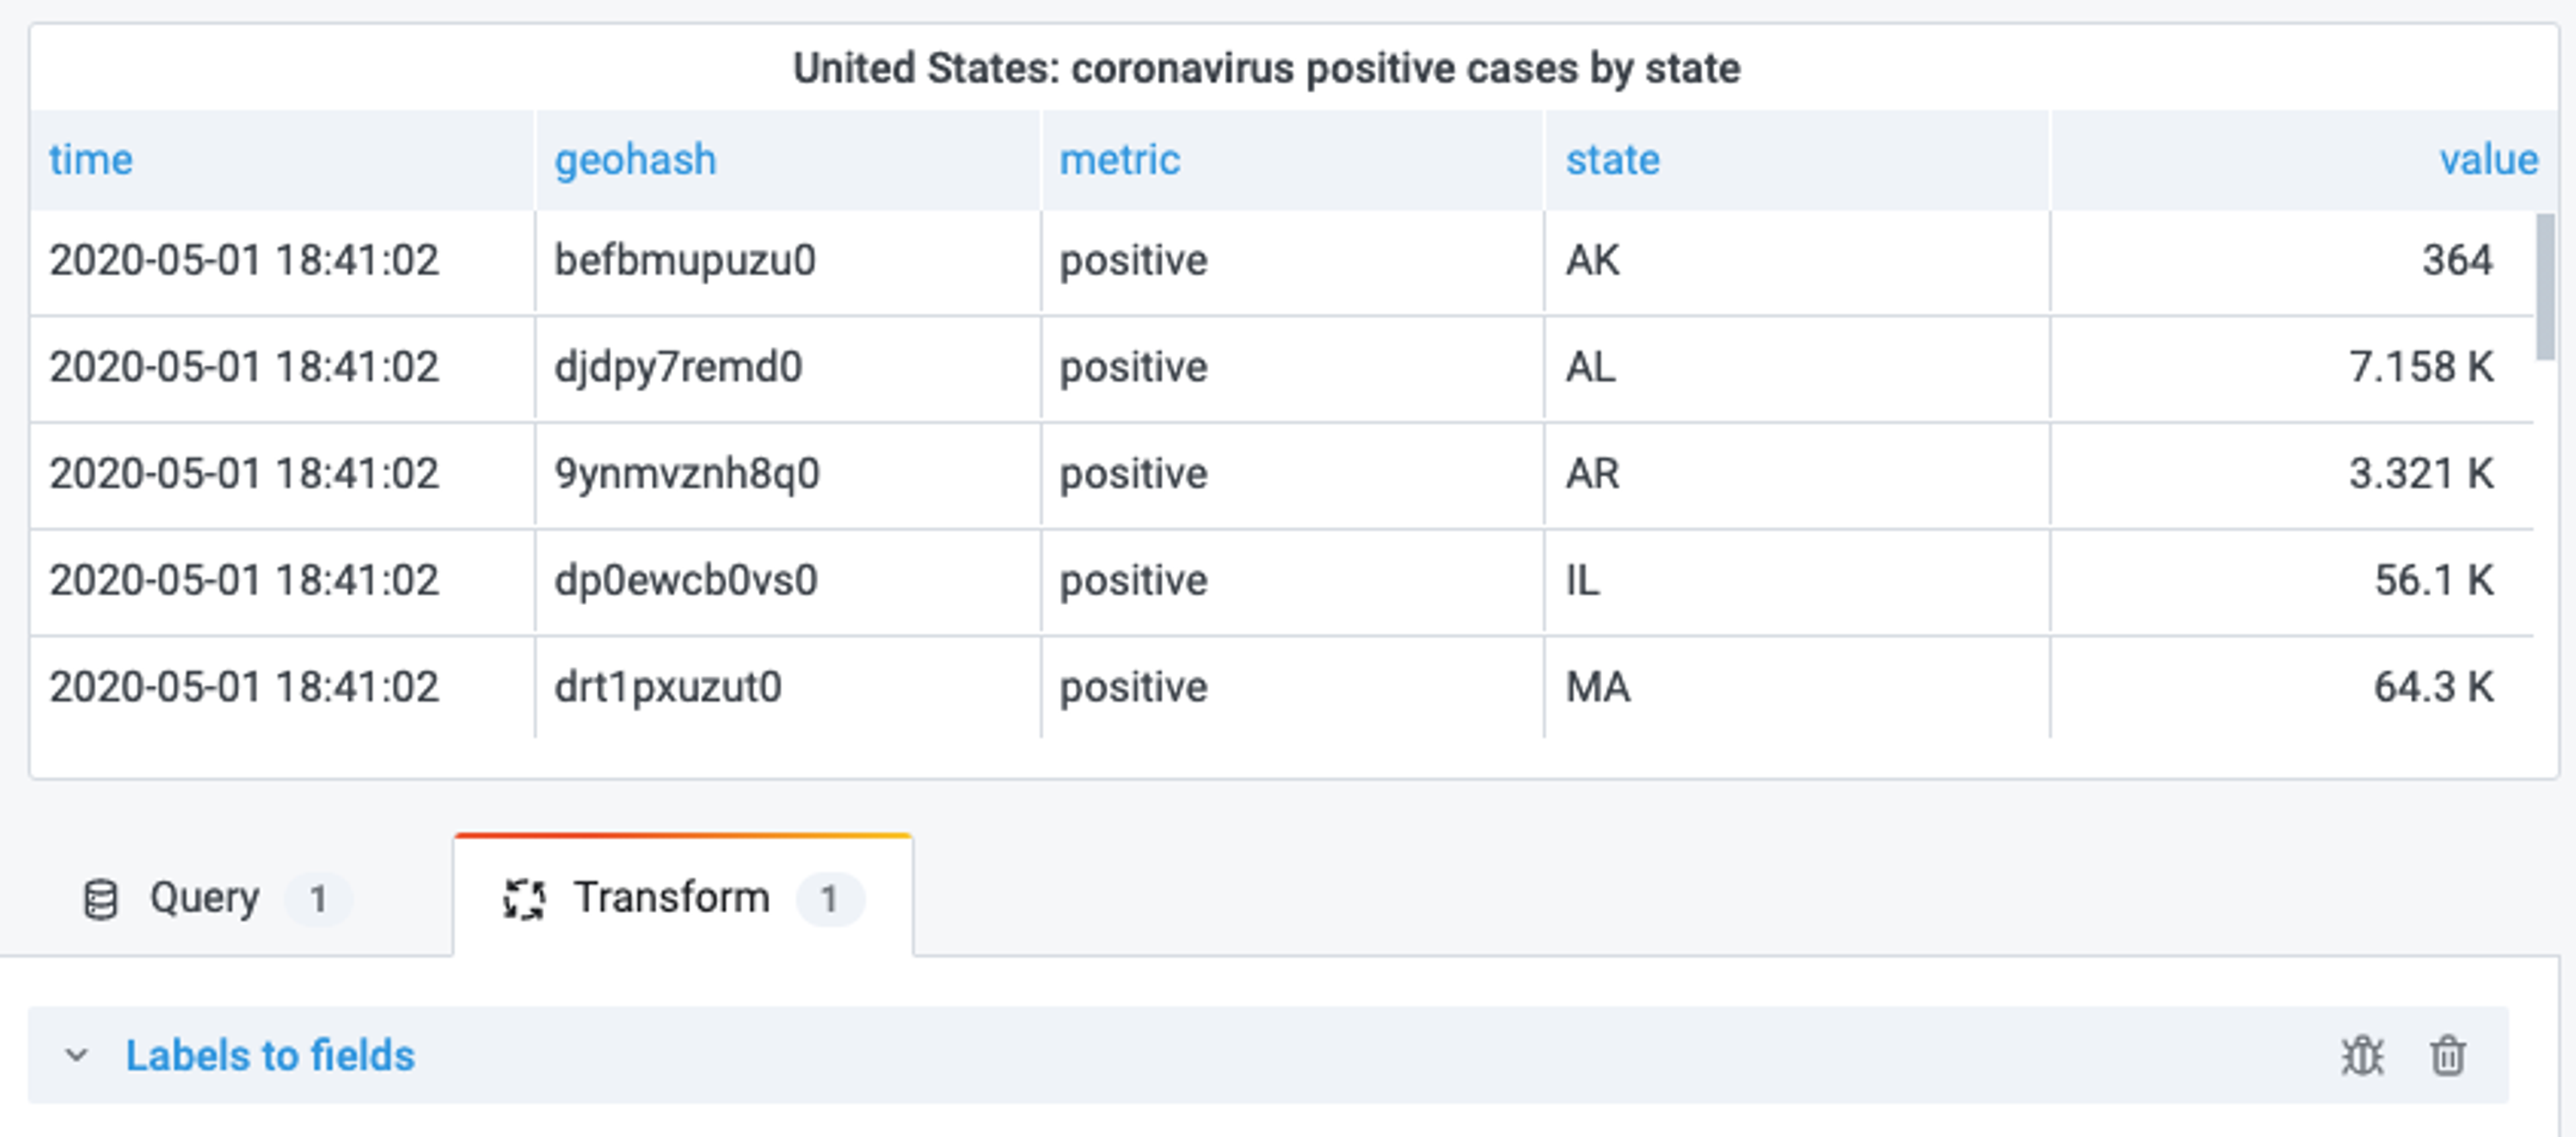
Step 1: Apply the transformation “Labels to fields” to the time-series output result:
Step 2: Change the map parameter “Location Data” to table mode and map the relevant fields:
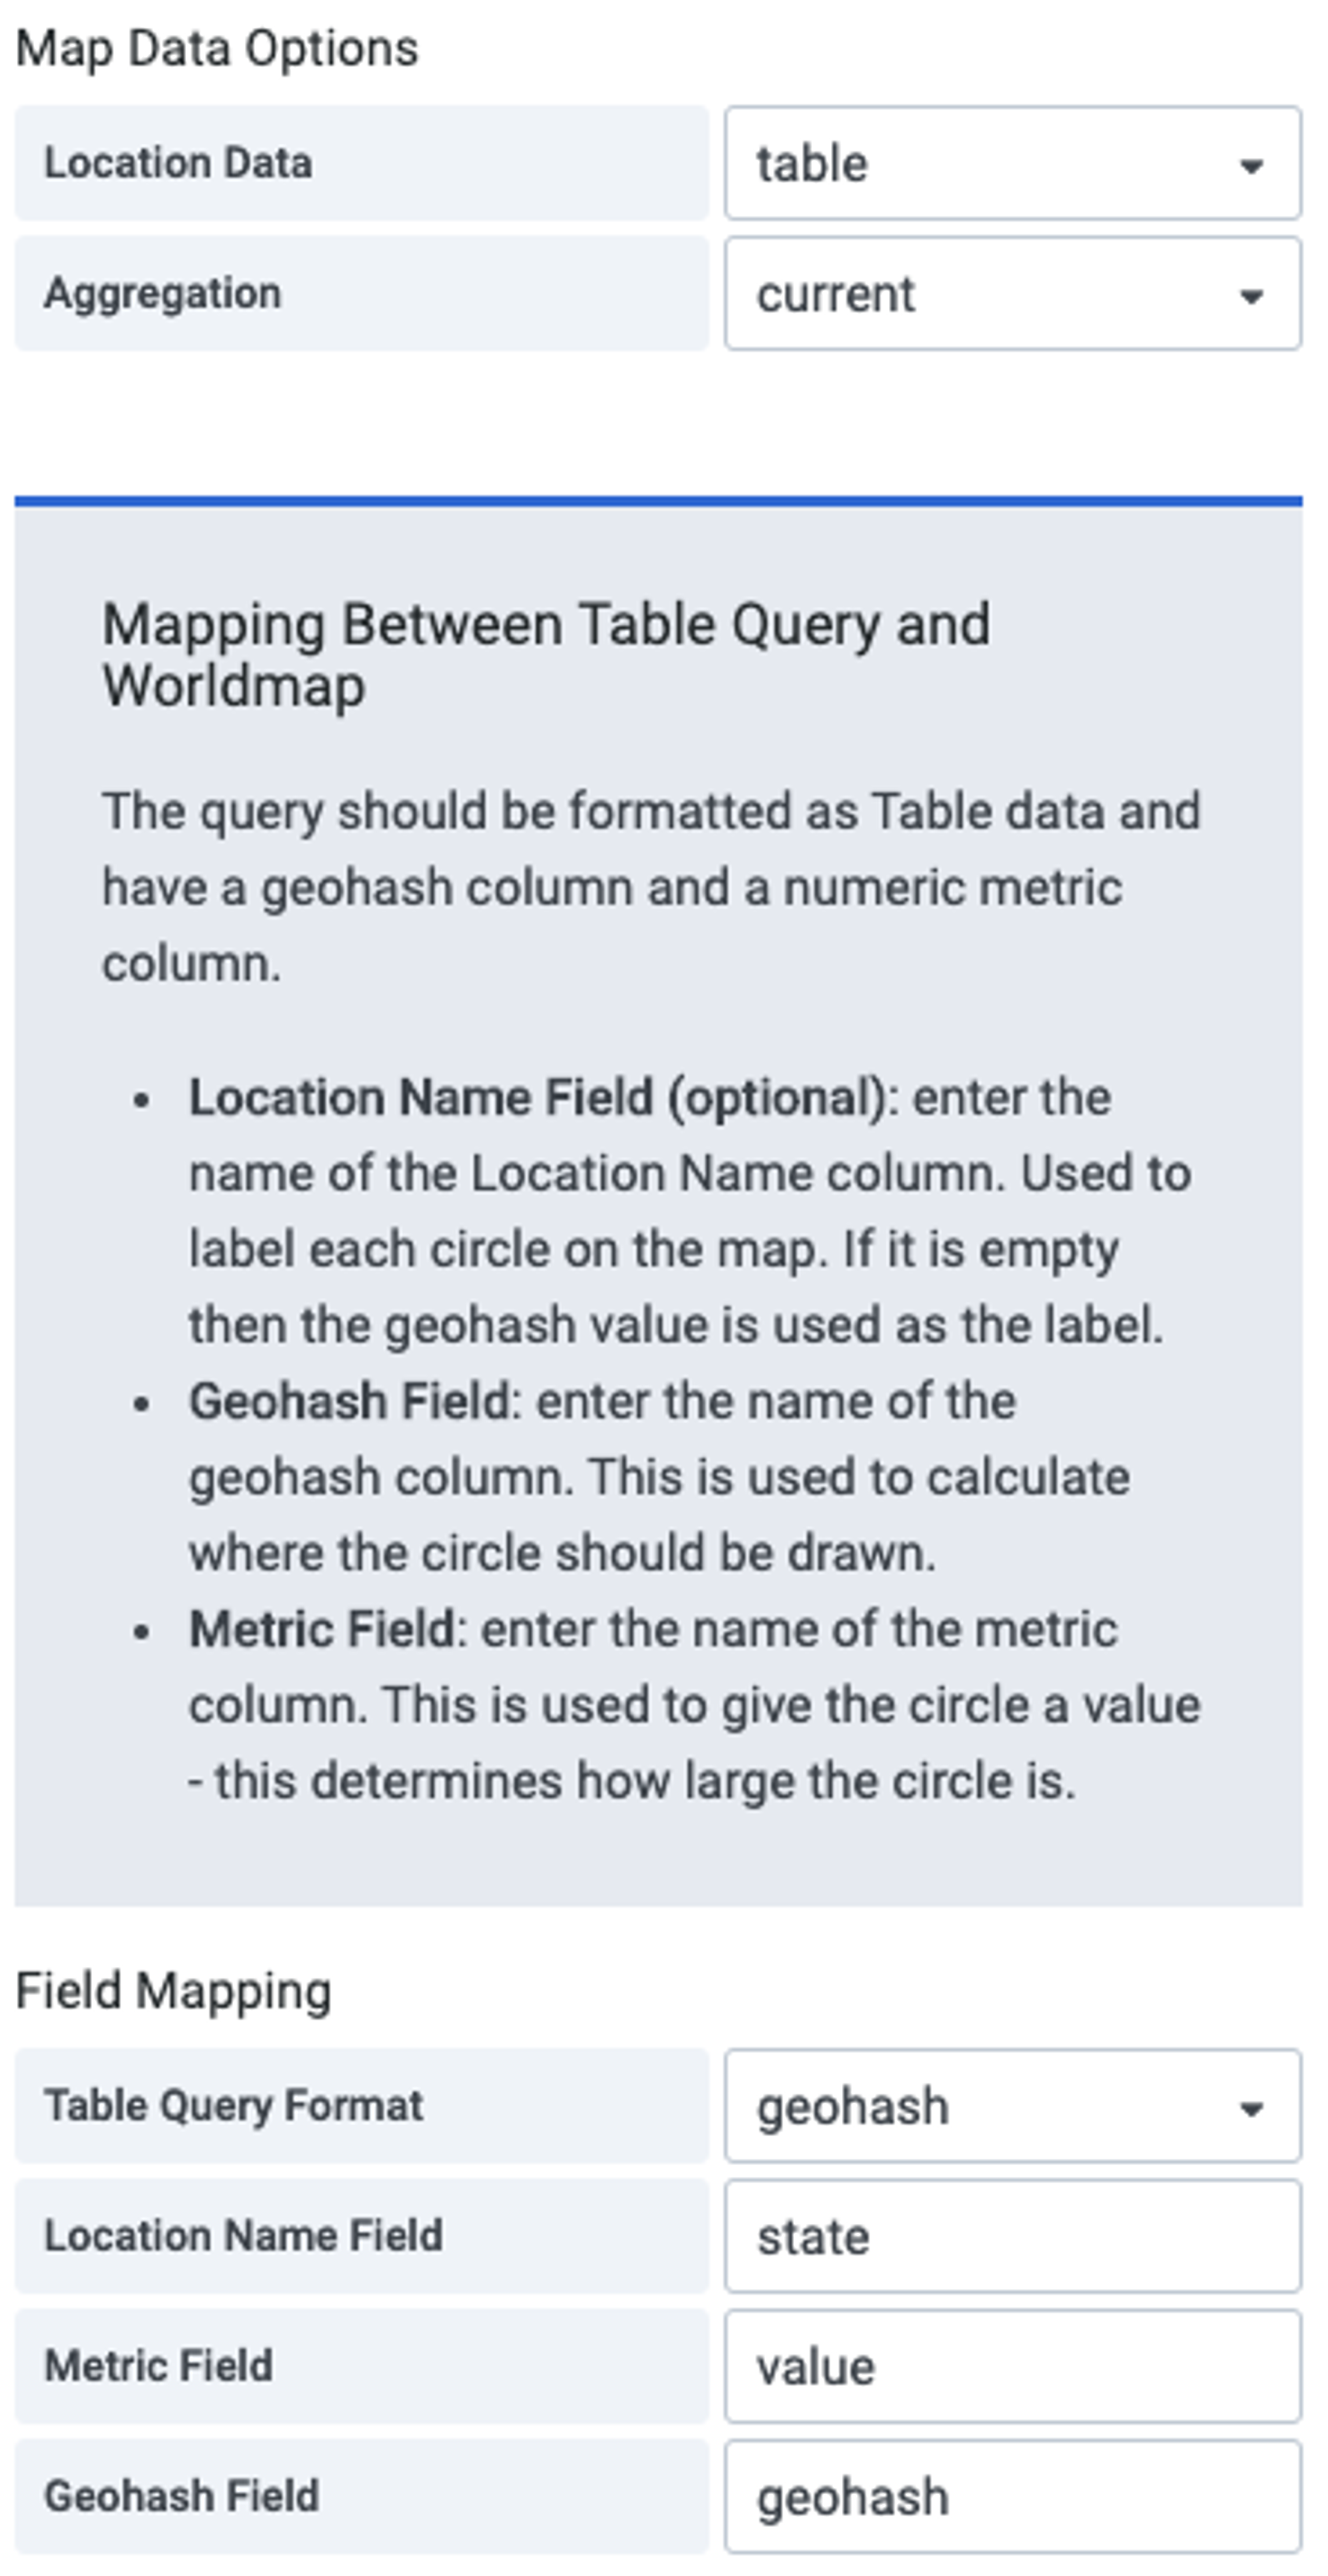
These two steps will allow you to stick the time-series value to the relevant point on the map, which is set by the “geohash” label of RedisTimeSeries. The label “state” is used to display the name of the location on the map.
3. Pop-up store demo
I am a big fan of Redis Streams, a new data type introduced in Redis 5.0, and I was looking for a fast and simple solution to monitor queues for data processing. While working on the Redis Data Source, our team started to explore RedisGears—a dynamic framework that lets developers write and execute functions that implement data flows in Redis while abstracting away the data’s distribution and deployment—for another project and we decided to use them together for this data-pipeline demo for a pop-up store.
RedisGears supports several types of readers that operate on different types of input data. To watch streams messages, we used StreamReader in the event mode. In this mode, the reader is executed in response to events generated by new messages added to the stream.
StreamReader accepts multiple arguments that control how it is triggered. In our case, we want the reader to be triggered every 5 seconds or after it receives 10,000 messages. The last option, trimStream, specifies not to trim the stream after execution.
We used RedisTimeSeries to store the number of incoming messages and the queue-size samples. As explained in the introductory blog post on the Redis Data Source Plug-in for Grafana, time series can be easily visualized in Grafana.
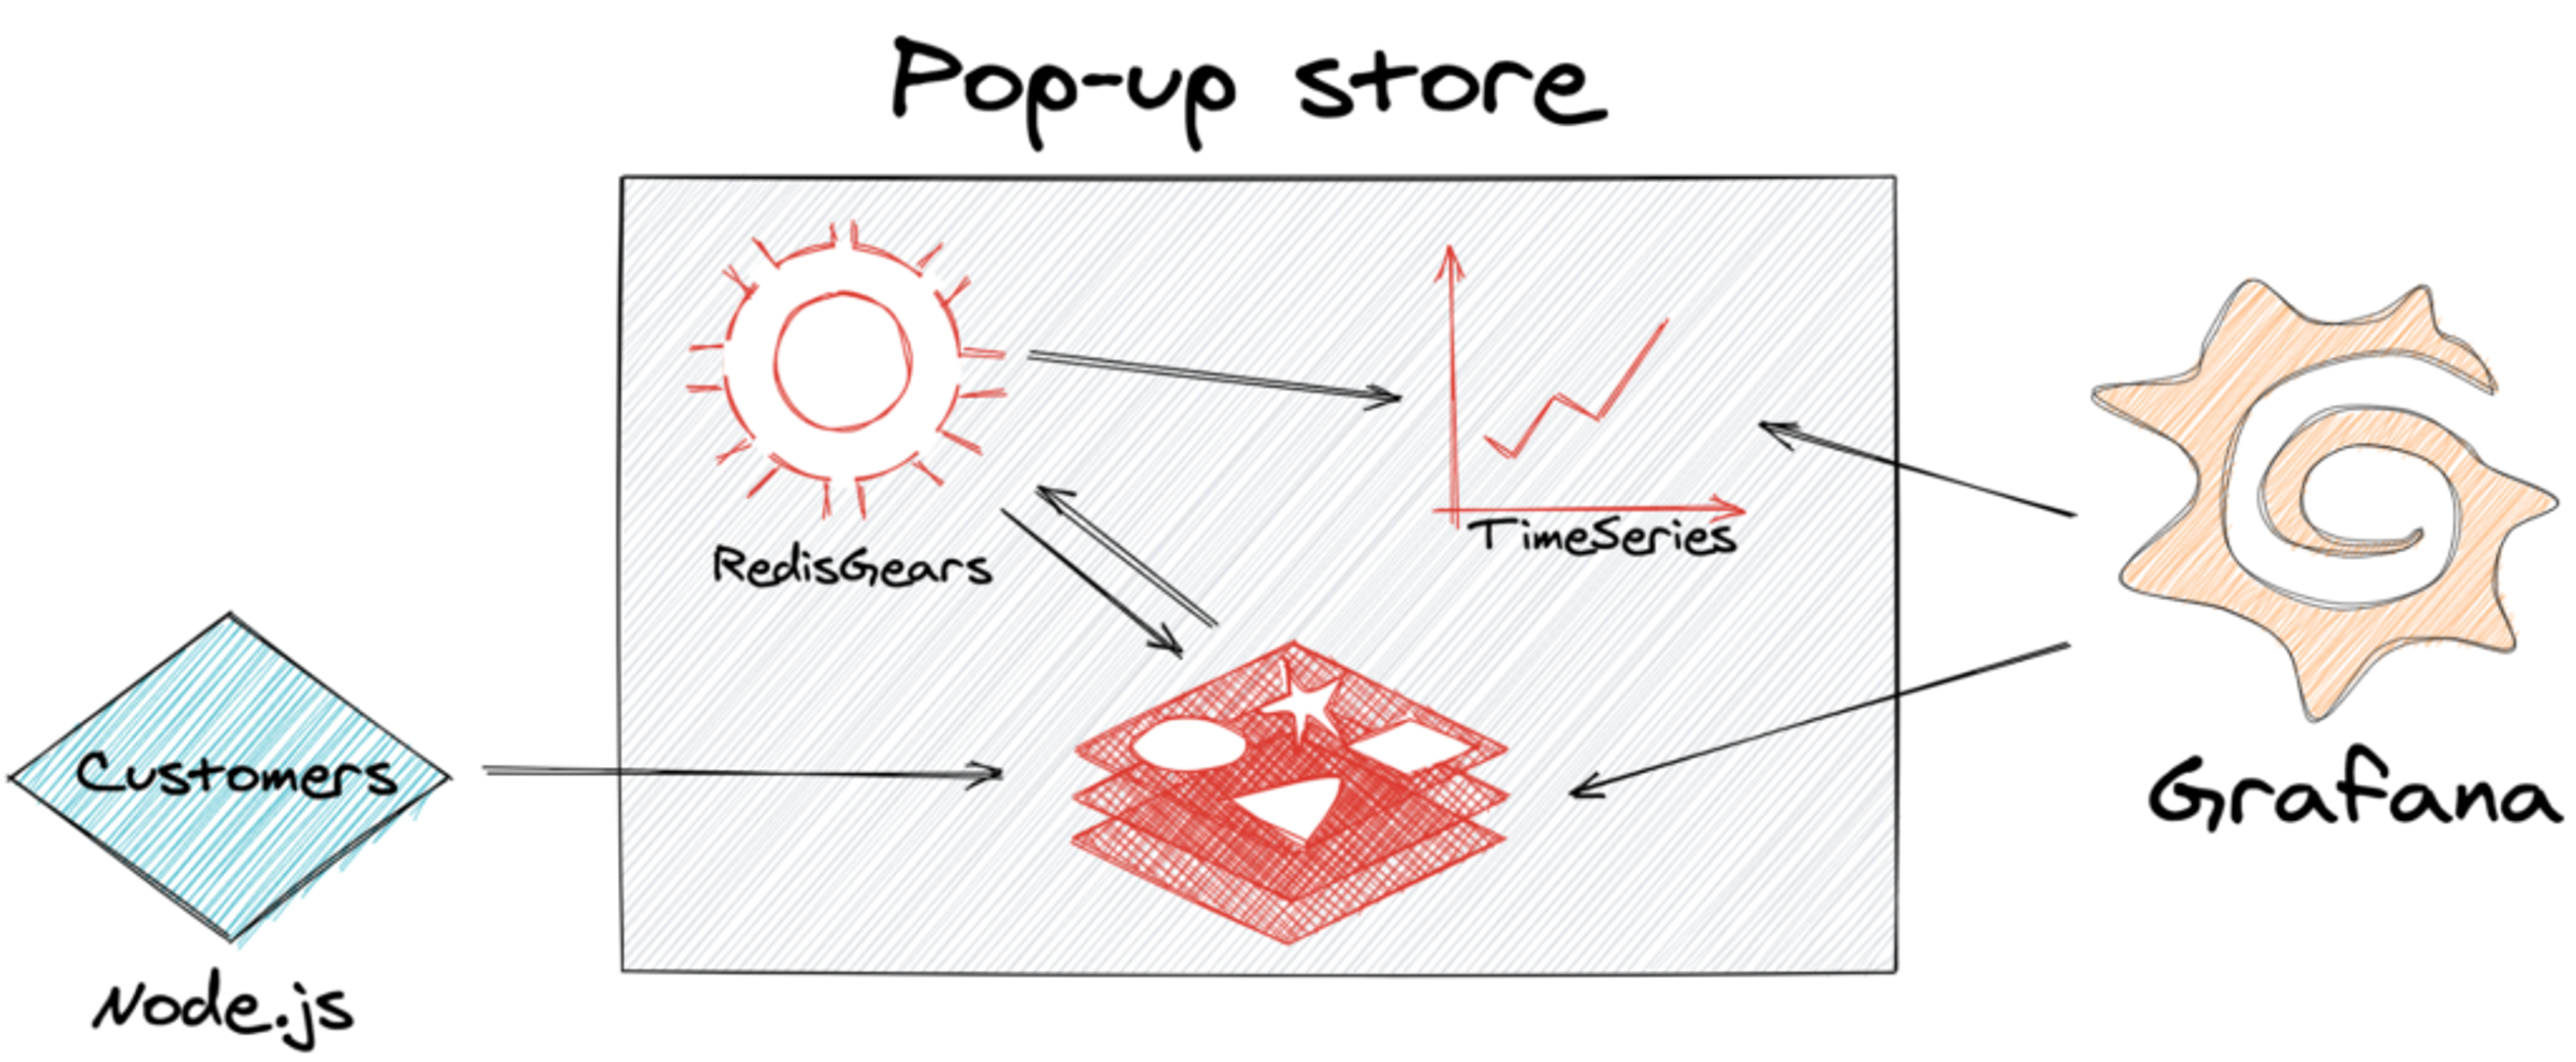
The data-pipeline demo diagram for a pop-up store.
To demonstrate how Redis Streams, RedisTimeSeries, RedisGears, and Redis Data Source can work together, we created the Pop-up store demo with a dynamic dashboard:
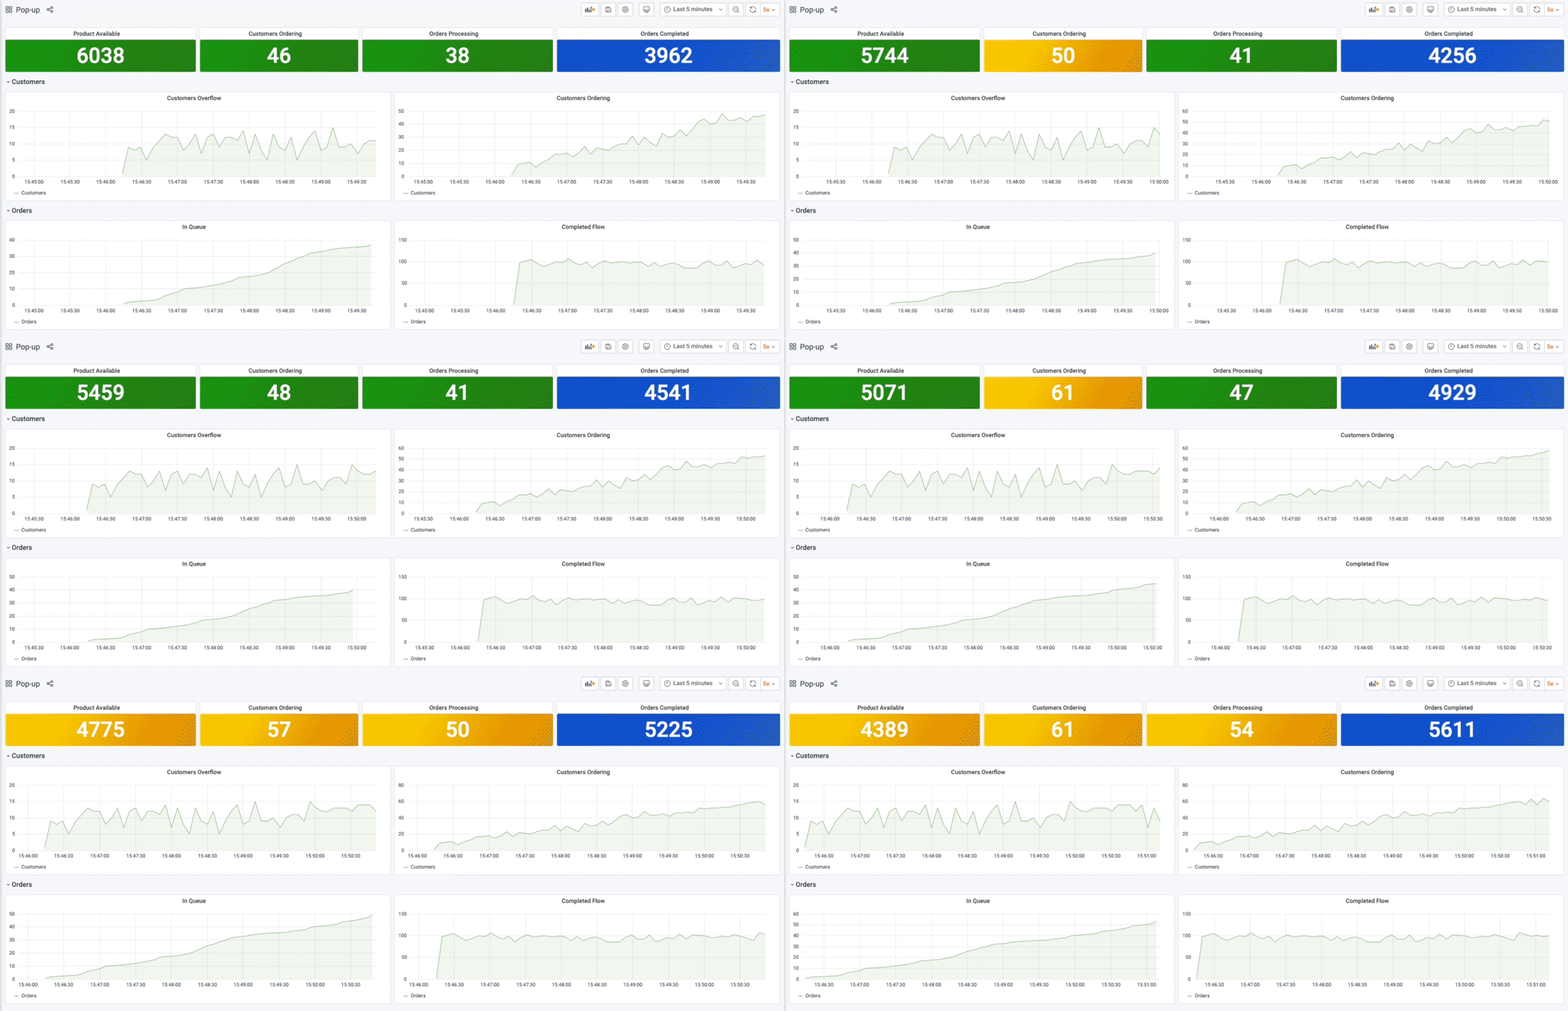
This Grafana dashboard displays:
- Product Available: the value of product key, which decreases as orders complete
- Customers Ordering, Orders Processing, and Orders Completed: the length of queue:customers, queue:orders, and queue:complete streams
- Customers Overflow: the difference between customer-submitted orders and orders completed
- Customers Ordering: orders created in 5 seconds
- Orders In Queue: orders waiting to be processed
- Completed Flow: orders completed in 5 seconds
Please take a look at the GitHub repository for this project to see how we generated the load, the RedisGears scripts we used, and how to configure Redis Data Source to query RedisTimeSeries data using the TS.RANGE command.
Conclusion
These three real-life scenarios demonstrate ways to use Redis Data Source for Grafana with various Redis modules. We hope they inspire you to use this technology and build your own applications.
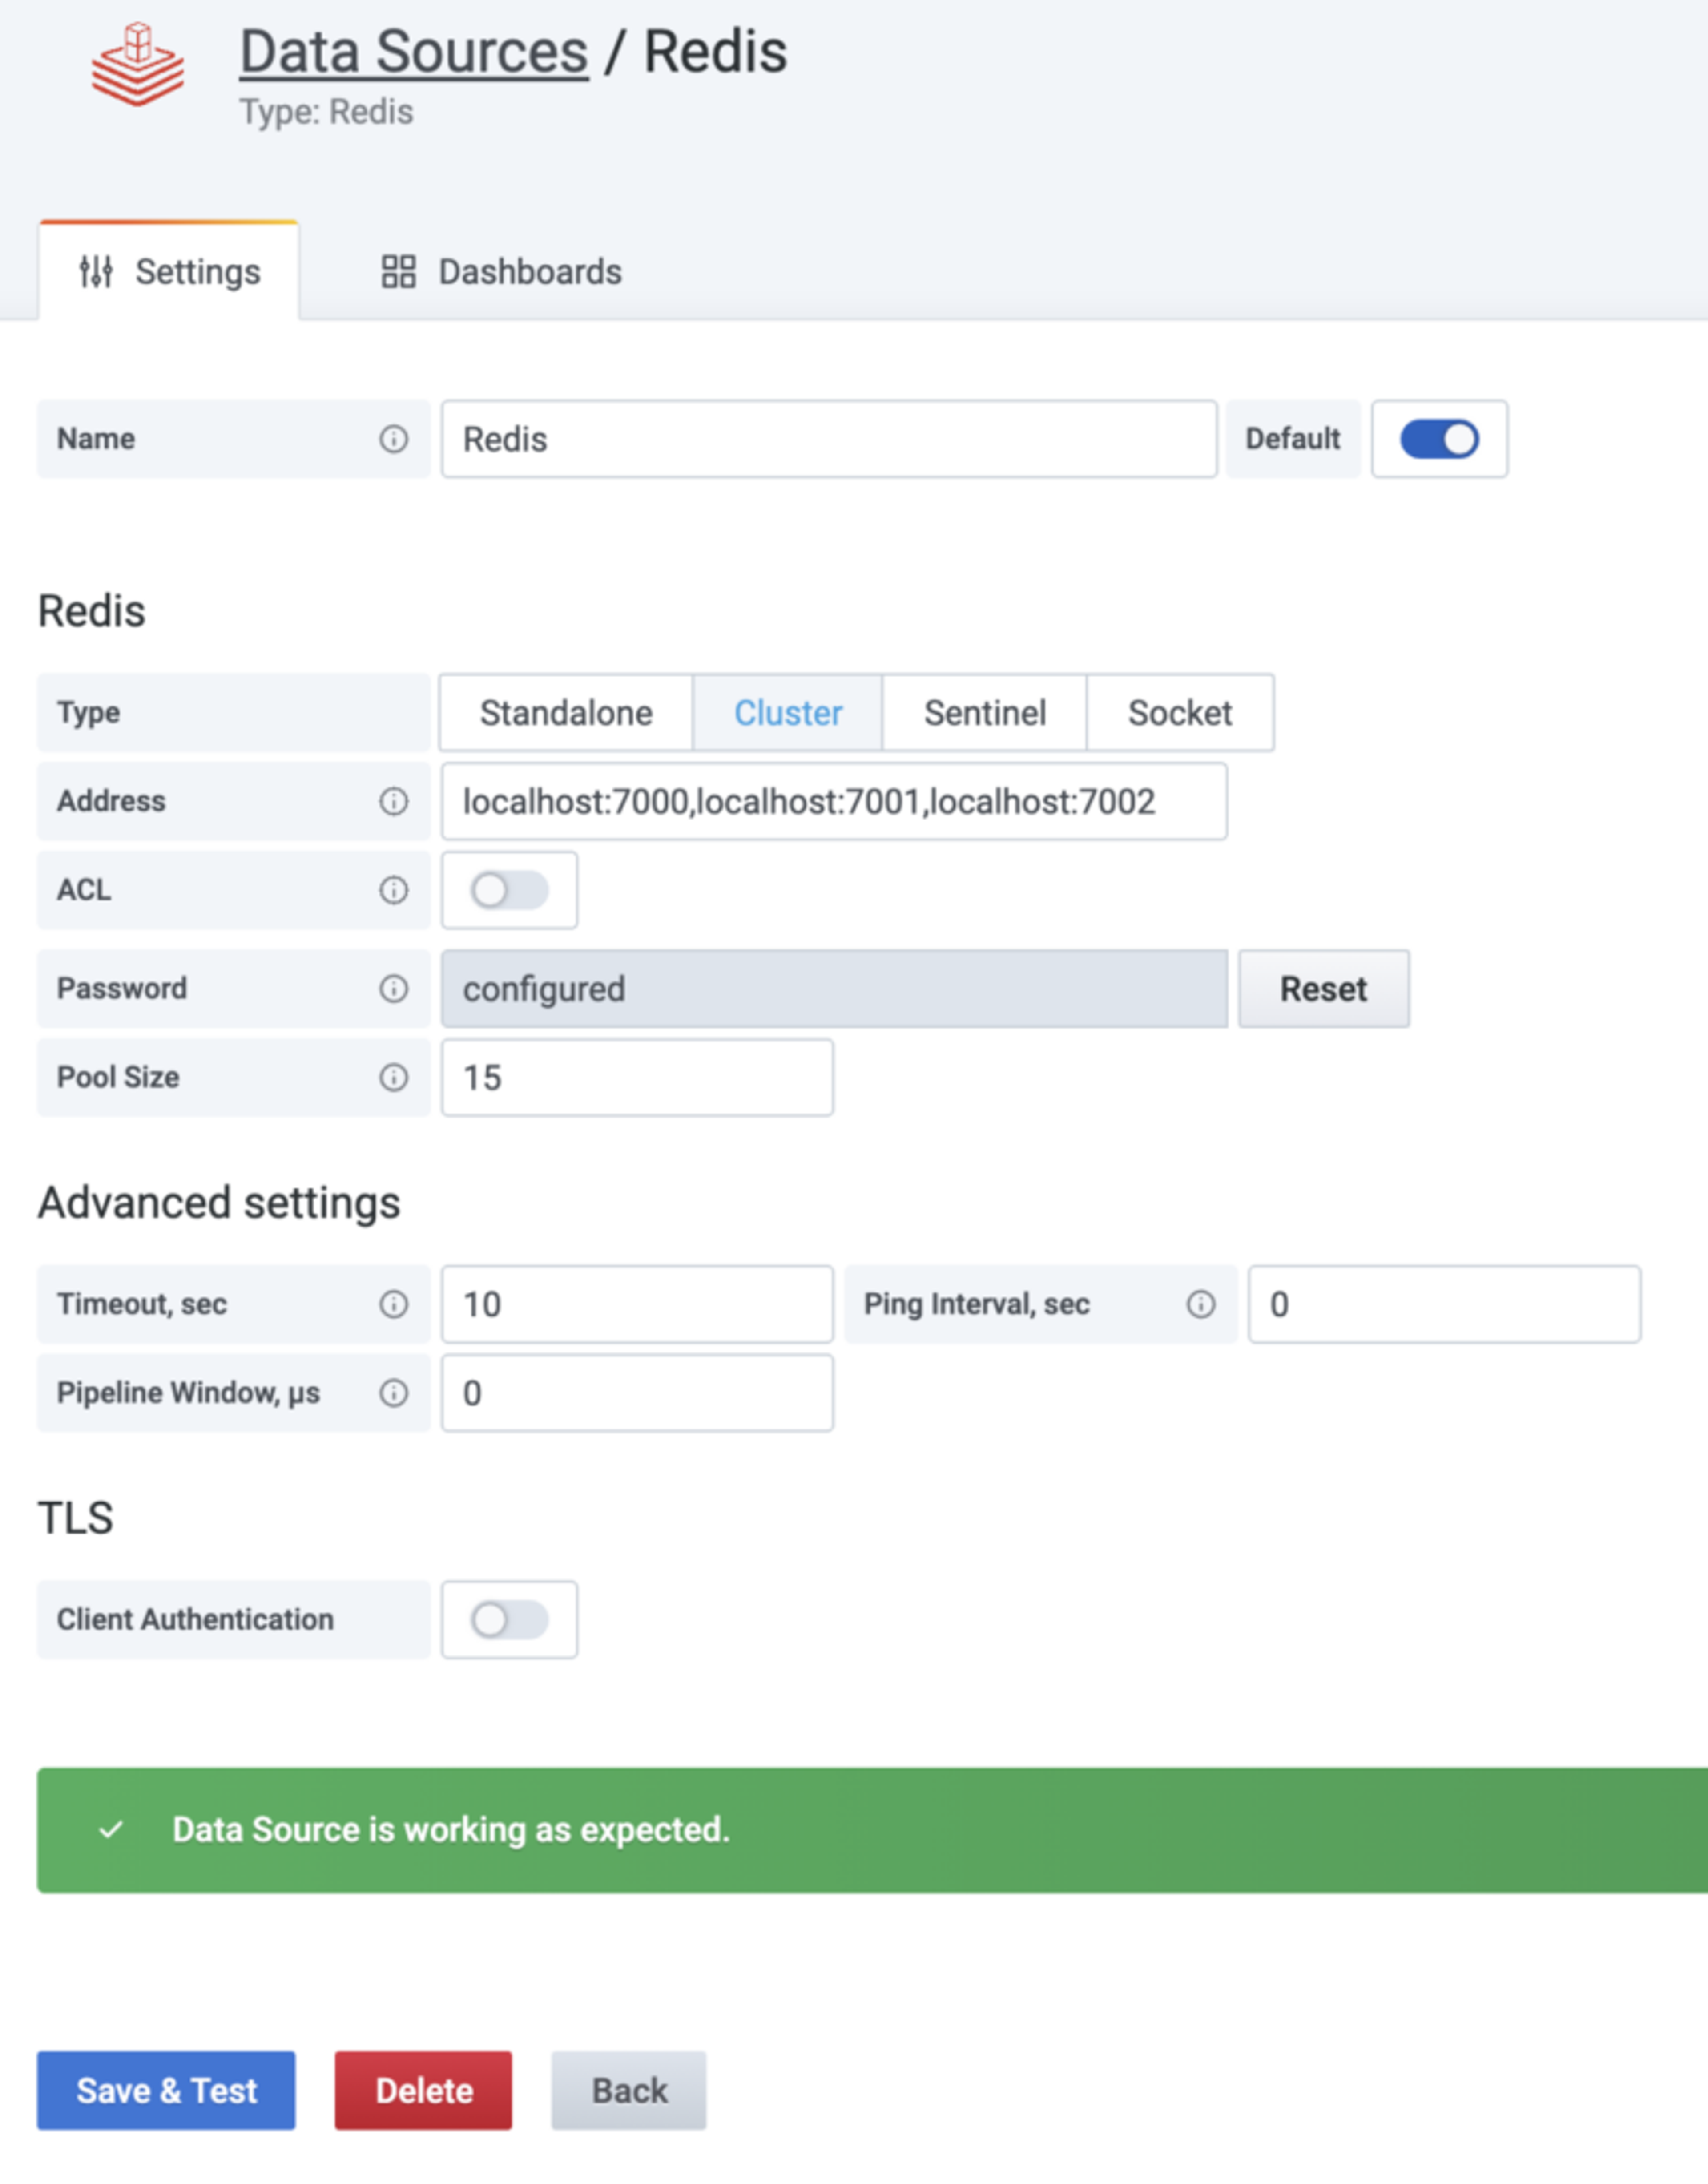
You’ll be in good company. Since the Redis Data Source plug-in was published in the Grafana repository it has already been downloaded more than 10,000 times, included in popular community plug-ins that can improve your Grafana dashboard, added support for Redis cluster, Sentinel, Unix socket, and access control lists (ACLs):
But that’s not all. Stay tuned to the Redis Tech blog to learn about an exciting project combining Grafana streaming capabilities with interactivity to take Grafana beyond observability with a redis-cli panel.
Get started with Redis today
Speak to a Redis expert and learn more about enterprise-grade Redis today.

