Blog
Processing Time-Series Data with Redis and Apache Kafka
RedisTimeSeries is a Redis module that brings native time-series data structure to Redis. Time-series solutions, which were earlier built on top of Sorted Sets (or Redis Streams), can benefit from RedisTimeSeries features such as high-volume inserts, low-latency reads, flexible query language, down-sampling, and much more!
Generally speaking, time-series data is (relatively) simple. Having said that, we need to factor in other characteristics as well:
- Data velocity: e.g. Think hundreds of metrics from thousands of devices per second
- Volume (Big data): Think data accumulation over months (even years)
Thus, databases such as RedisTimeSeries are just a part of the overall solution. You also need to think about how to collect (ingest), process, and send all your data to RedisTimeSeries. What you really need is a scalable data pipeline that can act as a buffer to decouple producers and consumers.
That’s where Apache Kafka comes in! In addition to the core broker, it has a rich ecosystem of components, including Kafka Connect (which is a part of the solution architecture presented in this blog post), client libraries in multiple languages, Kafka Streams, Mirror Maker, etc.
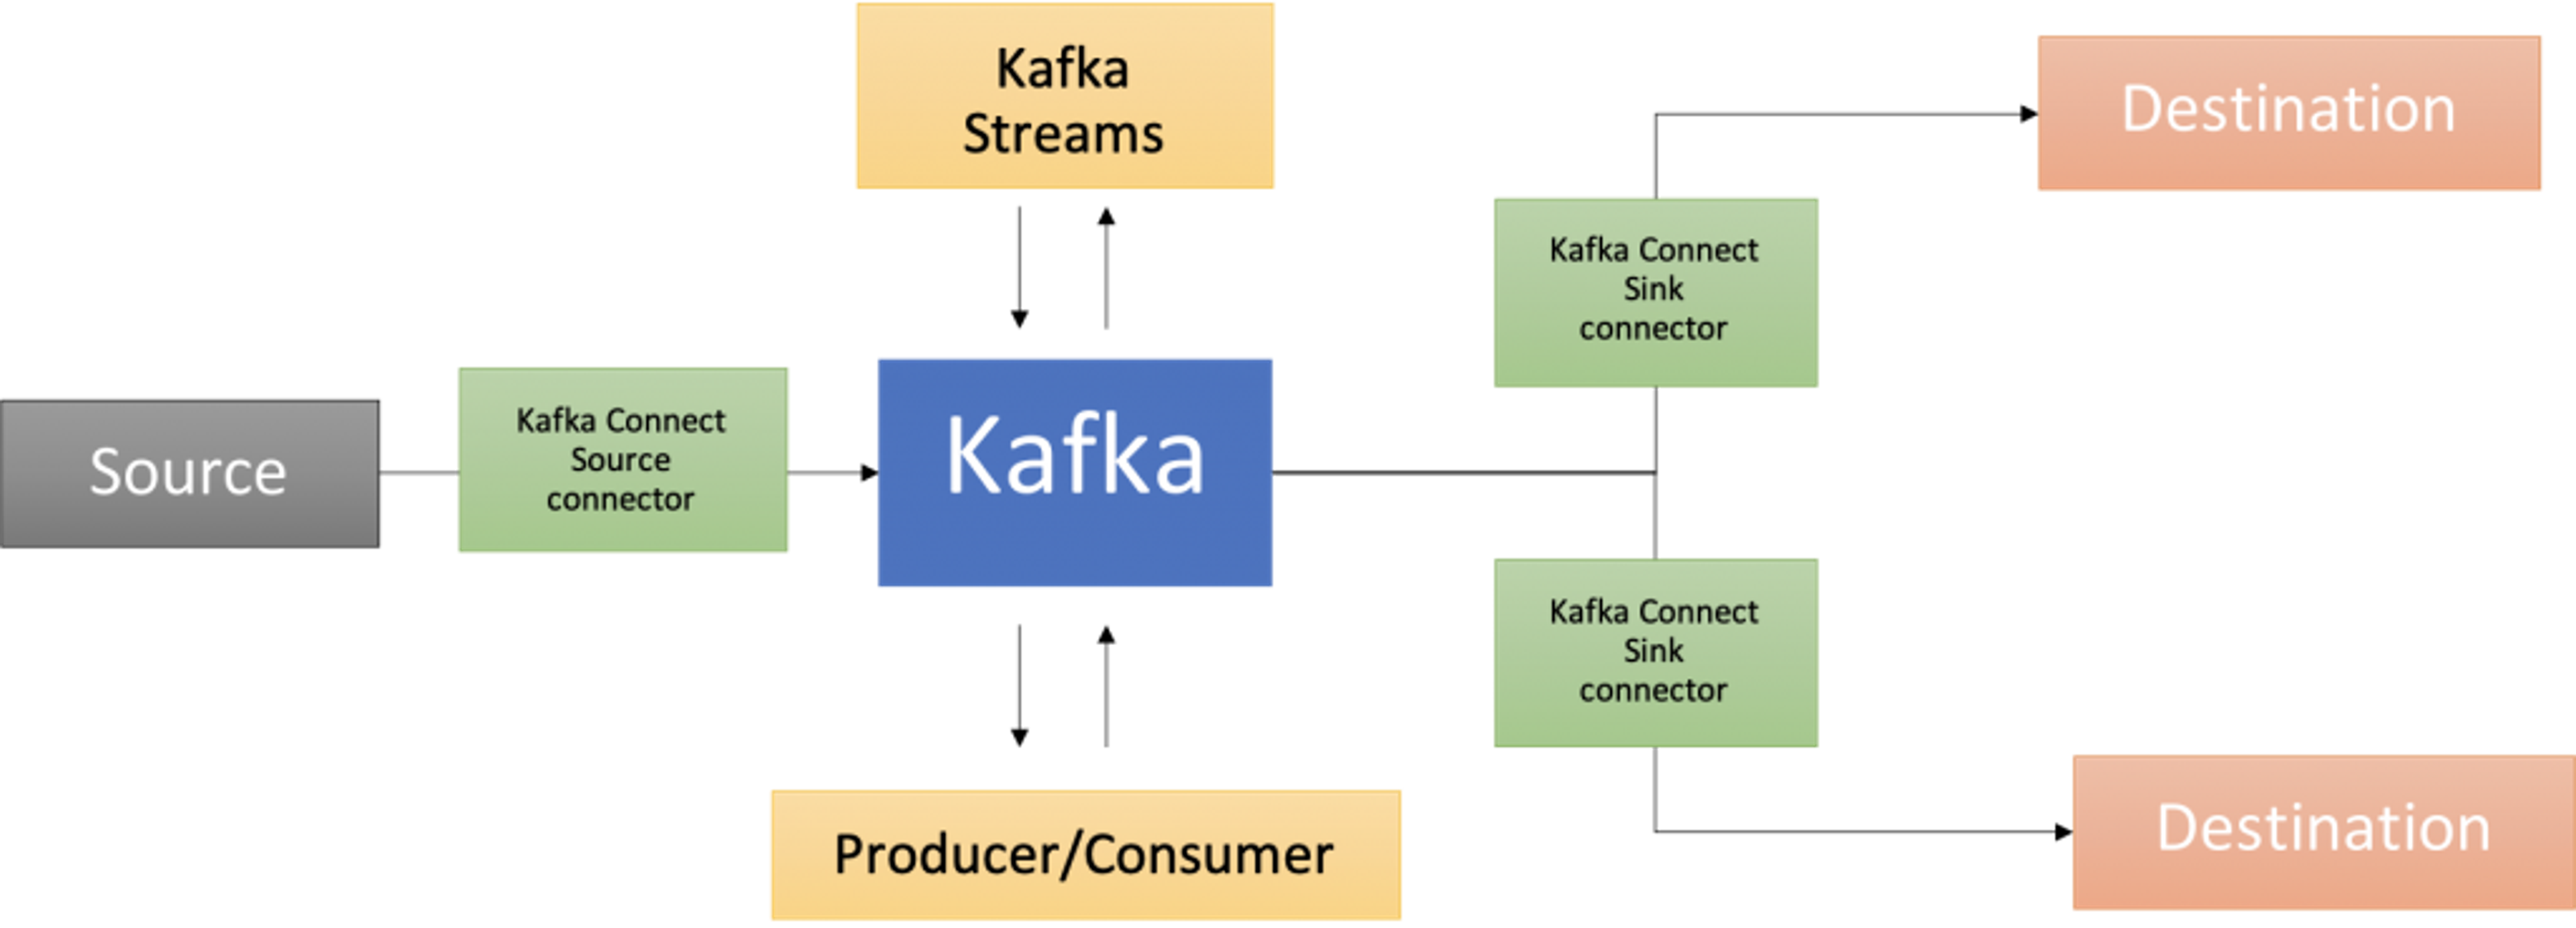
This blog post provides a practical example of how to use RedisTimeSeries with Apache Kafka for analyzing time-series data.
The code is available in this GitHub repo https://github.com/abhirockzz/redis-timeseries-kafka
Let’s start off by exploring the use case first. Please note that it has been kept simple for the purposes of the blog post and then further explained in the subsequent sections.
Scenario: Device monitoring
Imagine there are many locations, each of them has multiple devices, and you’re tasked with the responsibility to monitor device metrics—for now we will consider temperature and pressure. These metrics will be stored in RedisTimeSeries (of course!) and use the following naming convention for keys—<metric name>:<location>:<device>. For example, temperature for device 1 in location 5 will be represented as temp:5:1. Each time-series data point will also have the following Labels (key-value pairs)—metric, location, device. This is to allow for flexible querying as you will see in the upcoming sections.
Here are a couple of examples to give you an idea of how you would add data points using the TS.ADD command:
# temperature for device 2 in location 3 along with labels:
TS.ADD temp:3:2 * 20 LABELS metric temp location 3 device 2
# pressure for device 2 in location 3:
TS.ADD pressure:3:2 * 60 LABELS metric pressure location 3 device 2
Solution architecture
Here is what the solution looks like at a high level:
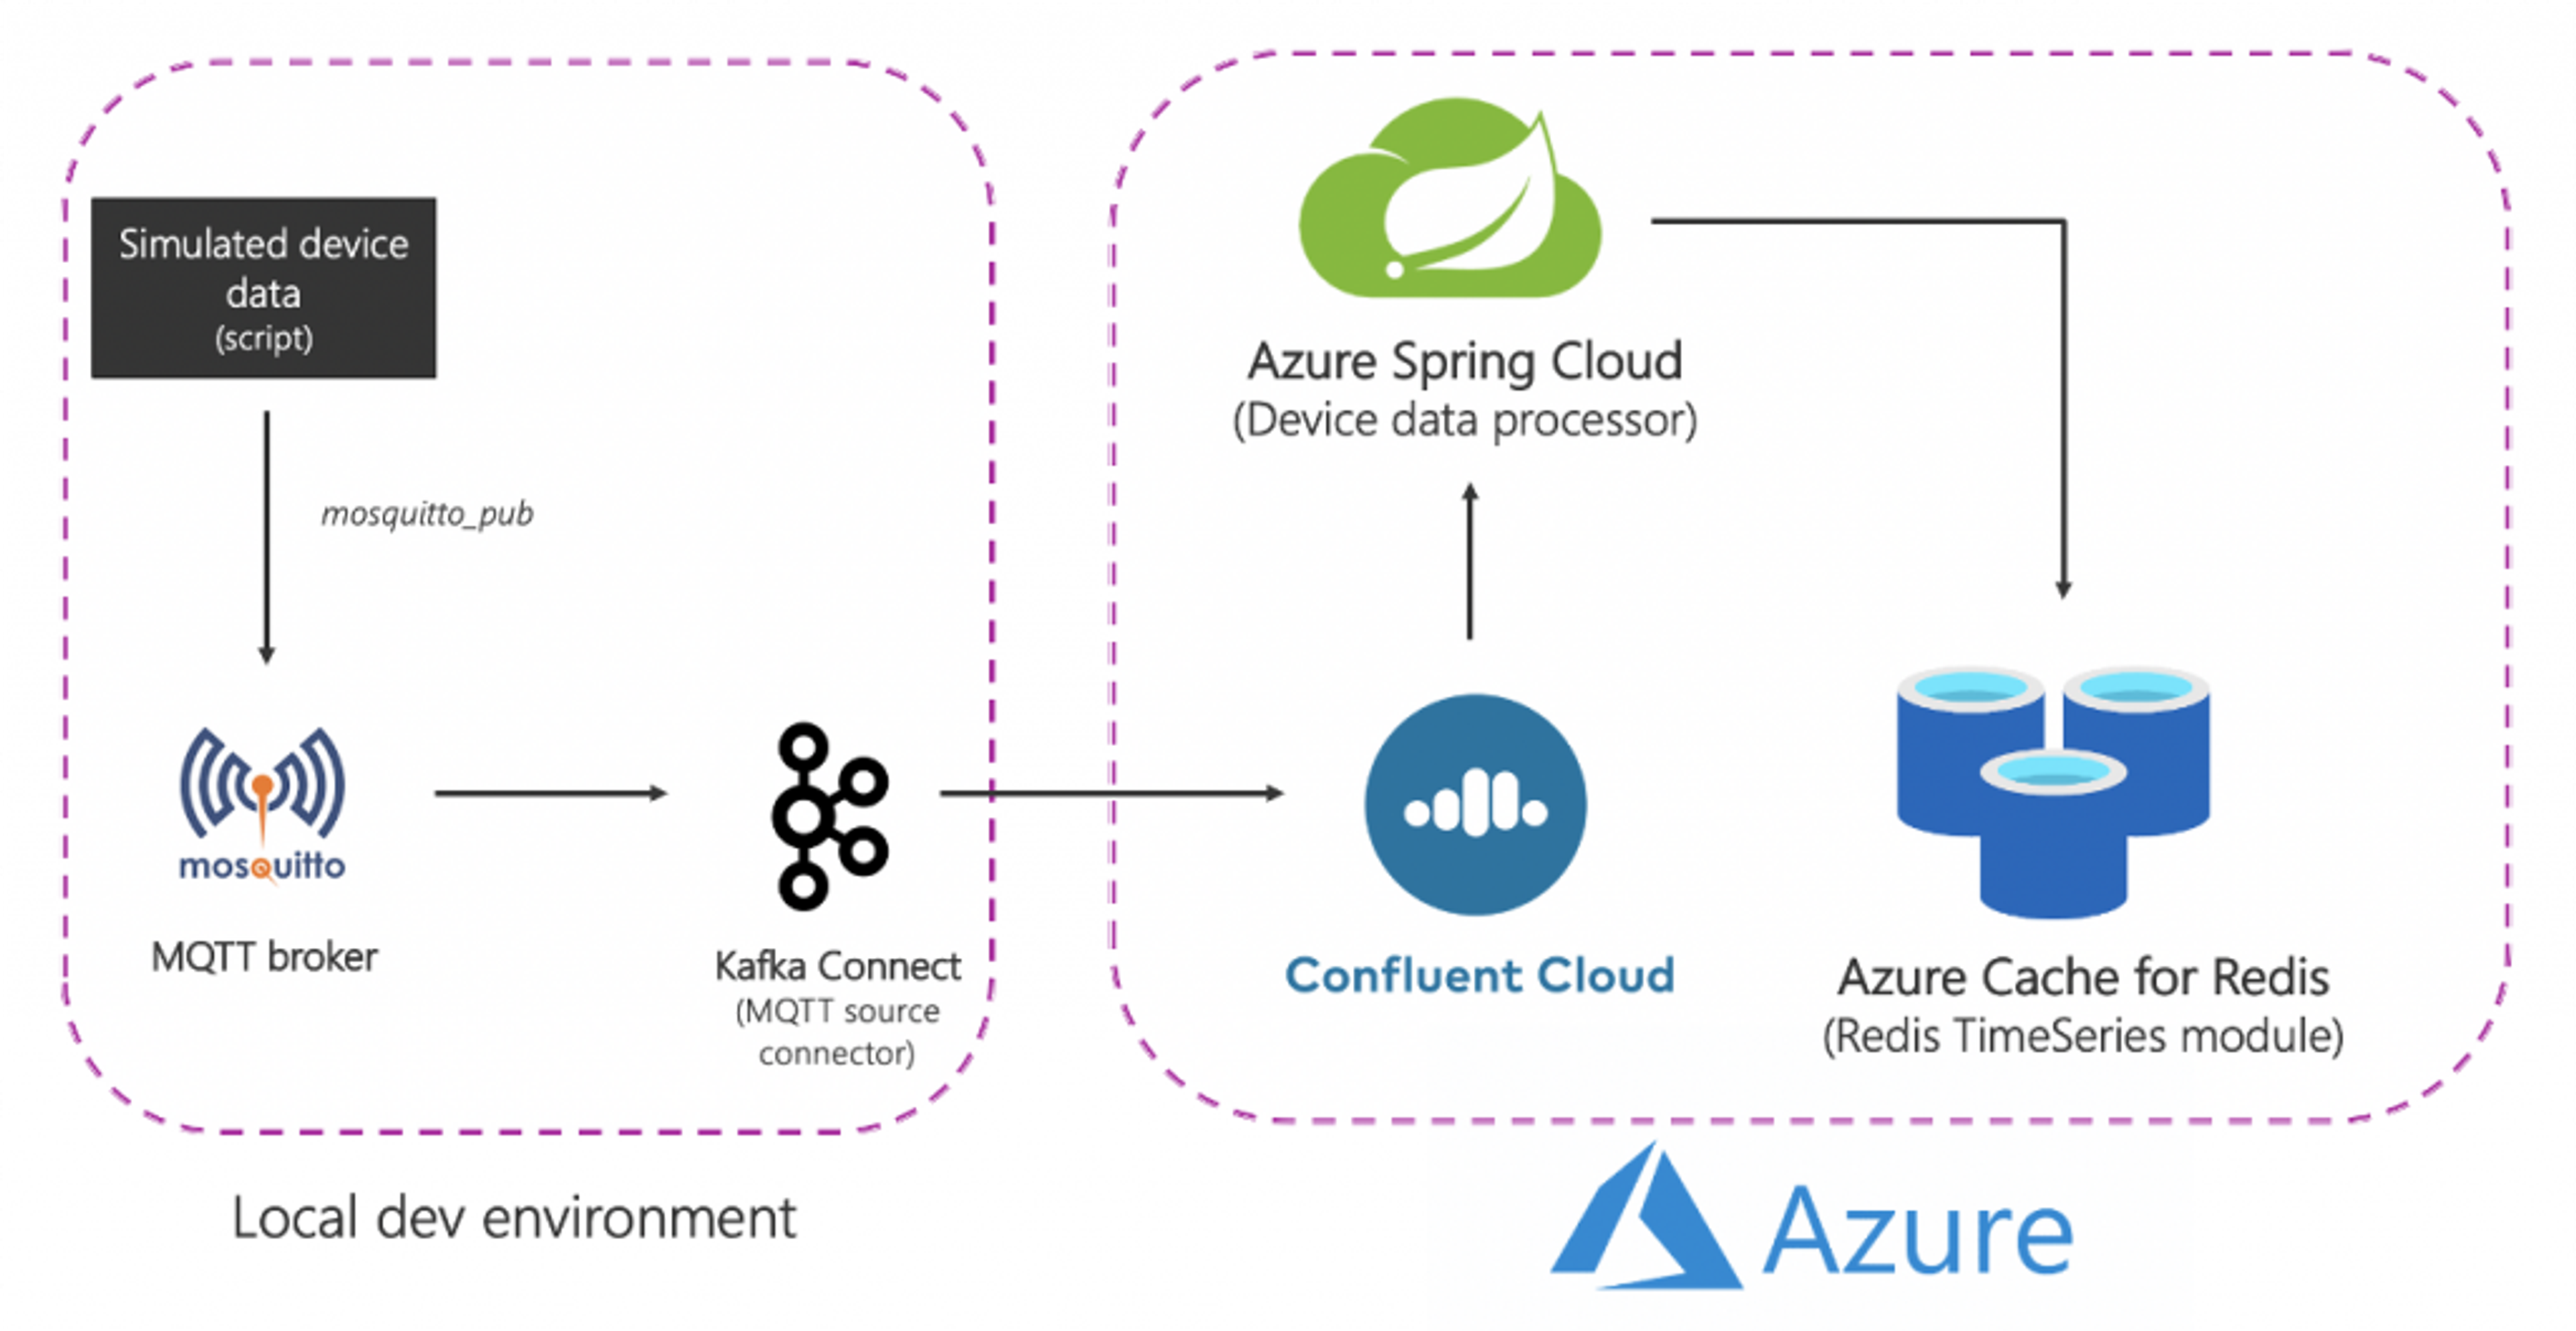
Let’s break it down:
Source (local) components
- MQTT broker (mosquitto): MQTT is a de-facto protocol for IoT use cases. The scenario we will be using is a combination of IoT and Time Series – more on this later.
- Kafka Connect: The MQTT source connector is used to transfer data from MQTT broker to a Kafka cluster.
Azure services
- Azure Cache for Redis Enterprise tiers: The Enterprise tiers are based on Redis Enterprise, a commercial variant of Redis from Redis. In addition to RedisTimeSeries, Enterprise tier also supports RediSearch and RedisBloom. Customers don’t need to worry about the license acquisition for Enterprise tiers. Azure Cache for Redis will facilitate this process wherein, customers can obtain and pay for a license to this software through an Azure Marketplace offer.
- Confluent Cloud on Azure: A fully managed offering that provides Apache Kafka as a service, thanks to an integrated provisioning layer from Azure to Confluent Cloud. It reduces the burden of cross-platform management andprovides a consolidated experience for using Confluent Cloud on Azure infrastructure, thereby allowing you to easily integrate Confluent Cloud with your Azure applications.
- Azure Spring Cloud: Deploying Spring Boot microservices to Azure is easier thanks to Azure Spring Cloud. Azure Spring Cloud alleviates infrastructure concerns, provides configuration management, service discovery, CI/CD integration, blue-green deployments, and more. The service does all the heavy lifting so developers can focus on their code.
Please note that some of the services were hosted locally just to keep things simple. In production grade deployments you would want to run them in Azure as well. For example you could operate the Kafka Connect cluster along with the MQTT connector in Azure Kubernetes Service.
To summarize, here is the end-to-end flow:
- A script produces simulated device data that is sent to the local MQTT broker.
- This data is picked up by the MQTT Kafka Connect source connector and sent to a topic in the Confluent Cloud Kafka cluster running in Azure.
- It is further processed by the Spring Boot application hosted in Azure Spring Cloud, which then persists it to the Azure Cache for Redis instance.
It’s time to start off with the practical stuff! Before that, make sure you have the following.
Prerequisites:
- An Azure account —you can get one for free here
- Install Azure CLI
- JDK 11 for e.g. OpenJDK
- A recent version of Maven and Git
Set up the infrastructure components
Follow the documentation to provision Azure Cache for Redis (Enterprise Tier) which comes with the RedisTimeSeries module.

Provision Confluent Cloud cluster on Azure Marketplace. Also create a Kafka topic (use the name mqtt.device-stats) and create credentials (API key and secret) that you will use later on to connect to your cluster securely.

You can provision an instance of Azure Spring Cloud using the Azure portal or use the Azure CLI:

Before moving on, make sure to clone the GitHub repo:
Setup local services
The components include:
- Mosquitto MQTT broker
- Kafka Connect with the MQTT source connector
- Grafana for tracking time-series data in dashboards
MQTT broker
I installed and started the mosquitto broker locally on Mac.
You can follow steps corresponding to your OS or feel free to use this Docker image.
Grafana
I installed and started Grafana locally on Mac.
You can do the same for your OS or feel free to use this Docker image.
Kafka Connect
You should be able to find the connect-distributed.properties file in the repo that you just cloned. Replace the values for properties such as bootstrap.servers, sasl.jaas.config etc.
First, download and unzip Apache Kafka locally.
Start a local Kafka Connect cluster:
To install MQTT source connector manually:
- Download the connector/plugin ZIP file from this link, and,
- Extract it into one of the directories that is listed on the Connect worker’s plugin.path configuration properties
If you’re using Confluent Platform locally, simply use the Confluent Hub CLI: confluent-hub install confluentinc/kafka-connect-mqtt:latest
Create MQTT source connector instance
Make sure to check the mqtt-source-config.json file. Make sure you enter the right topic name for kafka.topic and leave the mqtt.topics unchanged.
Deploy the device data processor application
In the GitHub repo you just cloned, look for the application.yaml file in the consumer/src/resources folder and replace the values for:
- Azure Cache for Redis host, port and primary access key
- Confluent Cloud on Azure API key and secret
Build the application JAR file:
Create an Azure Spring Cloud application and deploy the JAR file to it:
Start simulated device data generator
You can use the script in the GitHub repo you just cloned:
Note—all it does is use the mosquitto_pub CLI command to send data.
Data is sent to the device-stats MQTT topic (this is not the Kafka topic). You can double check by using the CLI subscriber:
Check the Kafka topic in the Confluent Cloud portal. You should also check the logs for the device data processor app in Azure Spring Cloud:
Enjoy Grafana dashboards!
Browse to the Grafana UI at localhost:3000.
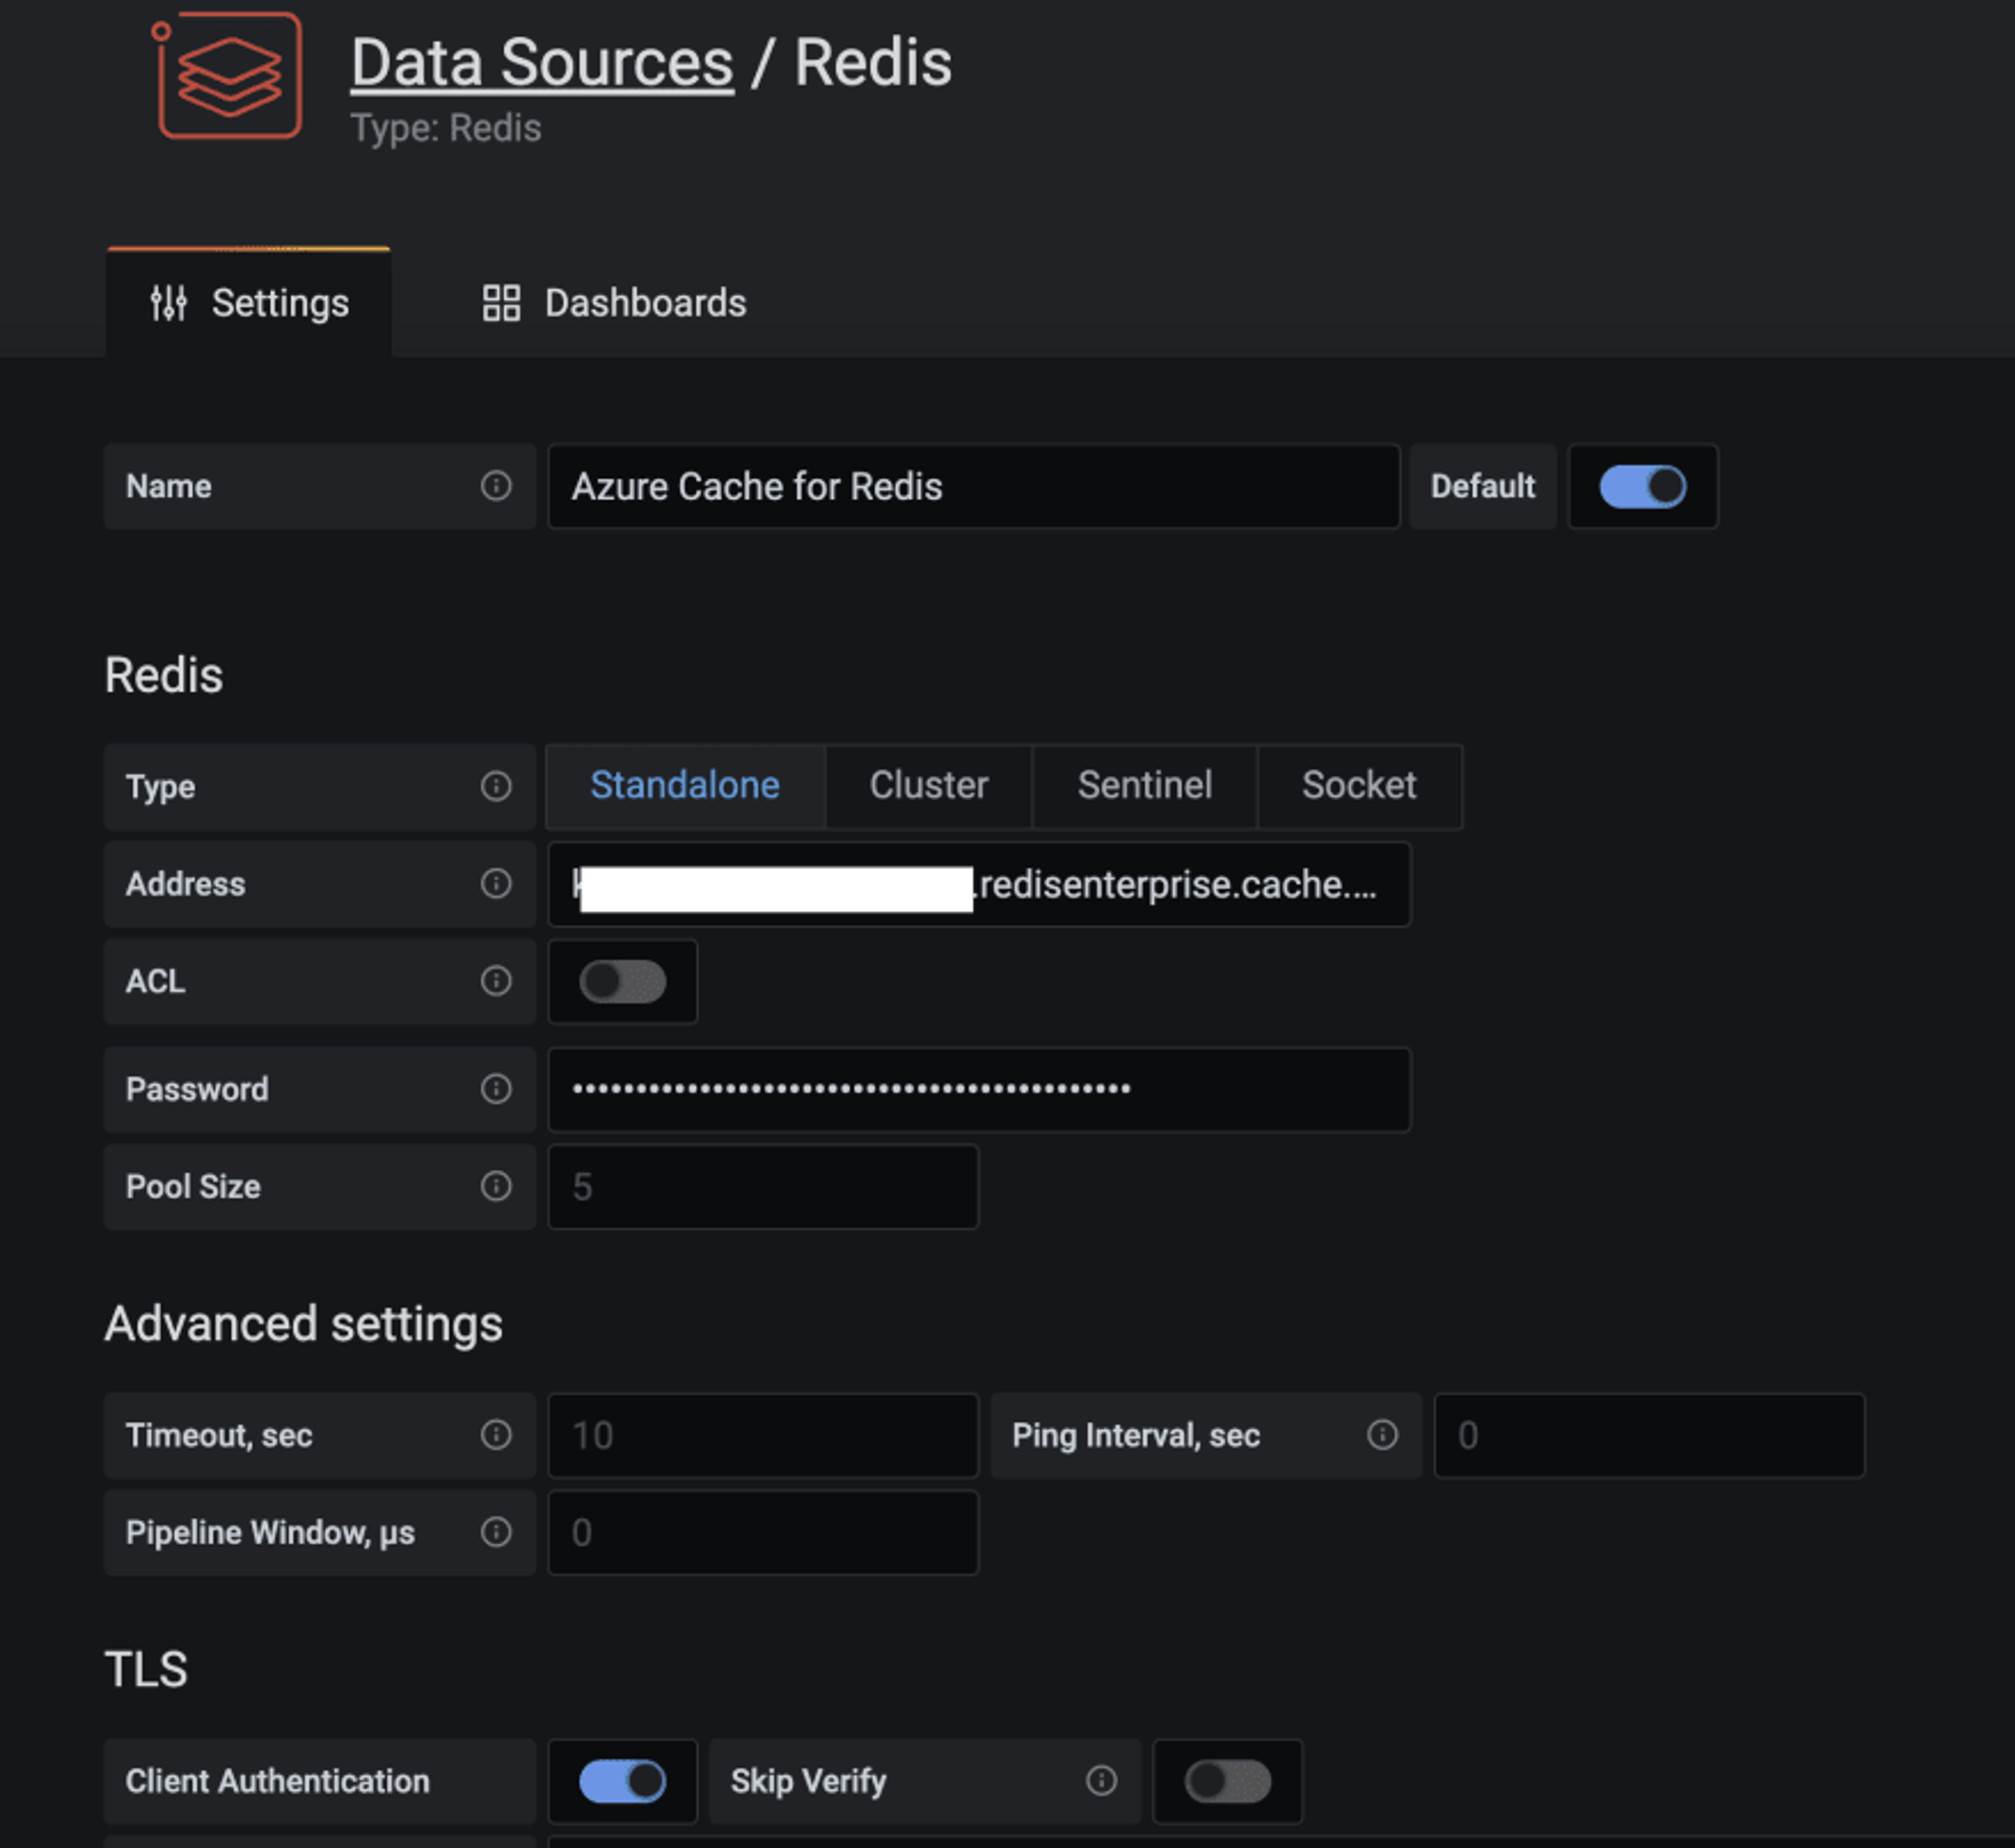
The Redis Data Source plugin for Grafana works with any Redis database, including Azure Cache for Redis. Follow the instructions in this blog post to configure a data source.
Import the dashboards in the grafana_dashboards folder in the GitHub repo you had cloned (refer to the Grafana documentation if you need assistance on how to import dashboards).
For instance, here is a dashboard that shows the average pressure (over 30 seconds) for device 5 in location 1 (uses TS.MRANGE).
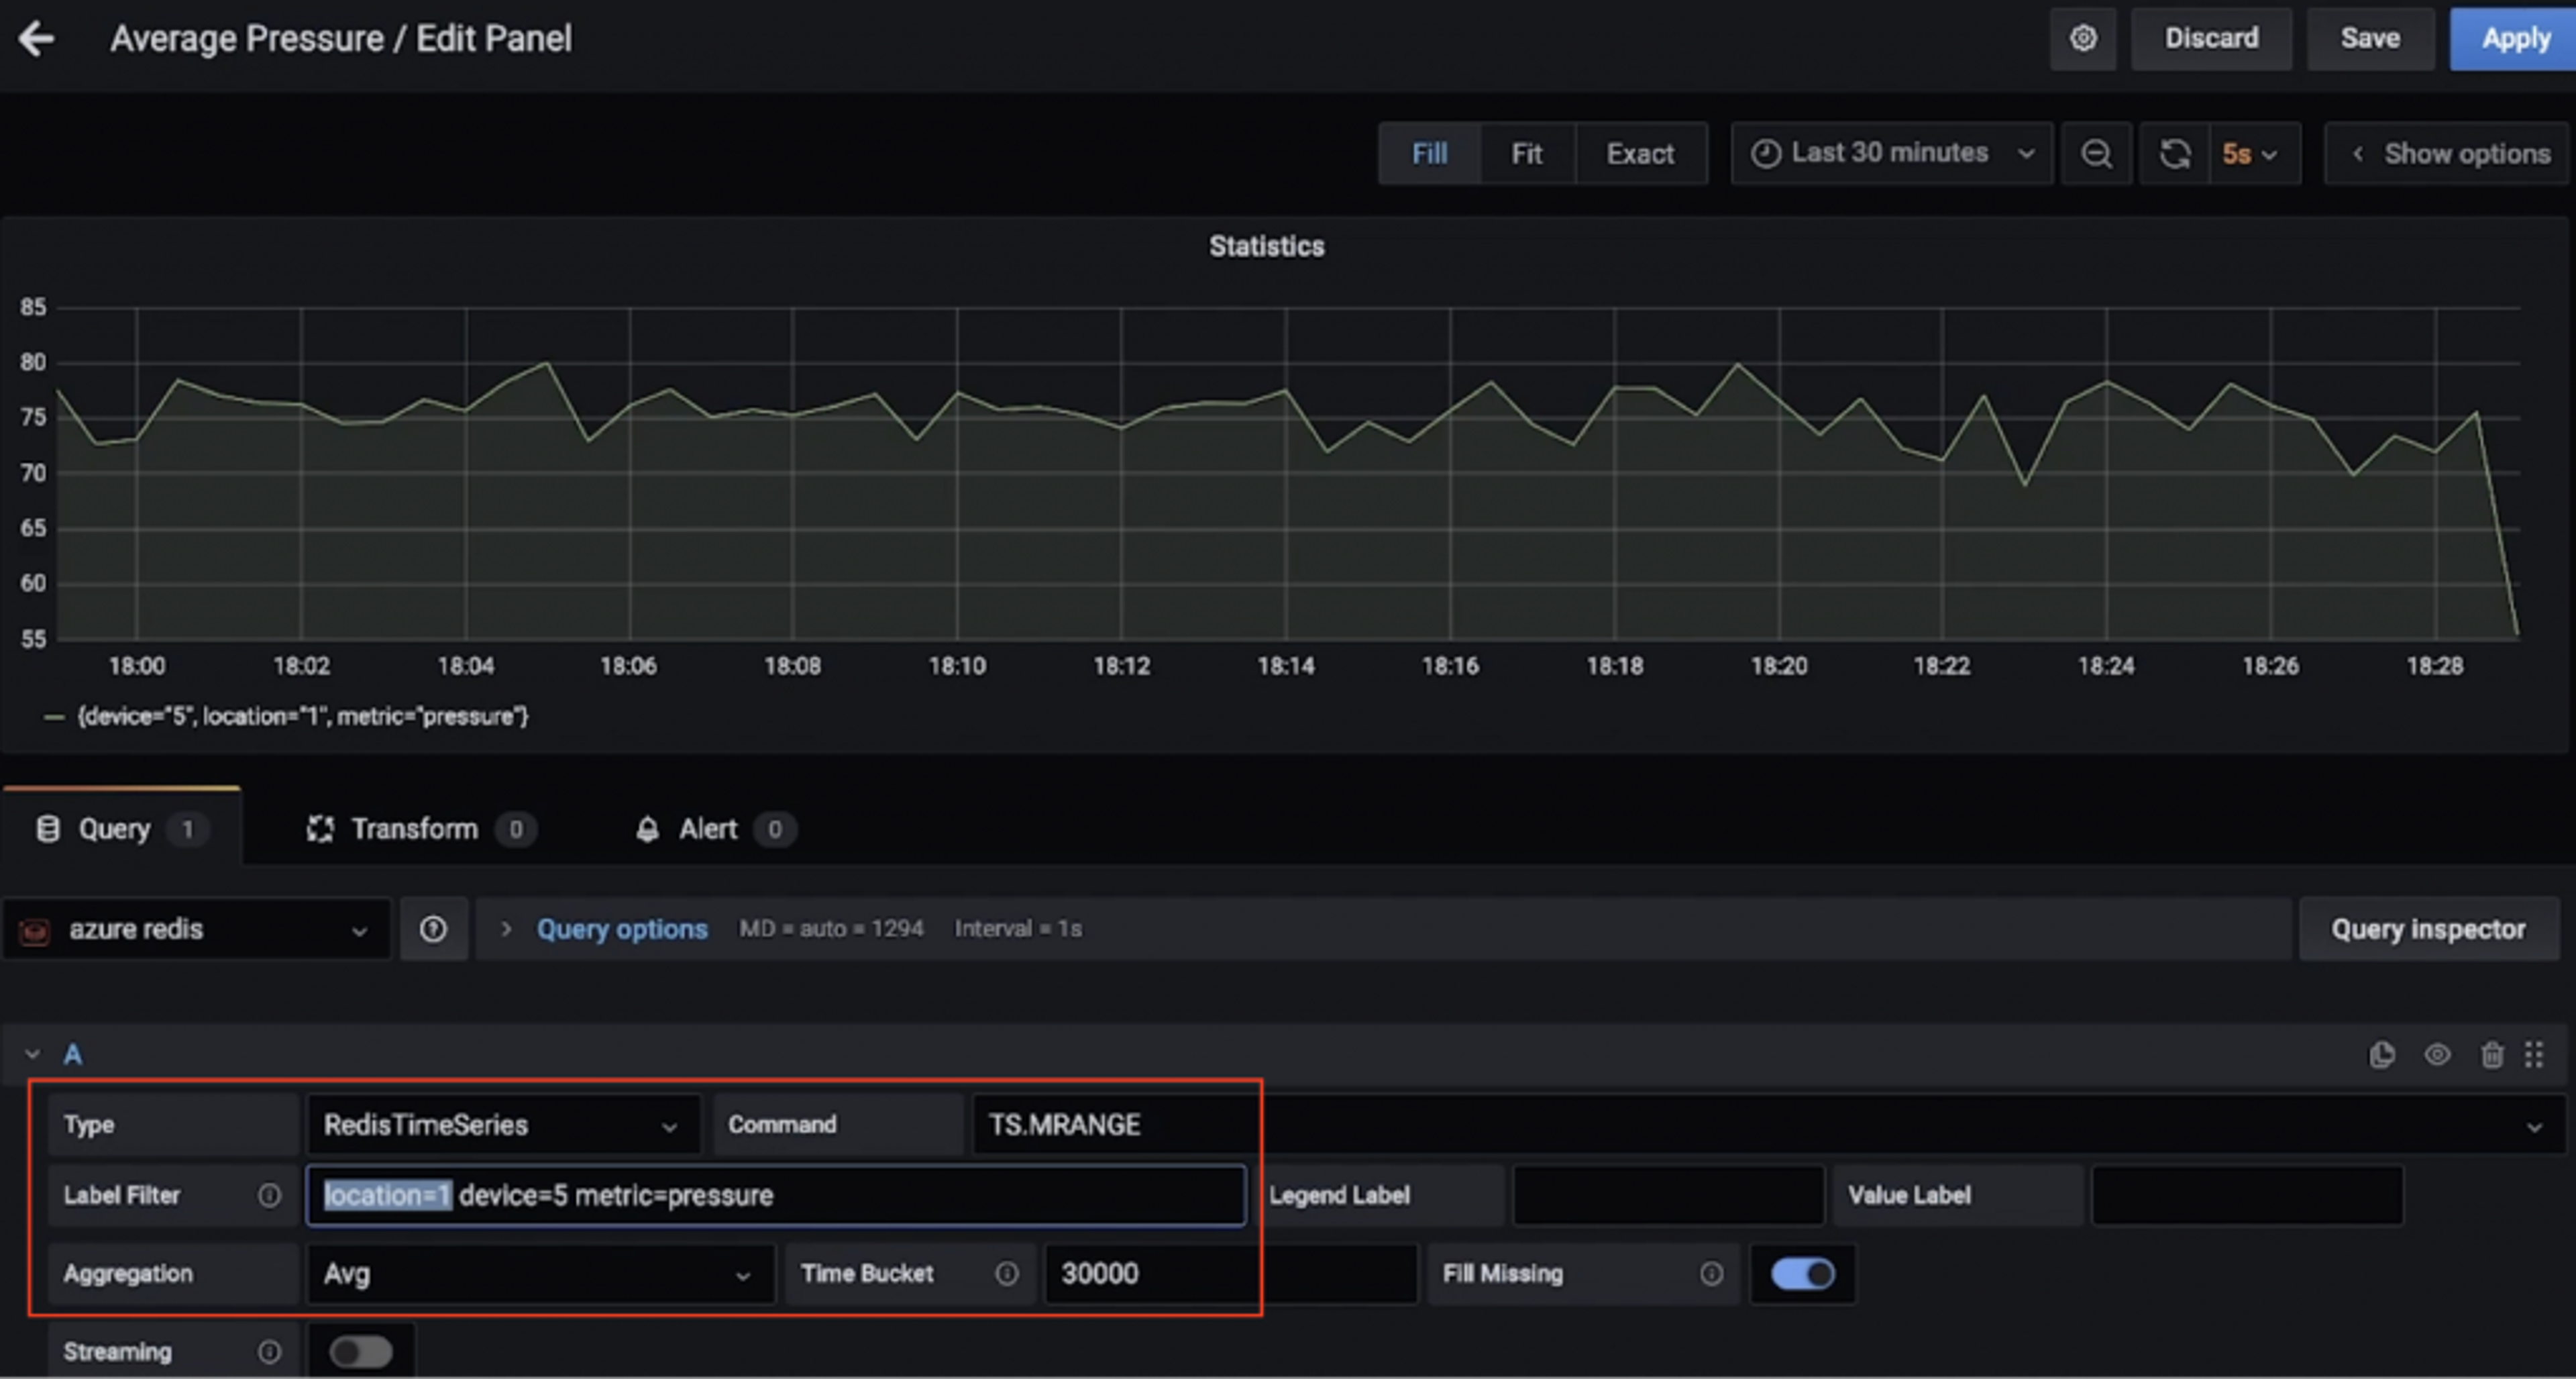
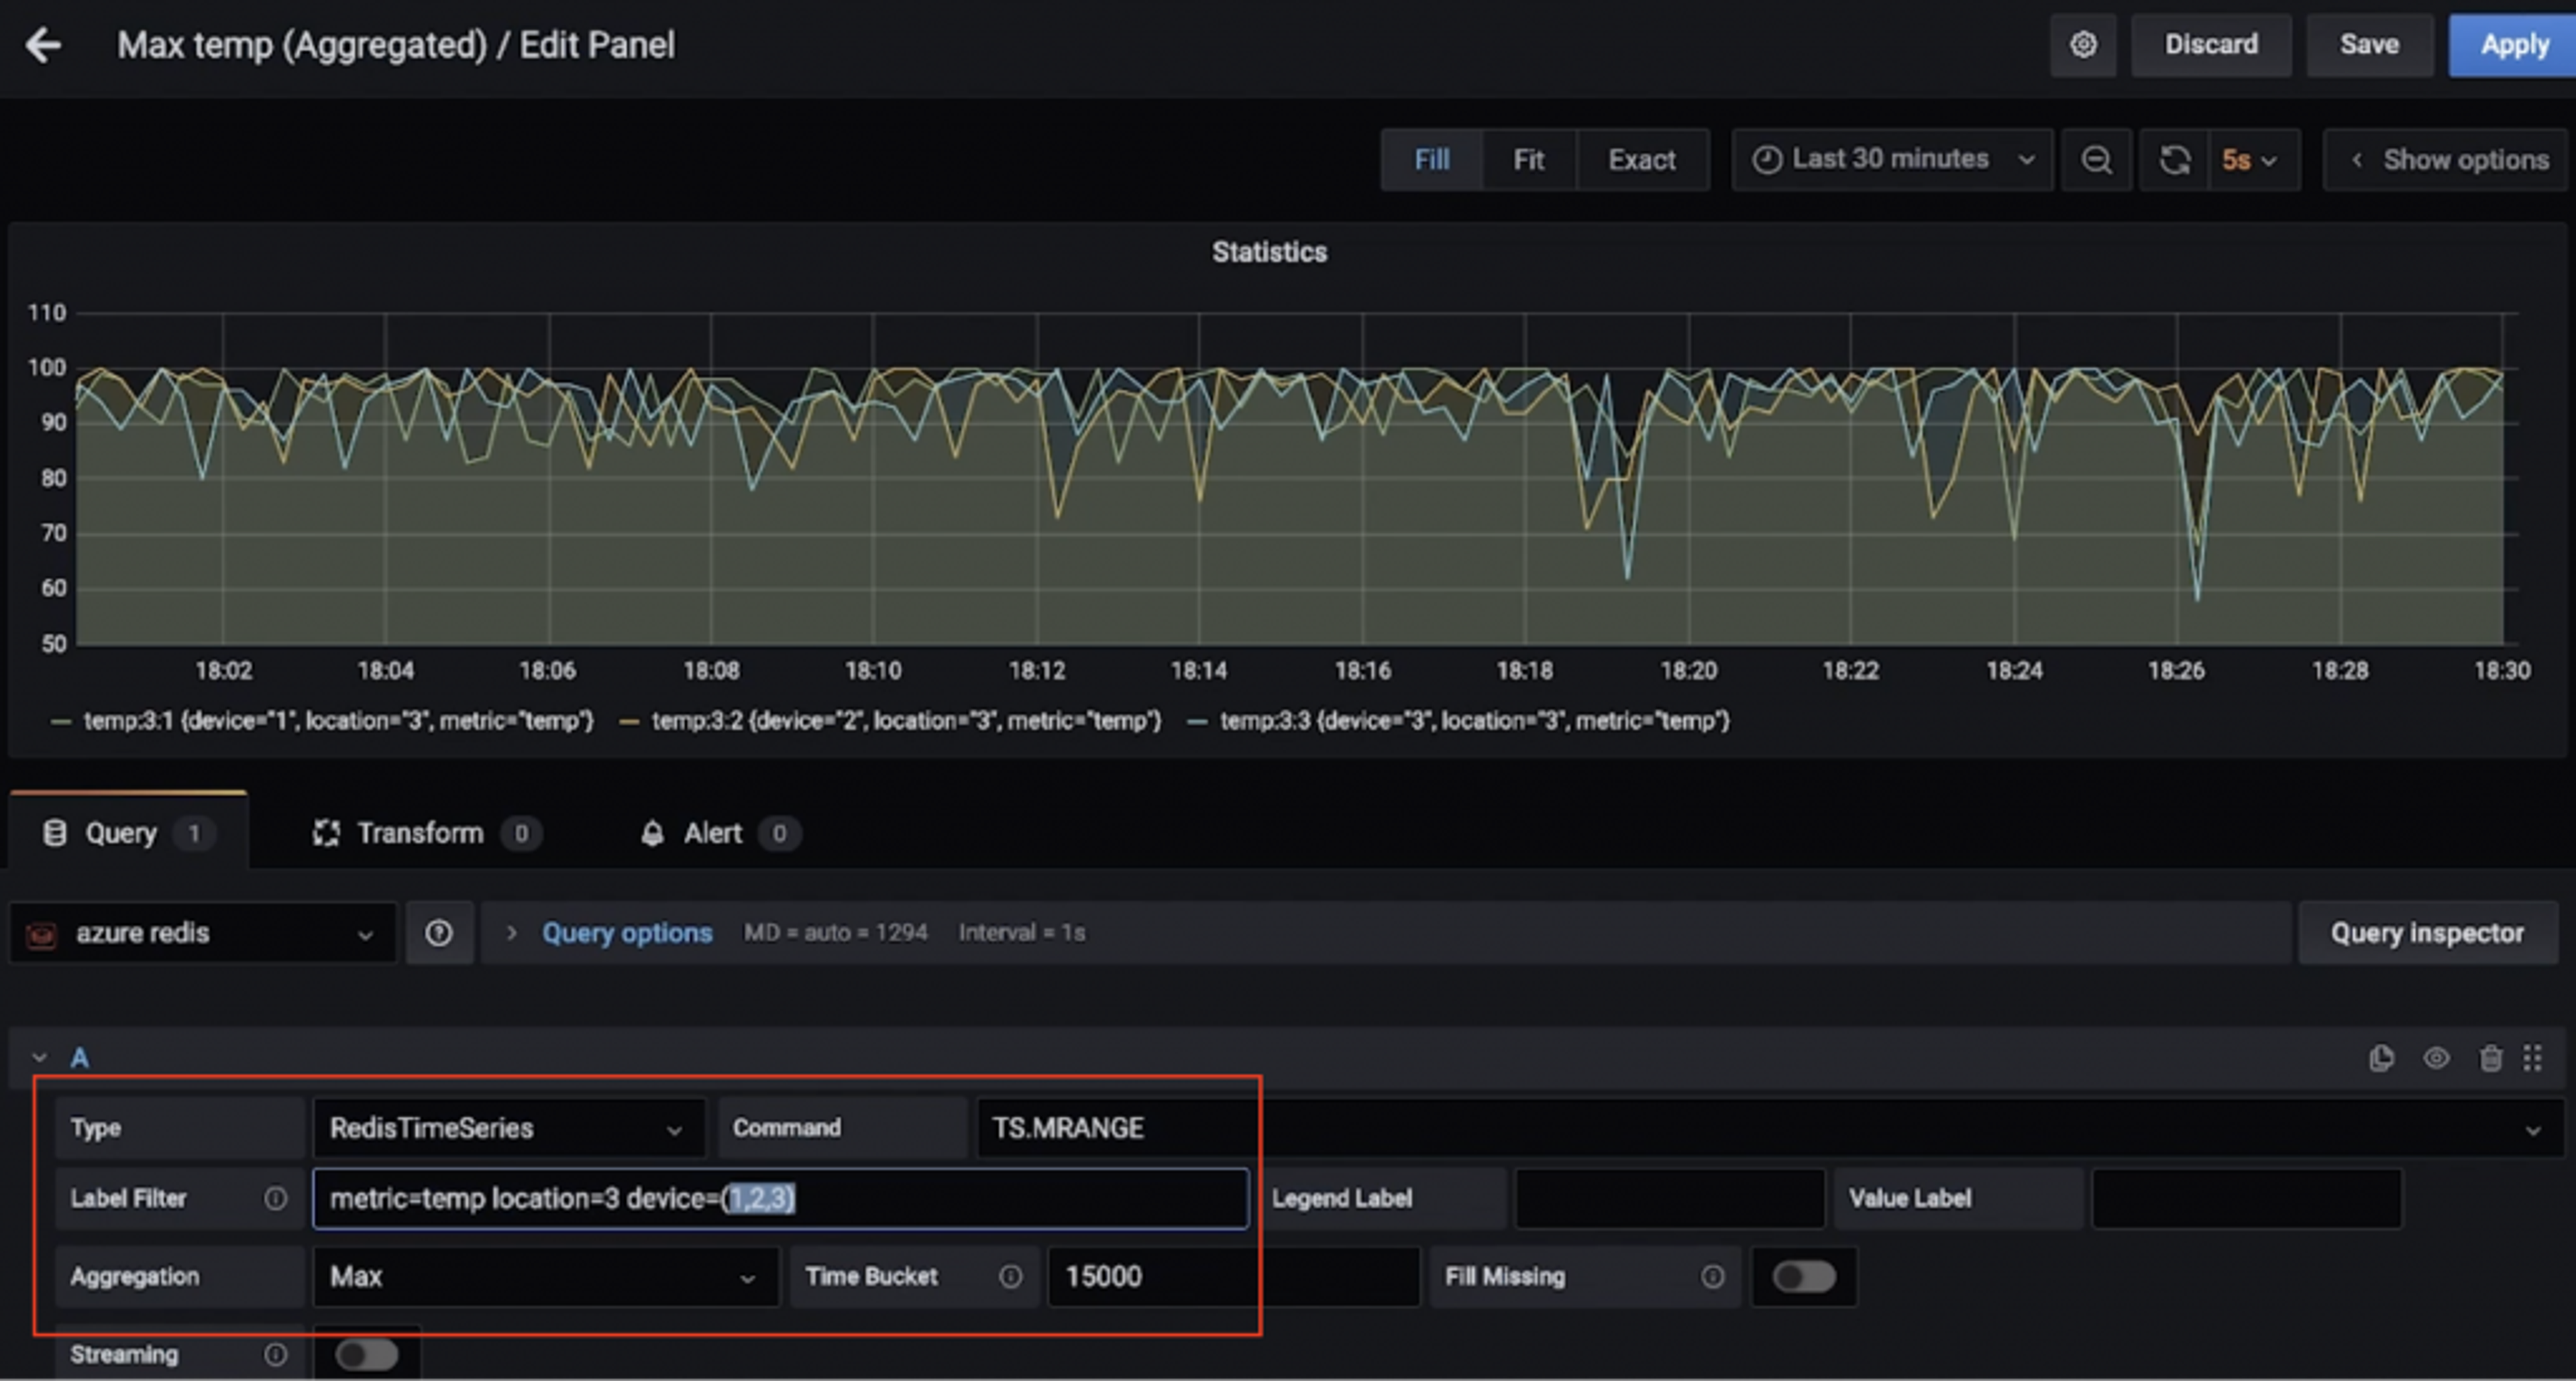
Here is another dashboard that shows the maximum temperature (over 15 seconds) for multiple devices in location 3 (again, thanks to TS.MRANGE).
So, you want to run some RedisTimeSeries commands?
Crank up the redis-cli and connect to the Azure Cache for Redis instance:
Start with simple queries:
Filter by location and get temperature and pressure for all devices:
Extract temperature and pressure for all devices in one or more locations within a specific time range:
– + refers to everything from beginning up until the latest timestamp, but you could be more specific.
MRANGE is what we needed! We can also filter by a specific device in a location and further drill down by either temperature or pressure:
All these can be combined with aggregations.
It’s also possible to create a rule to do this aggregation and store it in a different time series.
Once you’re done, don’t forget to delete resources to avoid unwanted costs.
Delete resources
- Follow the steps in the documentation to delete the Confluent Cloud cluster—all you need is to delete the Confluent organization.
- Similarly, you should delete the Azure Cache for Redis instance as well.
On your local machine:
- Stop the Kafka Connect cluster
- Stop the mosquito broker (e.g. brew services stop mosquito)
- Stop Grafana service (e.g. brew services stop grafana)
We explored a data pipeline to ingest, process, and query time-series data using Redis and Kafka. When you think about next steps and move towards a production grade solution, you should consider a few more things.
Additional considerations
Optimizing RedisTimeSeries
- Retention policy: Think about this since your time-series data points do not get trimmed or deleted by default.
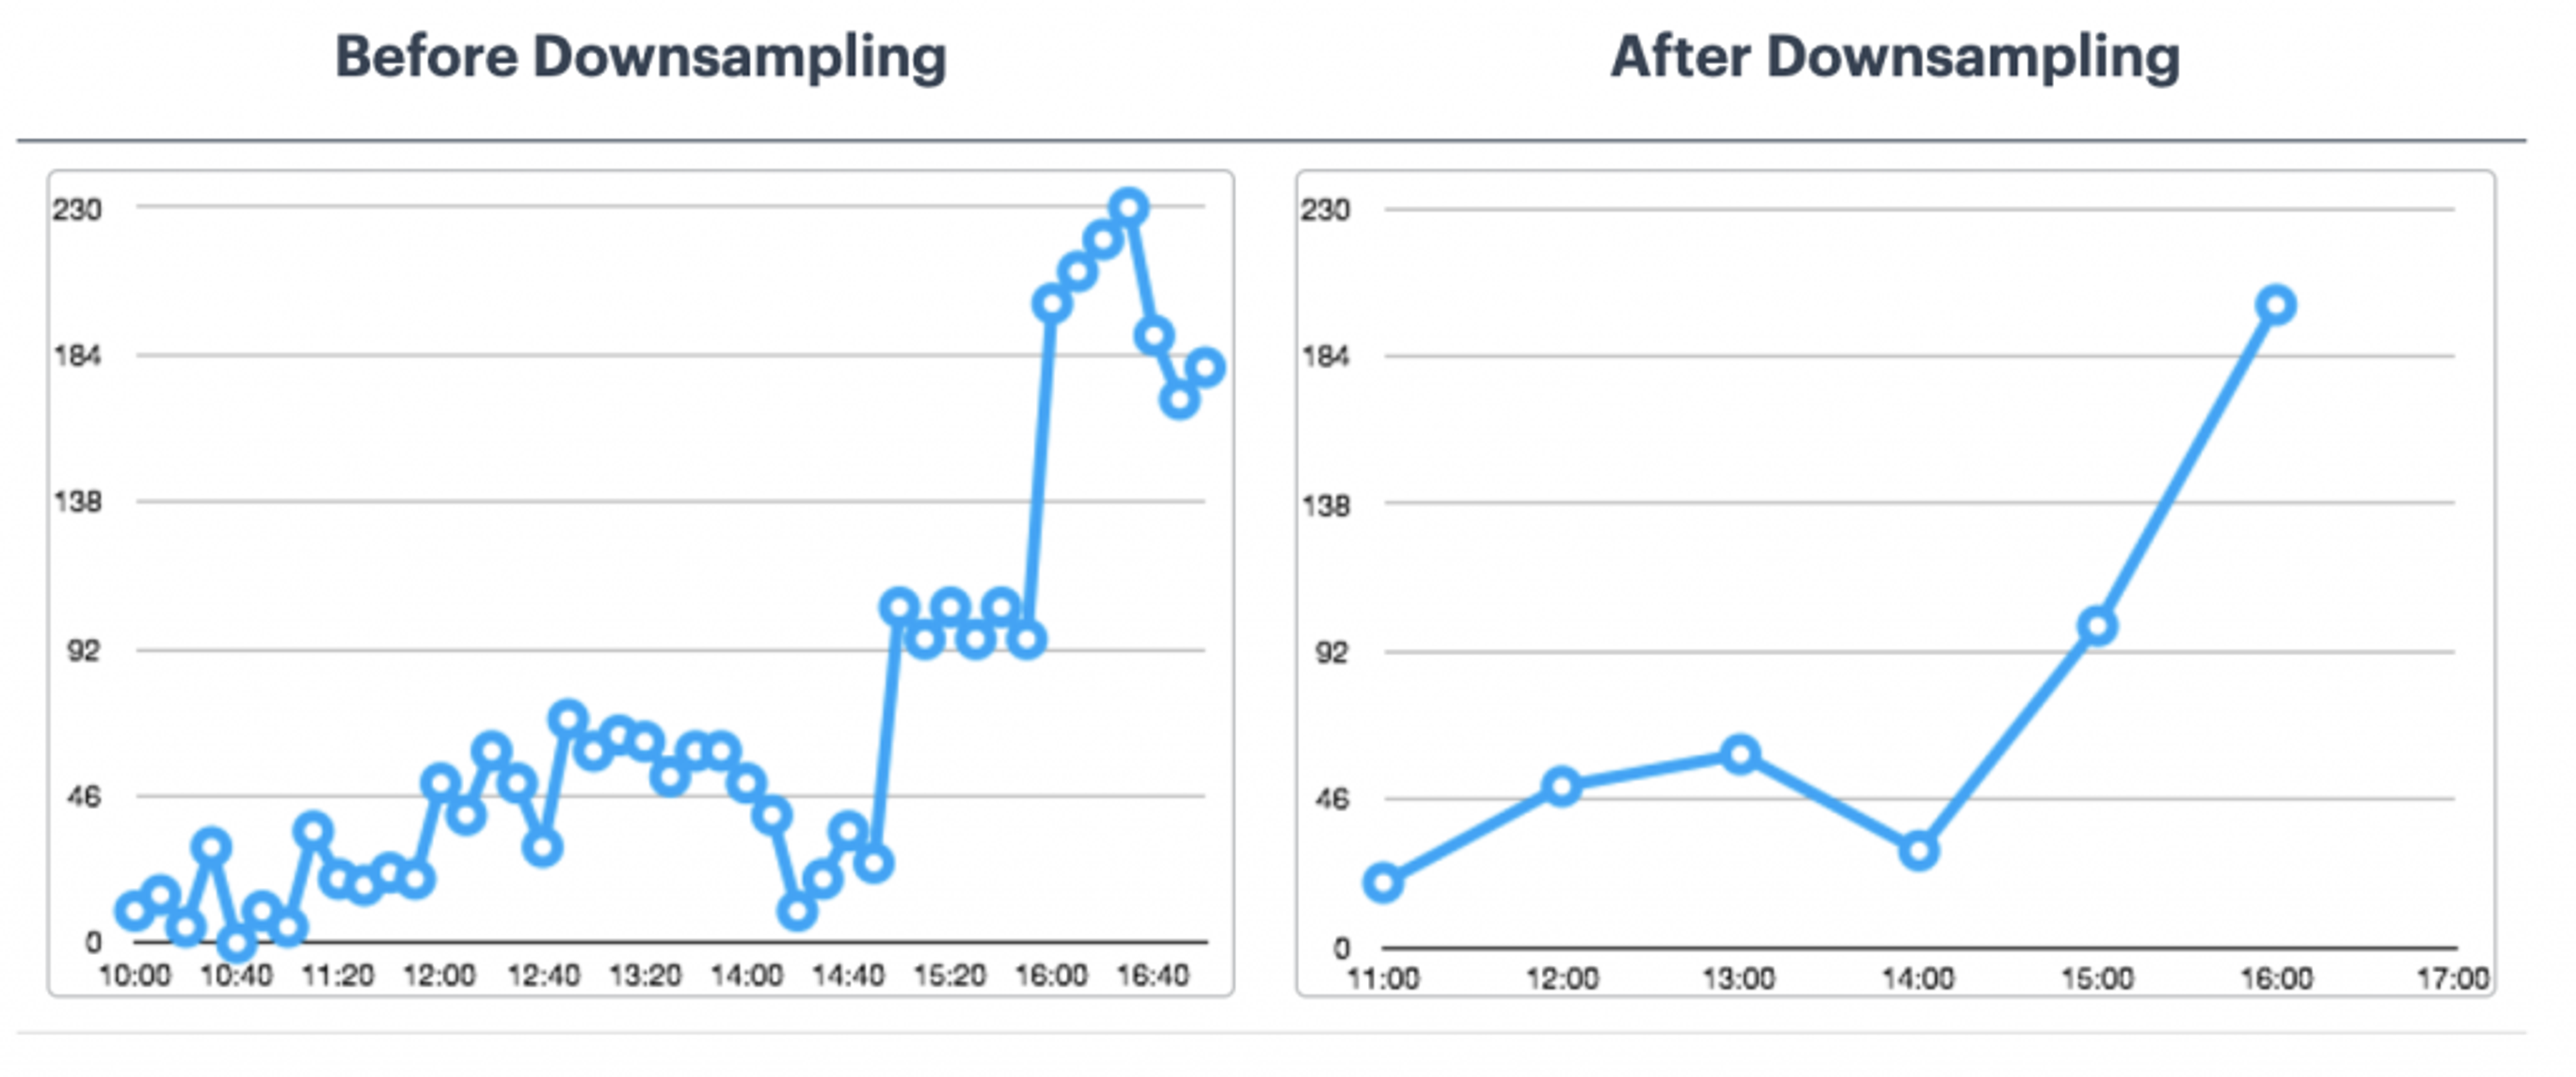
- Down-sampling and Aggregations Rules: You don’t want to store data forever, right? Make sure to configure appropriate rules to take care of this (e.g. TS.CREATERULE temp:1:2 temp:avg:30 AGGREGATION avg 30000).
- Duplicate data policy: How would you like to handle duplicate samples? Make sure that the default policy (BLOCK) is indeed what you need. If not, consider other options.
This is not an exhaustive list. For other configuration options, please refer to the RedisTimeSeries documentation
What about long term data retention?
Data is precious, including time series! You may want to process it further (e.g. run machine learning to extract insights, predictive maintenance ,etc.). For this to be possible, you will need to retain this data for a longer time frame, and for this to be cost-effective and efficient, you would want to use a scalable object storage service such Azure Data Lake Storage Gen2 (ADLS Gen2).
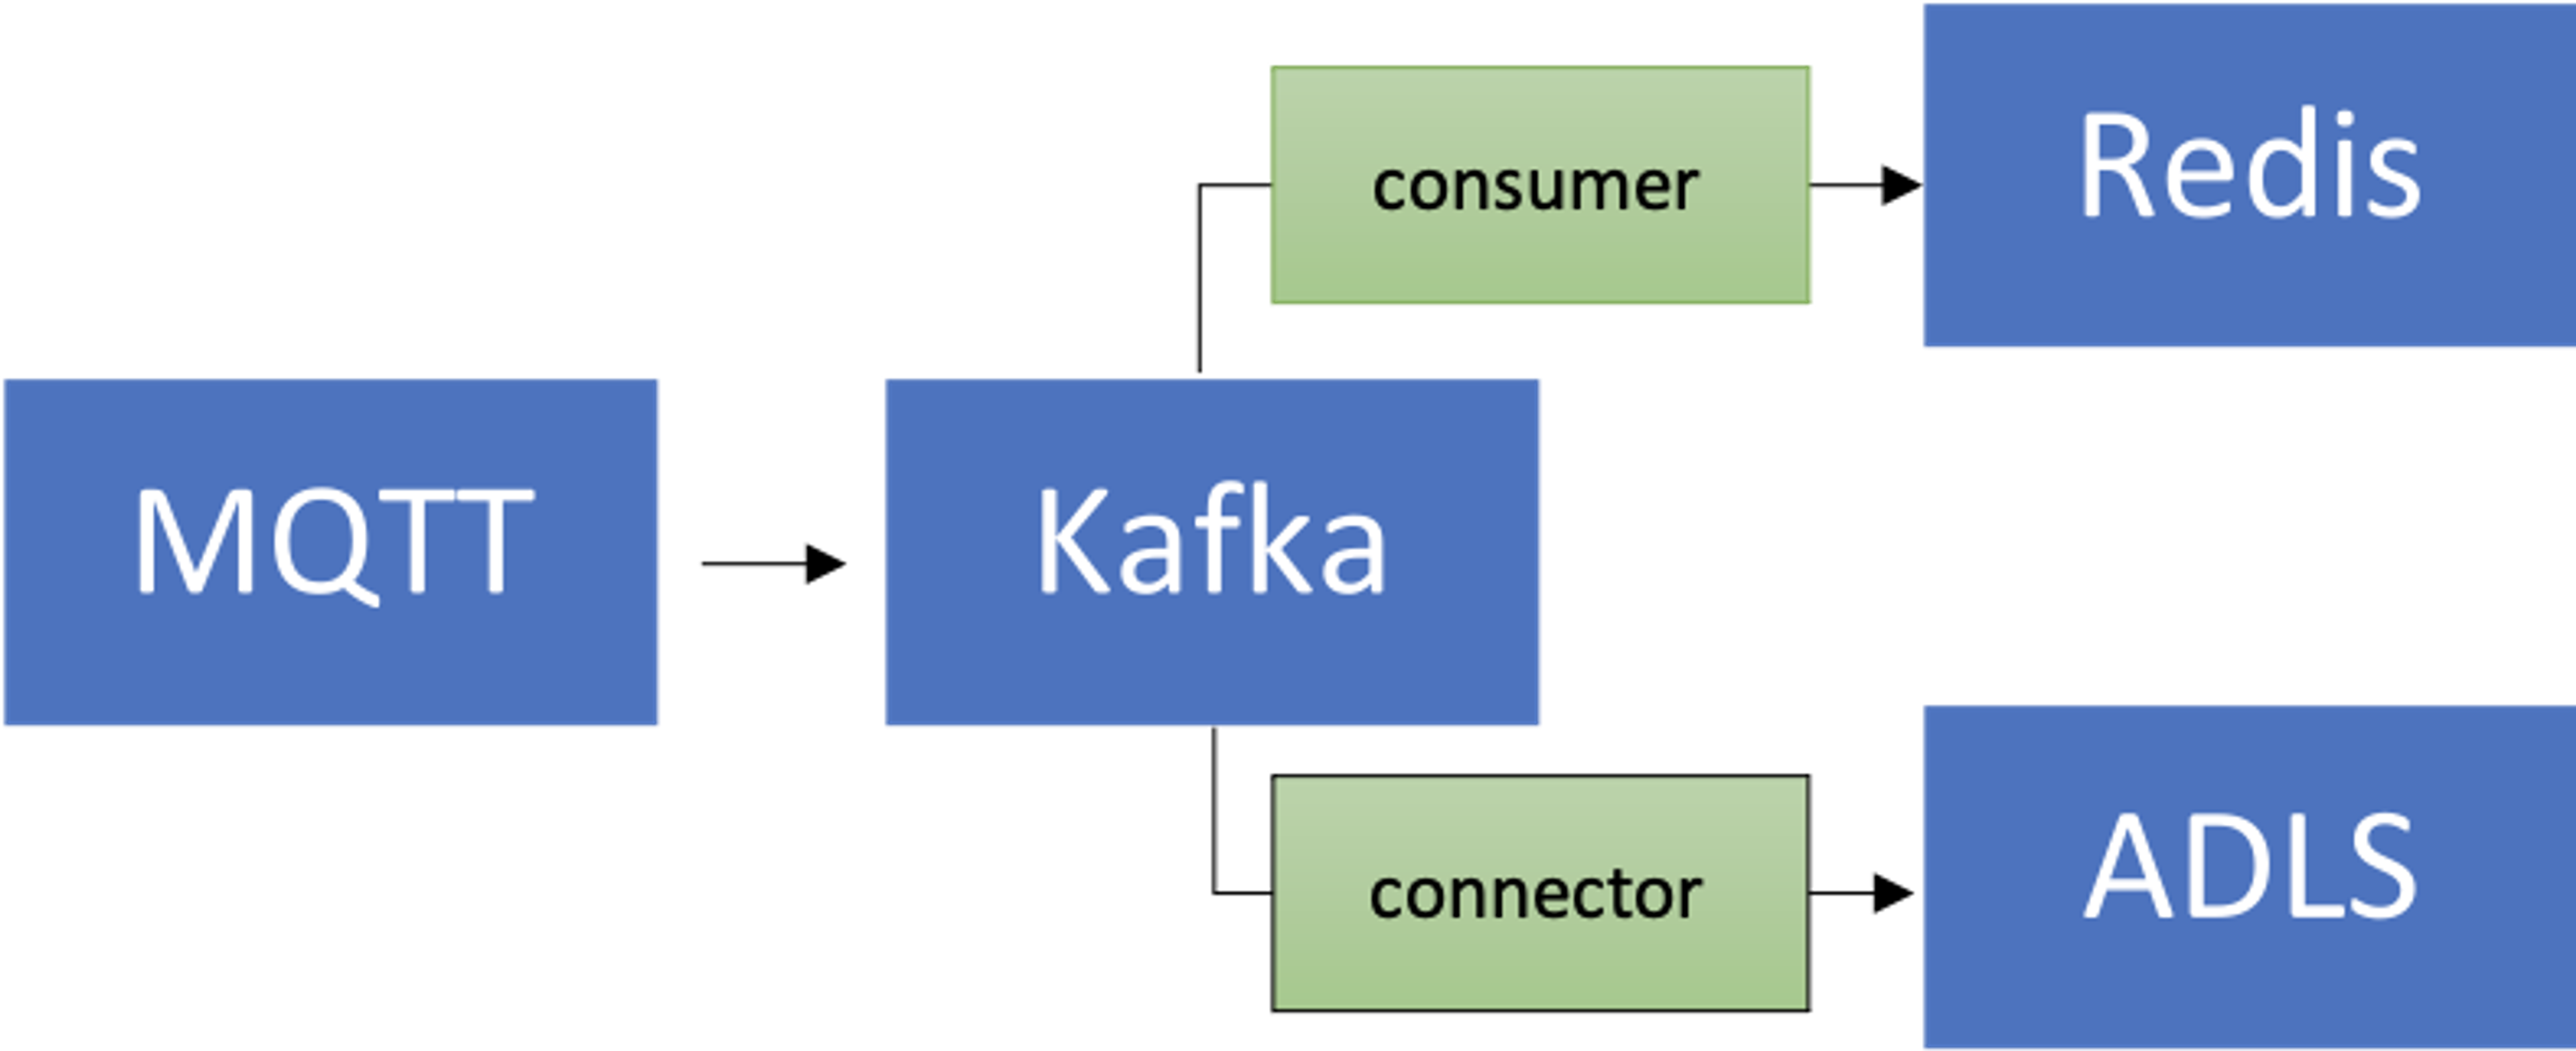
There is a connector for that! You could enhance the existing data pipeline by using the fully-managed Azure Data Lake Storage Gen2 Sink Connector for Confluent Cloud to process and store the data in ADLS and then run machine learning using Azure Synapse Analytics or Azure Databricks.
Scalability
Your time-series data volumes can only move one way—up! It’s critical for your solution to be scalable:
- Core infrastructure: Managed services allow teams to focus on the solution rather than setting up and maintaining infrastructure, especially when it comes to complex distributed systems such as databases and streaming platforms such as Redis and Kafka.
- Kafka Connect: As far as the data pipeline is concerned, you’re in good hands since Kafka Connect platform is inherently stateless and horizontally scalable. You’ have a lot of options in terms of how you want to architect and size your Kafka Connect worker clusters.
- Custom applications: As was the case in this solution, we built a custom application to process data in Kafka topics. Fortunately, the same scalability characteristics apply to them as well. In terms of horizontal scale, it is limited only by the number of Kafka topic partitions you have.
Integration: It’s not just Grafana! RedisTimeSeries also integrates with Prometheus and Telegraf. However, there is no Kafka connector at the time this blog post was written—this would be a great add-on!
Conclusion
Sure, you can use Redis for (almost) everything, including time-series workloads! Be sure to think about the end-to-end architecture for data pipeline and integration from time-series data sources, all the way to Redis and beyond.
Get started with Redis today
Speak to a Redis expert and learn more about enterprise-grade Redis today.
