Blog
RedisGraph 2.0 Boosts Performance Up to 6x
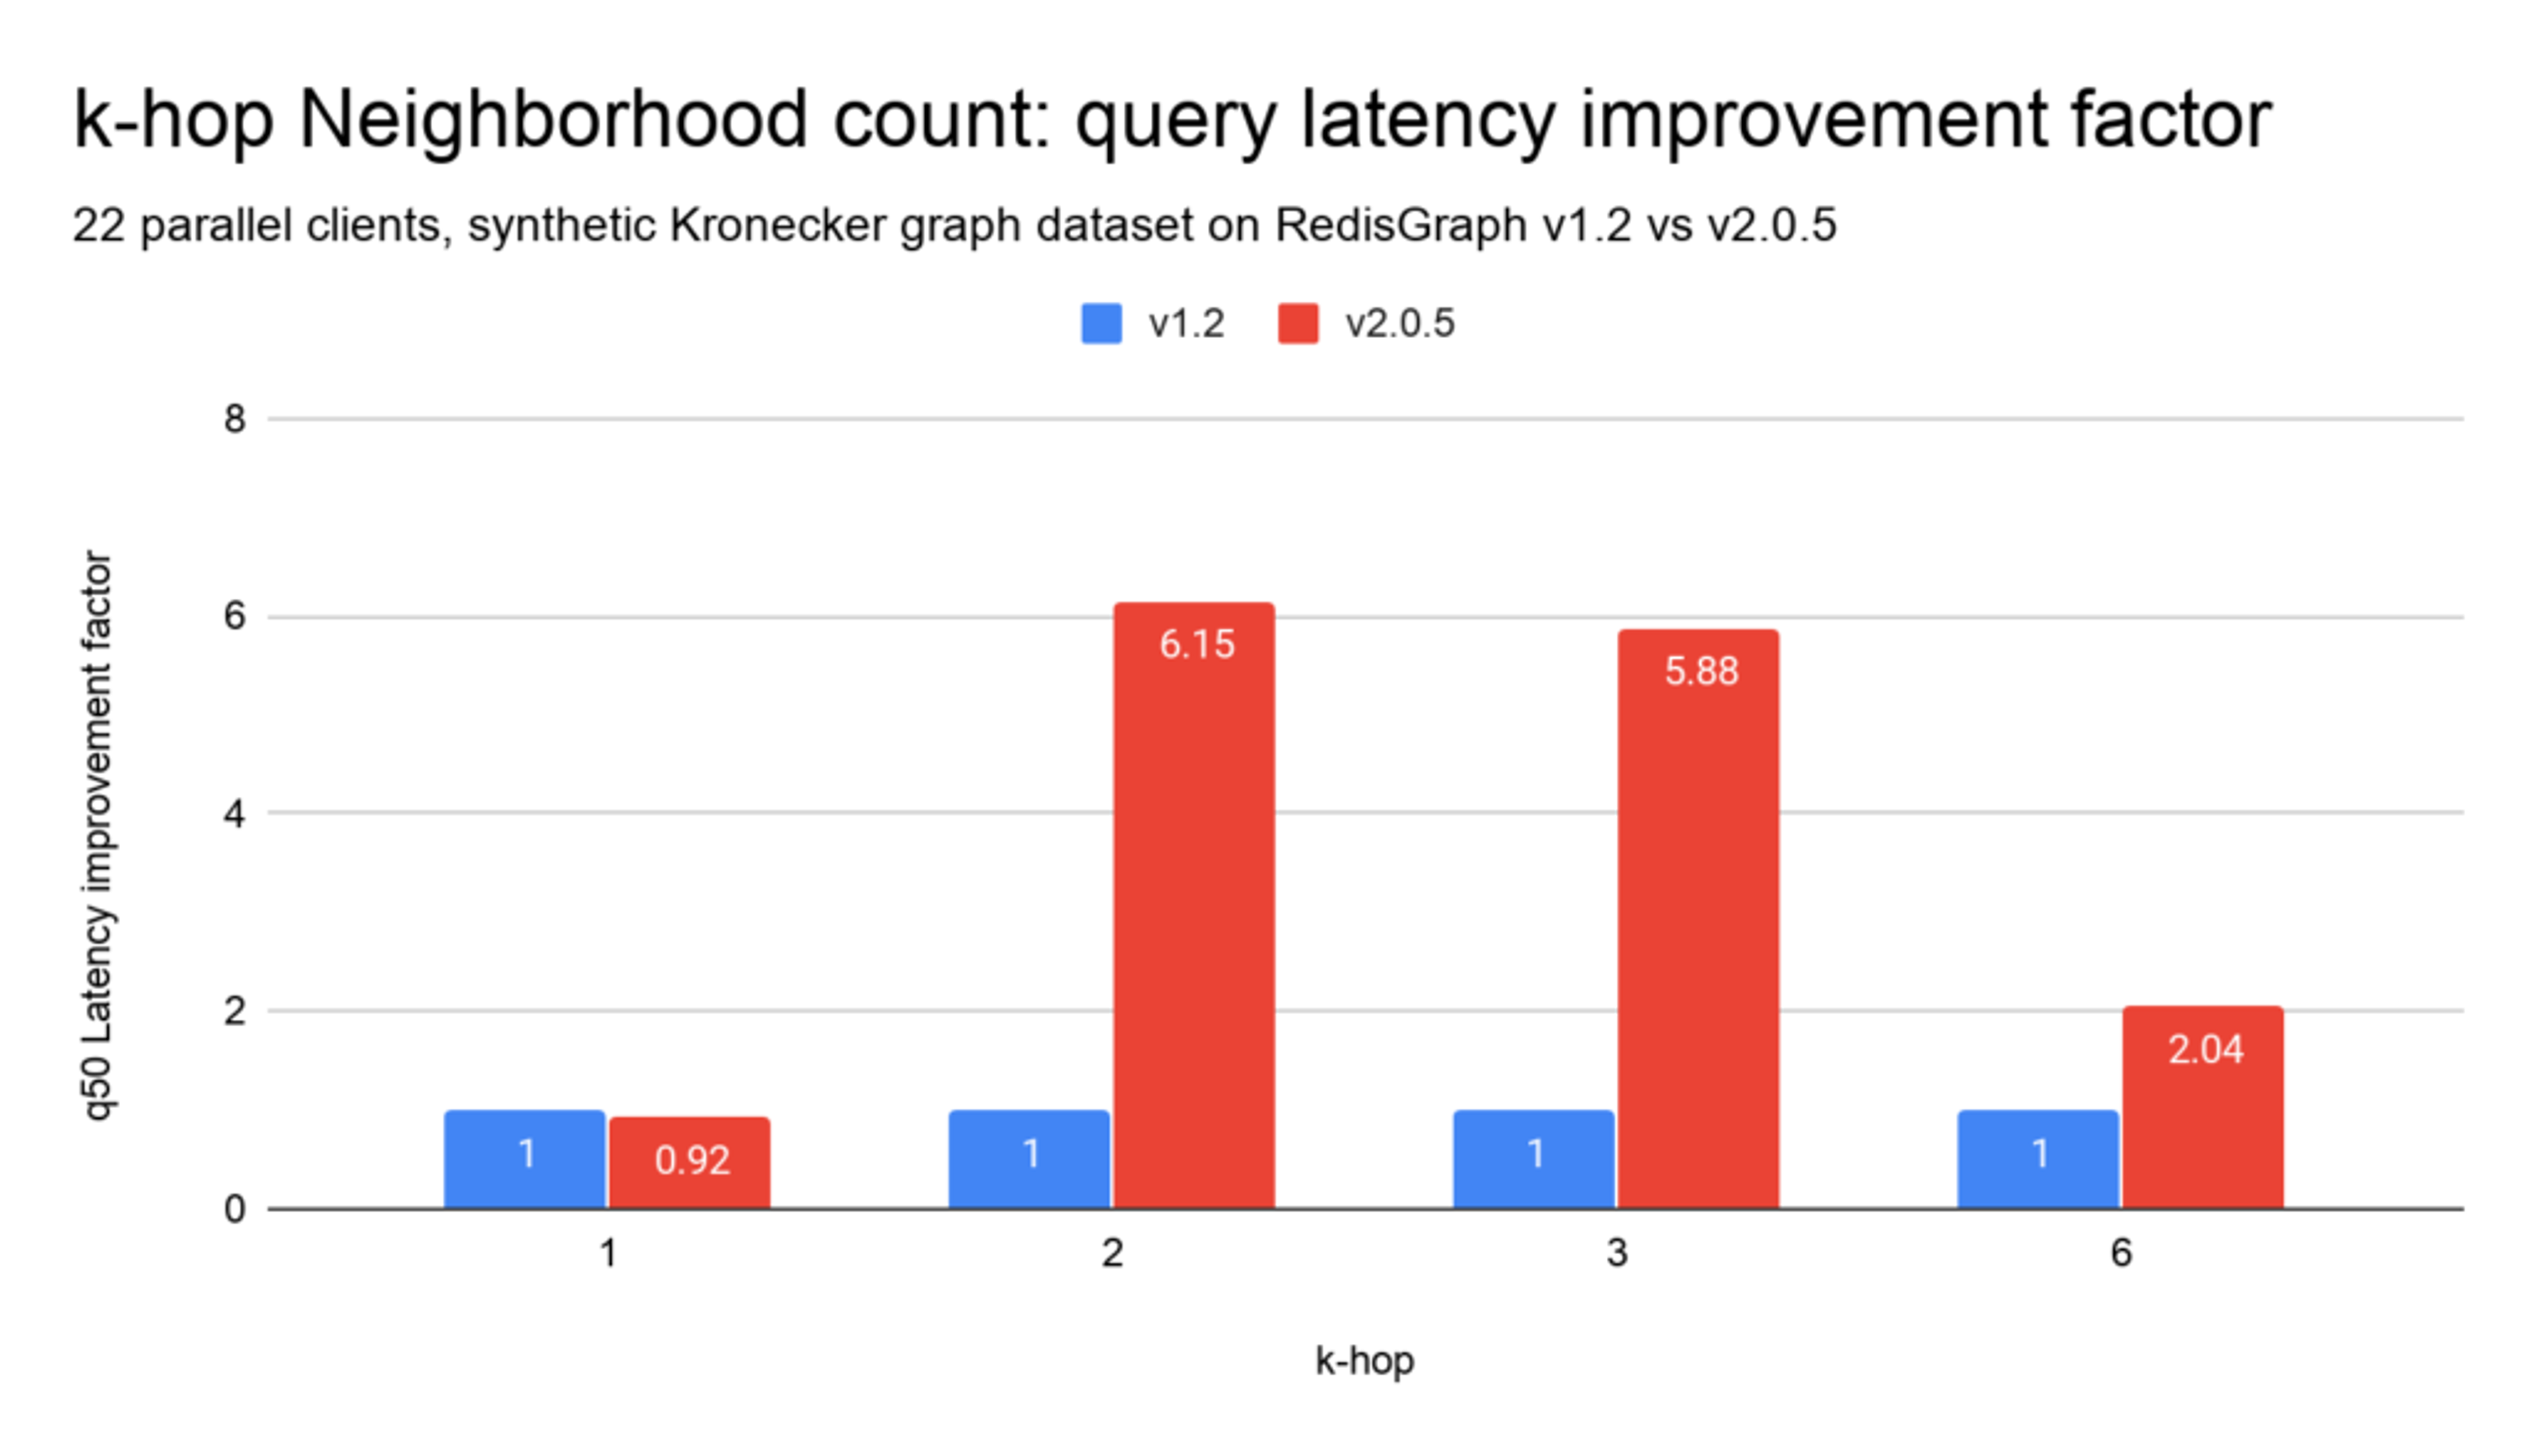
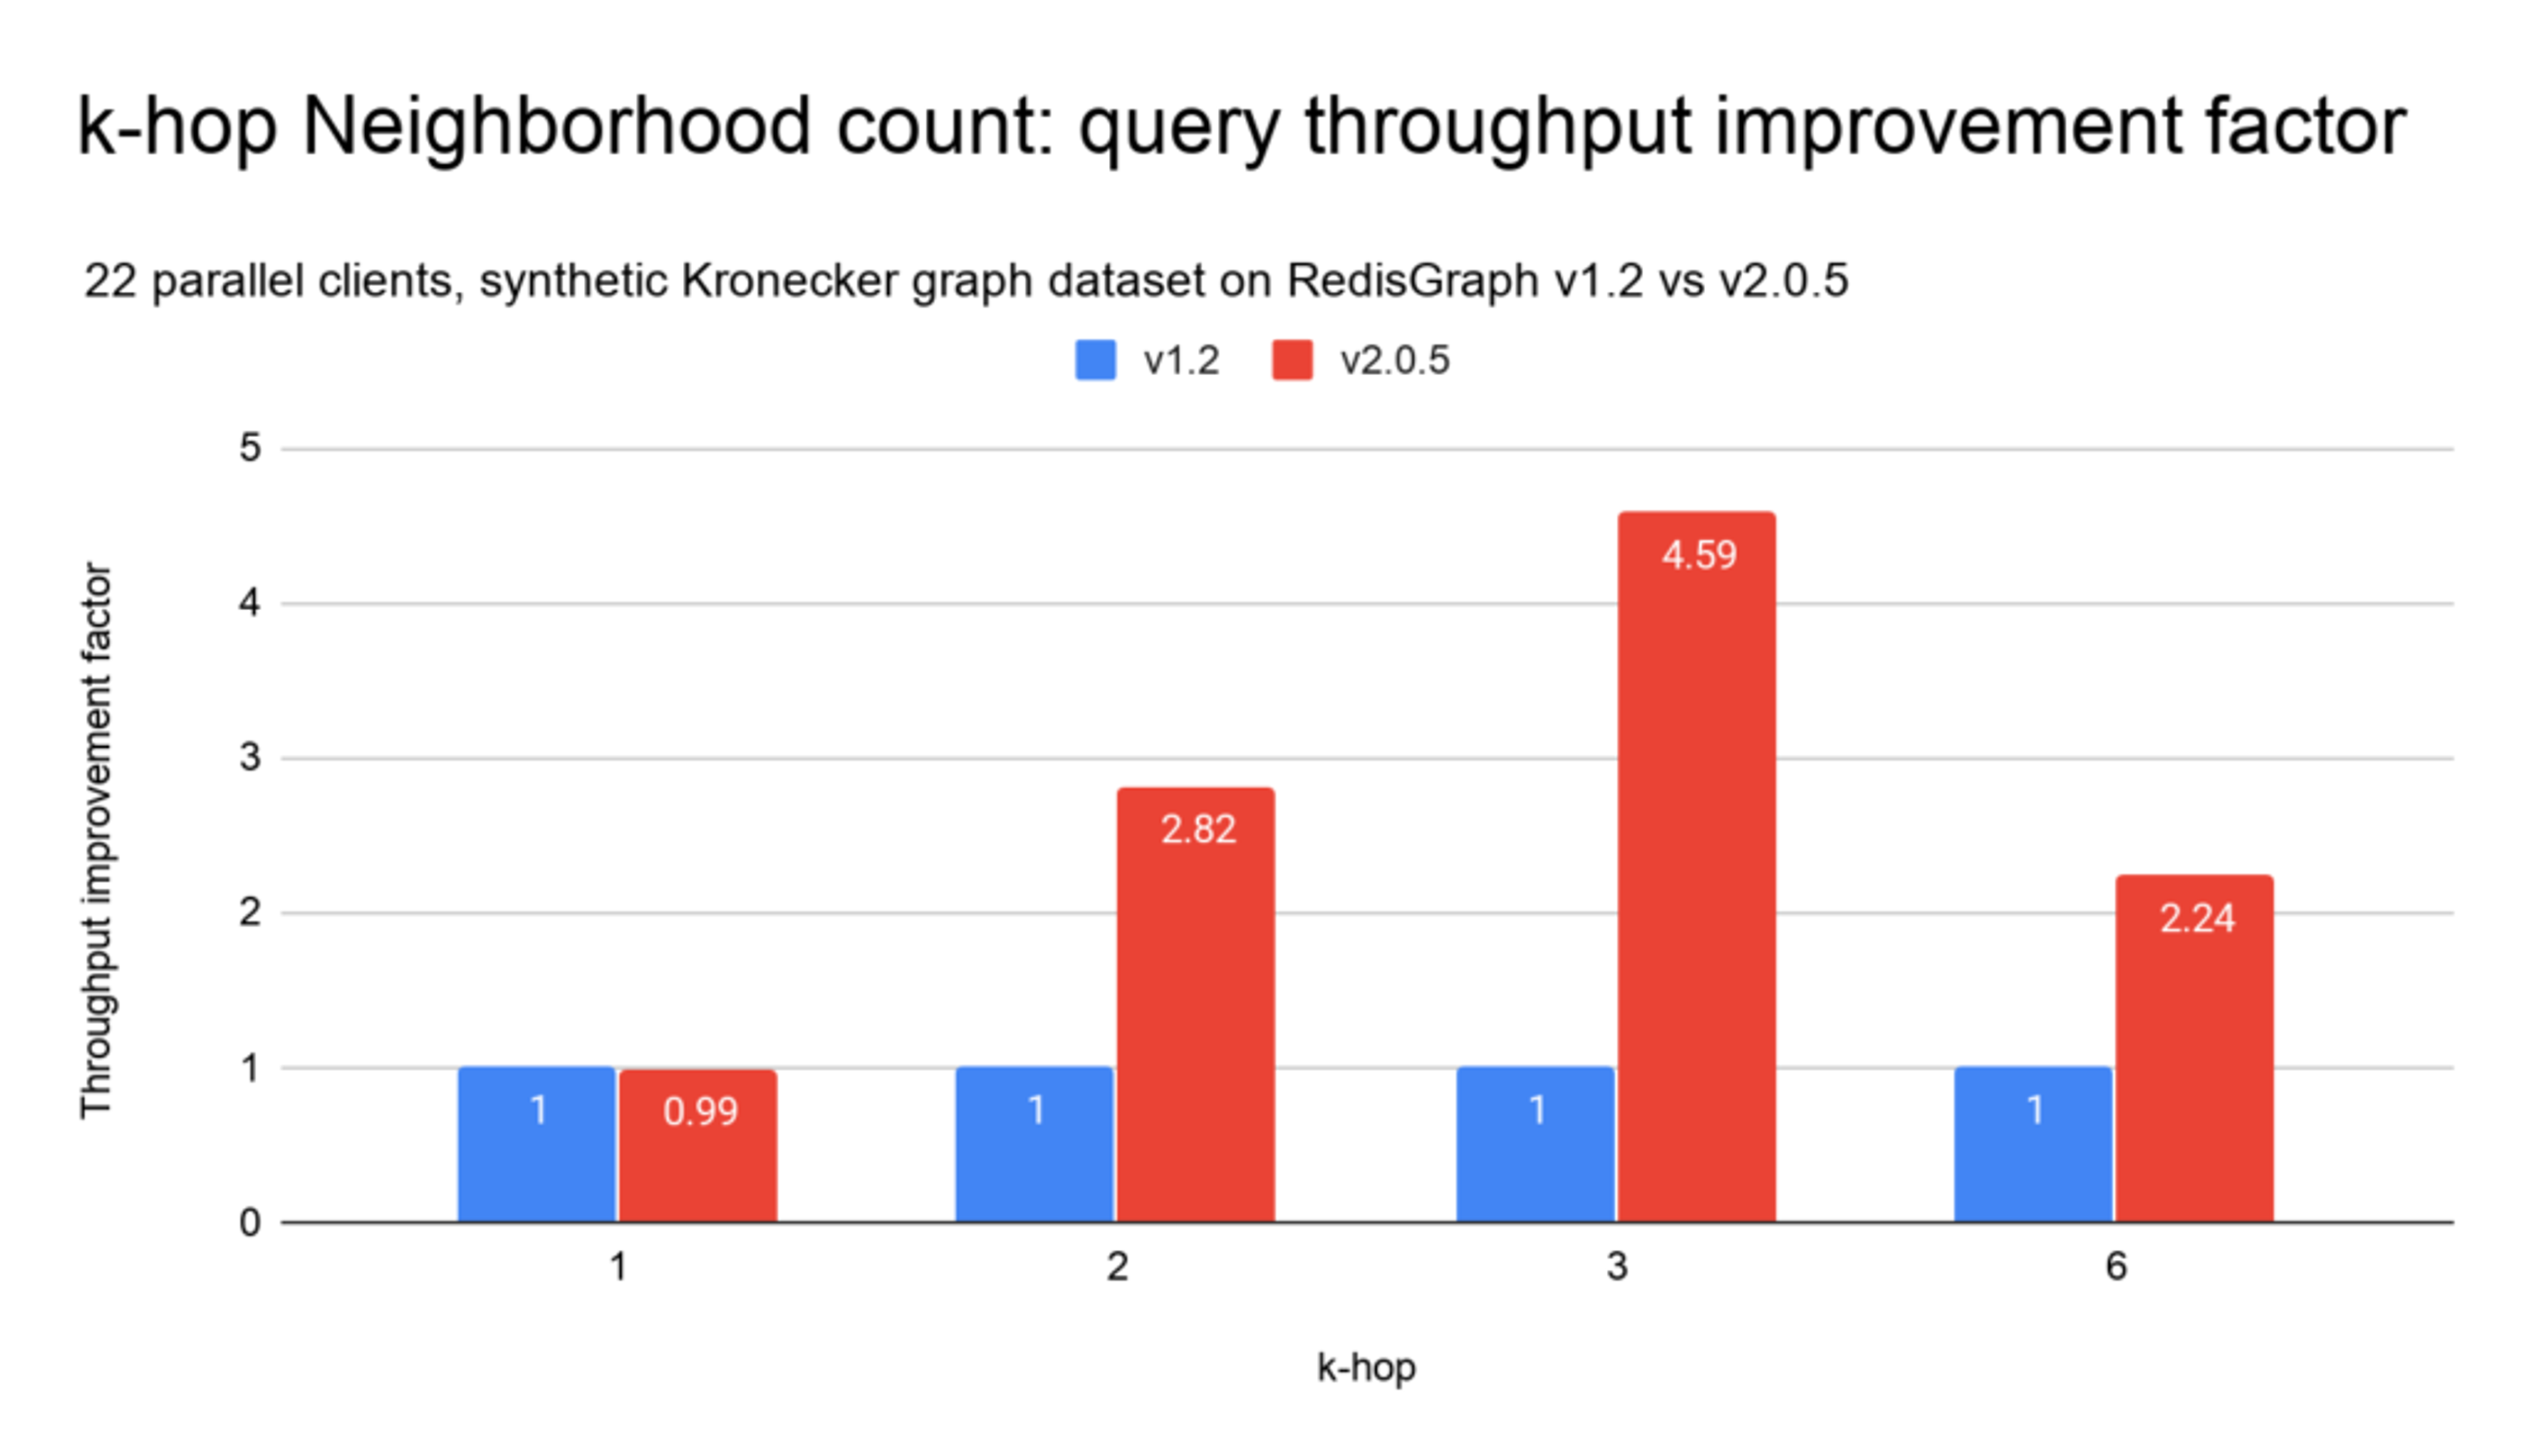
The newly announced RedisGraph 2.0 module brings a number of improvements, including increased Cypher support, full-text search, and it enables graph visualization. Just as important, however, the latest version of RedisGraph delivers significant performance improvements: with latency improvements up to 6x and throughput improvements up to 5x. Let’s take a look at those performance gains and the benchmarks used to demonstrate them.
When we released RedisGraph 1.0 back in November 2018, we shared benchmark results based on the k-hop neighborhood count query. The new RedisGraph 2.0 includes new features and functionalities that support more-comprehensive test suites, like the ones provided by the Linked Data Benchmark Council (LDBC)—more on that below. But we still rely on the k-hop benchmark in order to compare RedisGraph 2.0 to v1.2.
The K-hop neighborhood count query is a graph local query that counts the number of nodes a single start node (seed) is connected to at a certain depth, and counts only nodes that are k-hops away, as shown here:
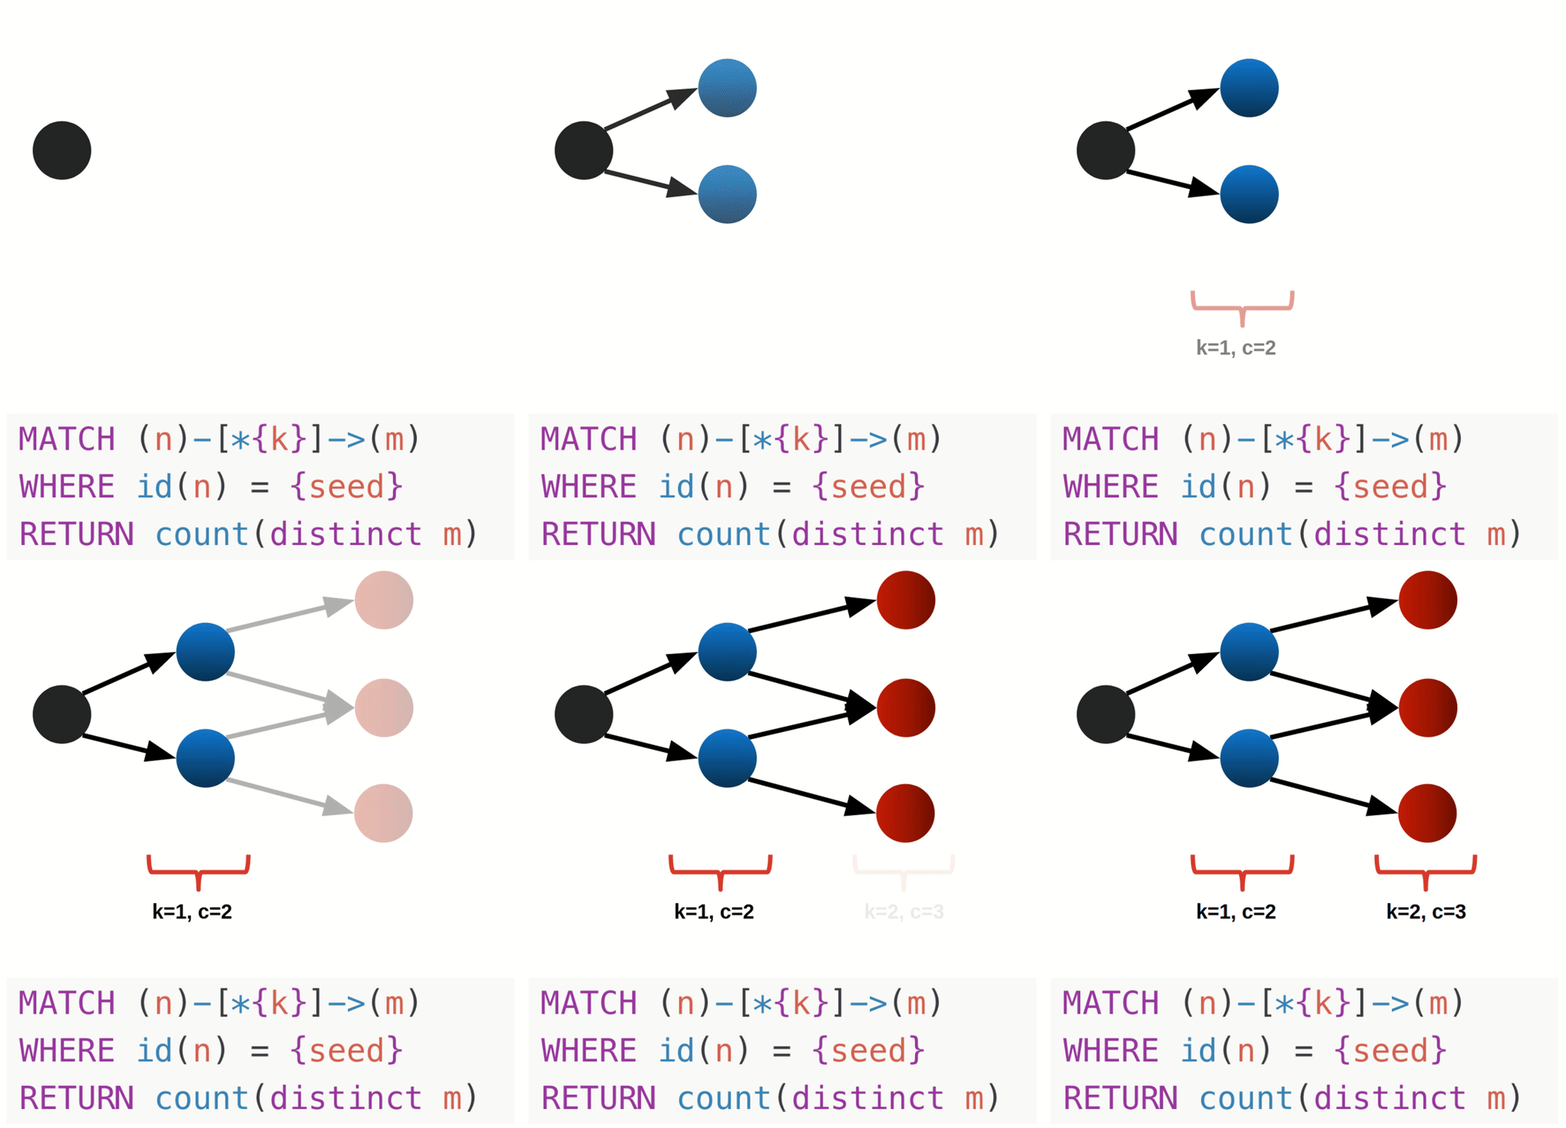
K-hop neighborhoods queries are very useful in analytic tasks on large-scale graphs, like finding relations in a social network, or recommending friends or advertising links according to common properties.
Dataset
We’ve kept the previous benchmark Graph 500 dataset with scale 22, with the following graph characteristics:
To gain deeper insight and coverage of the database performance, we extended the seed coverage of the benchmark to 100,000 random deterministic seeds instead of 300. To make it easy for anyone to replicate our results, here is a public link to the persistent store graph 500 dataset with scale 22 on RDB format.
The methodology of k-hop benchmark
For each tested version, we performed:
- 1-Hop 22M queries
- 2-Hop 220K queries
- 3-Hop 22K queries
- 6-Hop 22K queries
All queries were under a concurrent parallel load of 22 clients. We reported the median (q50) and achievable throughput.
To get steady-state results, we discarded the previous Python benchmark client in favor of the memtier_benchmark, which provides low overhead and full-latency-spectrum latency metrics.
Testing infrastructure
All benchmark variations were run on Amazon Web Services instances, provisioned through our benchmark-testing infrastructure. Both the benchmarking client and database servers were running on separate c5.12xlarge instances. The tests were executed on a single-shard setup, with RedisGraph versions 1.2 and 2.0.5.
In addition to the primary benchmark/performance analysis scenarios described above, we also enable running baseline benchmarks on network, memory, CPU, and I/O, in order to understand the underlying network and virtual machine characteristics. We represent our benchmarking infrastructure as code so that it is stable and easily reproducible.
Benchmark results
The RedisGraph 1.2 vs 2.0 benchmark values point towards significant improvements on parallel workloads (multiple clients). We’ve measured latency improvements up to 6x and throughput improvements up to 5x when performing graph traversals. The more parallel and computationally expensive the workload, the better RedisGraph 2.0 performs when compared to the previous version.
OpenMP effect
RedisGraph 2.0 incorporates the latest version 3.2.0 of SuiteSparse:GraphBLAS —SuiteSparse’s implementation of GraphBLAS— which RedisGraph uses for sparse matrix operations. With this version it is now possible to exploit shared-memory parallelism by recurring to OpenMP in order to gain significant performance advantages.
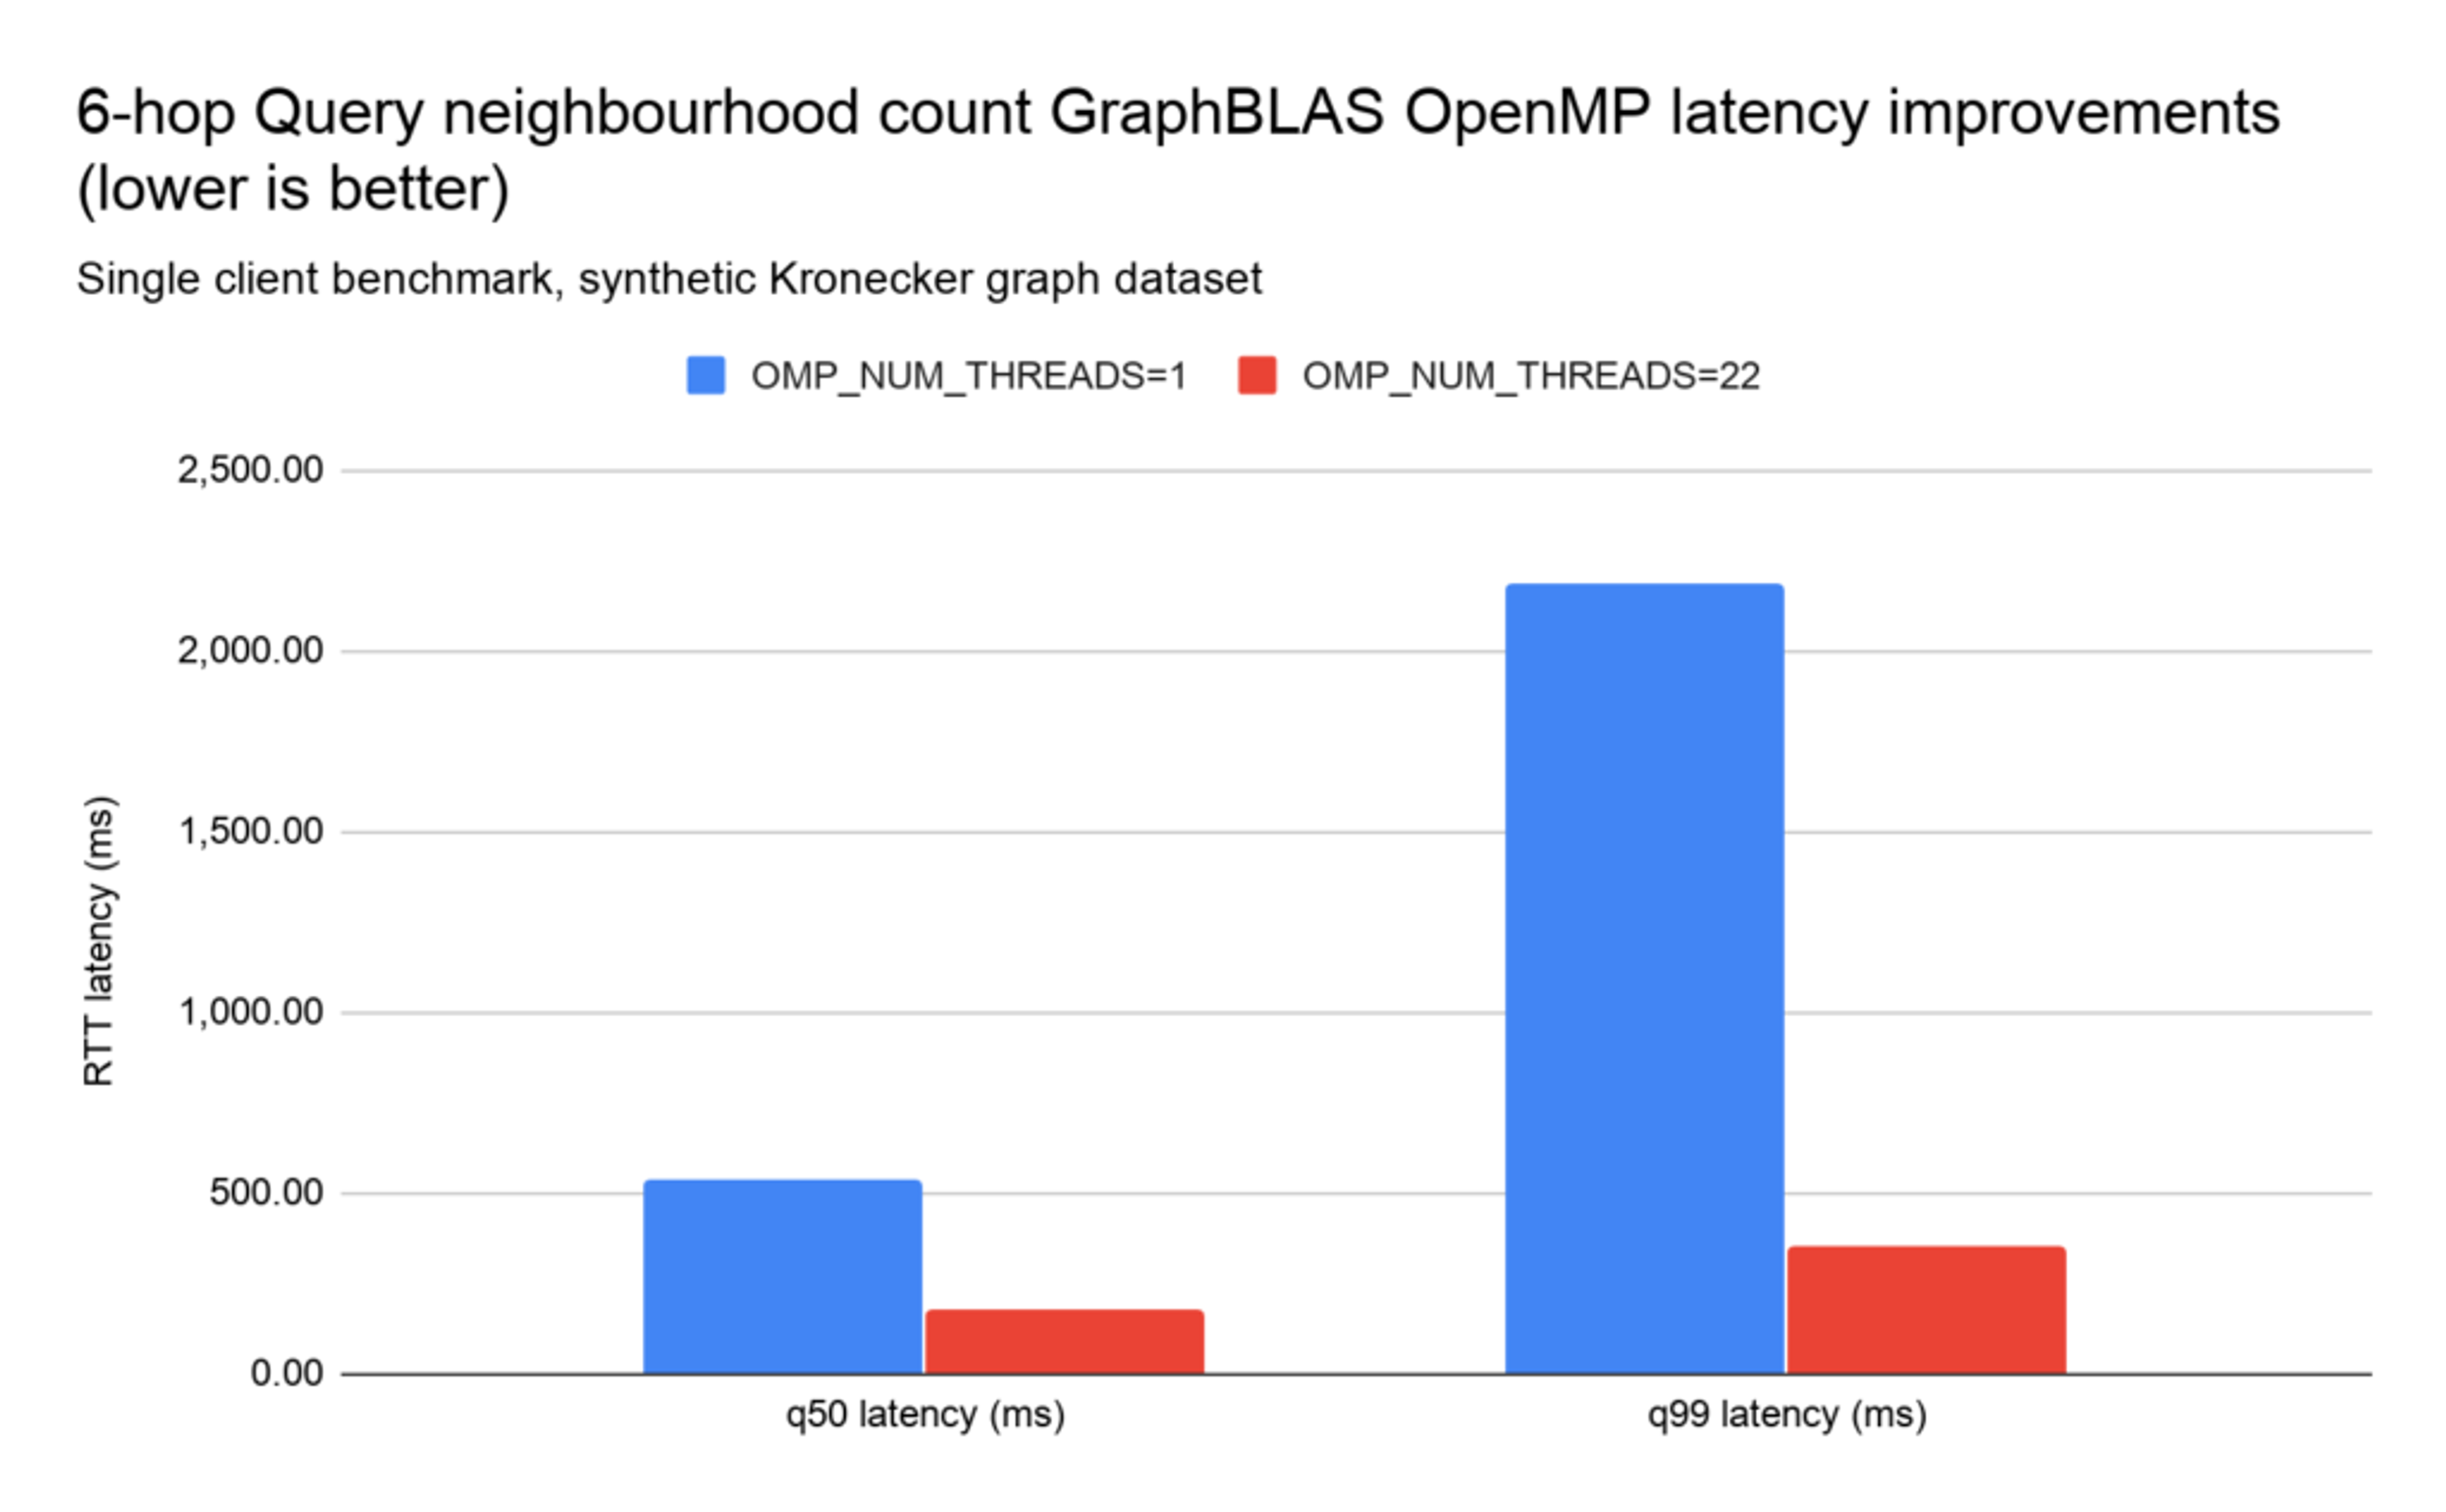
Internal testing on CPU intensive queries showed that RedisGraph spends around 75% of its total CPU time on SuiteSparse:GraphBLAS. To demonstrate the performance gains of SuiteSparse:GraphBLAS parallel OpenMP-based implementation in RedisGraph, we tested the 6-hop query neighborhood count due to it being computationally expensive.
As visible below, using a single-threaded SuiteSparse:GraphBLAS translated into q50 latencies of 537ms, and 175ms with 22 OpenMP threads, with latency reductions of up to 6x, at no extra cost for RedisGraph. The improvements are even more noticeable in the higher-latency spectrum (high-quantile values like q99):

Embracing LDBC
Because RedisGraph 2.0 supports many more Cypher features, we decided to start to embrace the Linked Data Benchmark Council (LDBC) benchmarks. LDBC has gathered strong industrial participation for its mission to standardize the evaluation of graph data management systems. In this section we wanted to give an update on the progress we’ve made.
The LDBC Social Network Benchmark (SNB) in the LDBC is a logical choice for RedisGraph since it enables complex read queries that touch a significant amount of data, have complex graph dependencies, and require the graph database to support complex and innovative query patterns and algorithms.
In the LDBC SNB benchmark, the nodes and edges distribution are guided by a degree-distribution function similar to the one found in Facebook. This benchmark accounts for an important aspect of simulating social networks, the fact that persons with similar interests and behaviors tend to be connected (known as the Homophily principle).
Concurrent with the SNB’s read queries is a write workload, which reproduces real-world social network scenarios such as adding a friendship among persons or liking and commenting on a post.
Currently from the LDBC SNB benchmark queries we support 100% of the write queries and 52% of the read queries, as seen in the following table:
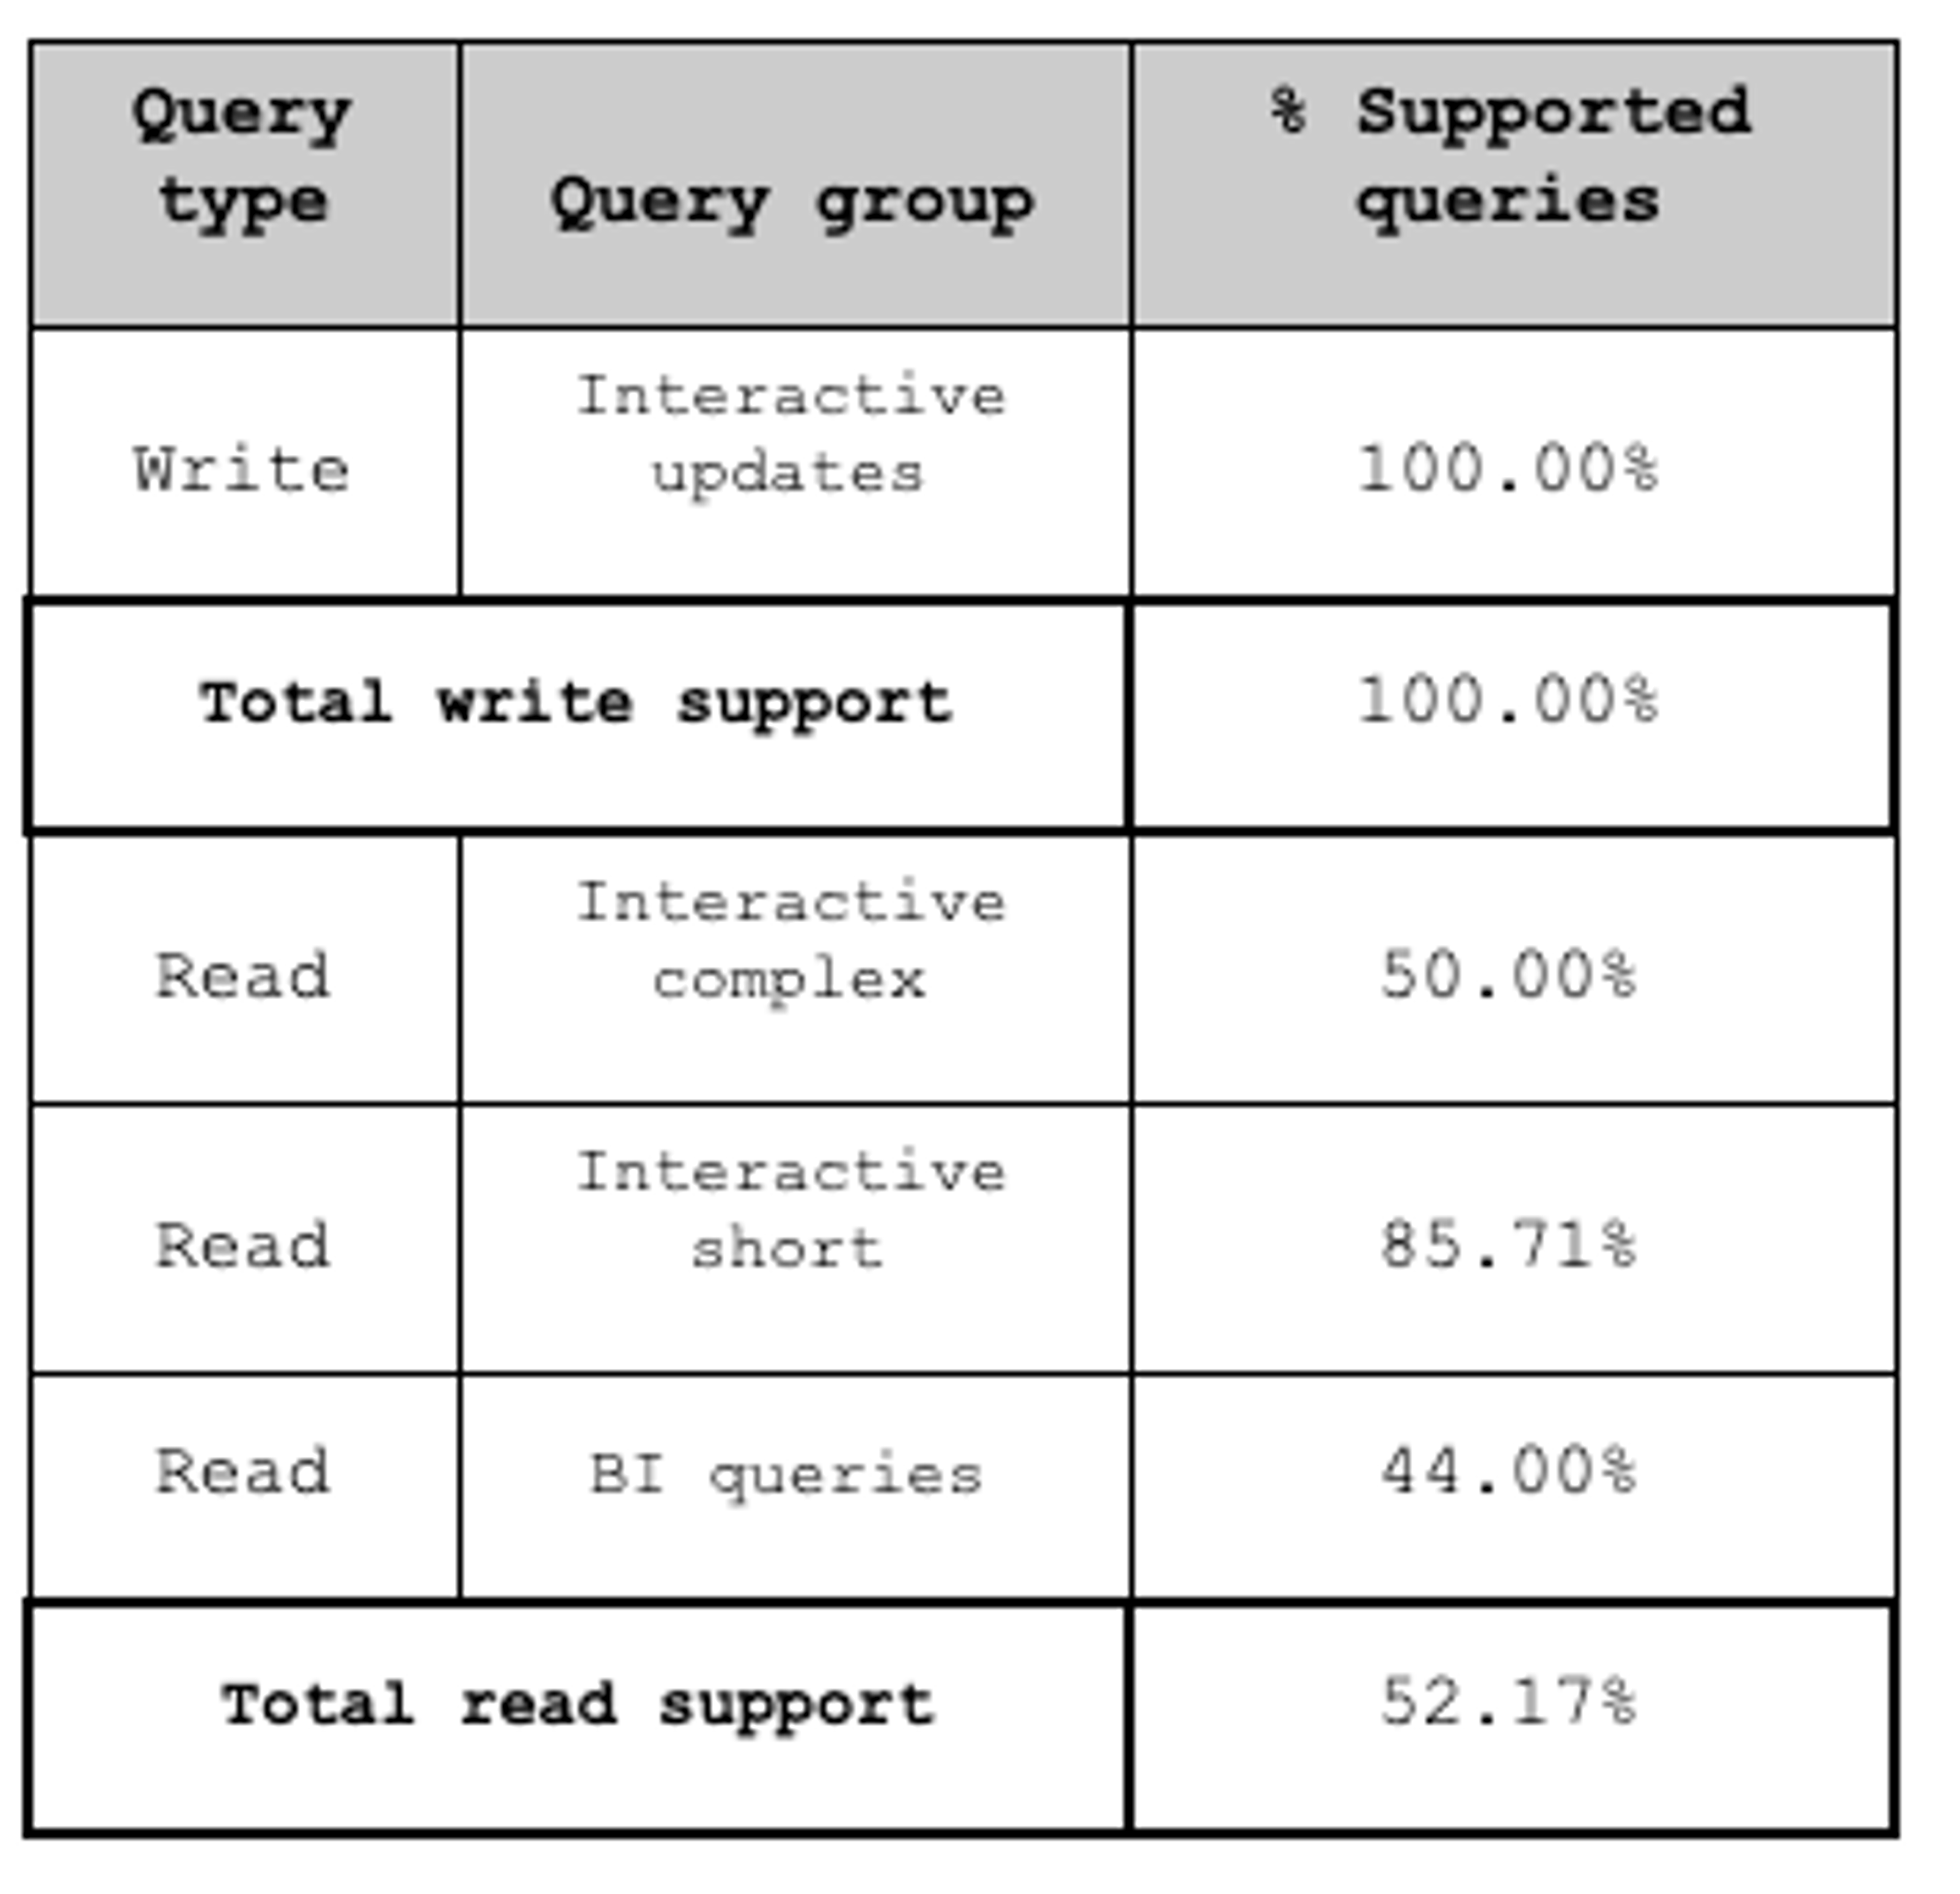
The soon-to-be-supported Cypher features: OPTIONAL MATCH (the equivalent of outer join in SQL), shortestPath (an implementation of the well-known Shortest path problem), and list and pattern comprehensions will enable us to support 100% of the SNB’s complex read queries.
Conclusion
RedisGraph 2.0 brings significant performance gains compared to version 1.2, which can lead to 6X faster queries. Not only did the sequential performance improve, RedisGraph is also able to exploit shared-memory parallelism with the inclusion of the latest versions of SuiteSparse:GraphBLAS, leading to even further performance gains.
In conjunction with the performance improvements, the work we did to increase the Cypher support gets us close to supporting the richer, community-driven LDBC benchmark, which we are excited to be part of and use to improve and harden our solution.
Get started with Redis today
Speak to a Redis expert and learn more about enterprise-grade Redis today.

