Blog
The Tech Behind Dynamic Email Marketing
E-mail marketing is an effective way to reach customers, but it comes with a variety of challenges that can be difficult to overcome. The nature of email is static after delivery: once the message has left your e-mail server, you have very little control — or do you? Let’s take a look at a technique that can provide some level of dynamic control after you send your e-mail.
Imagine you’re sending out an email with three deals. You’re not sure which deals will perform the best. After the email is sent, you’ll have a very clear picture — which had the best click-through-rate and frequency. Herd mentality is a very real thing in e-commerce. Telling a user that an item is “hot” or “popular” can give a sense of confidence in the item and we can communicate this via a “badge.” But to be effective, it should be real-time and not from a previous cycle.
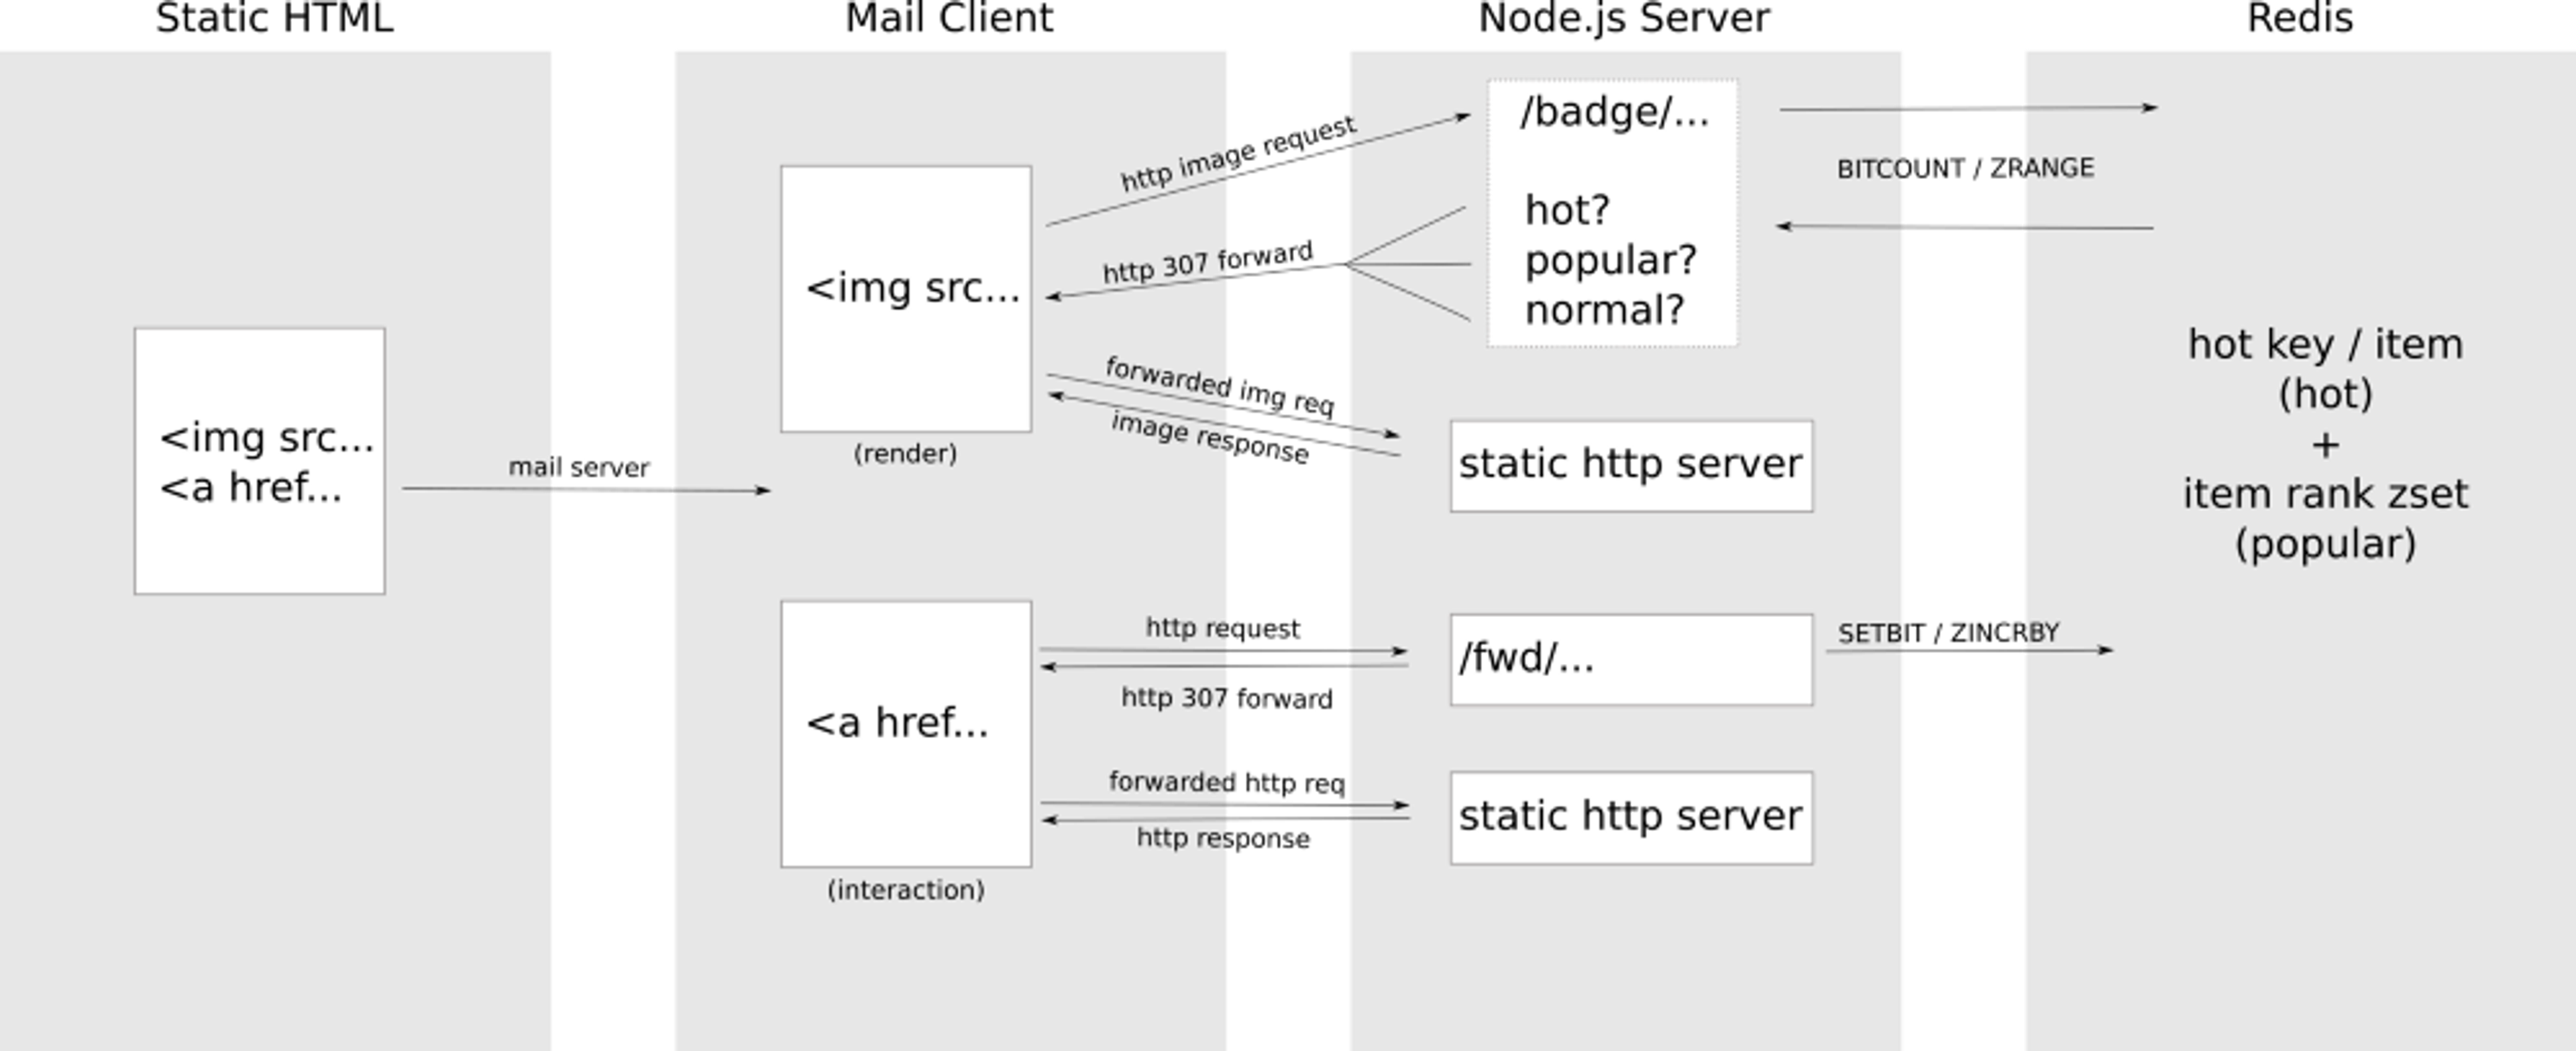
To achieve this, we’ll be using Redis and a Node.js server as well as whatever tool you would use to normally send out your emails. The heart of this technique is pointing both your badge image URL and item URL not at the actual image or web page, but at intermediate URLs.
The intermediate badge URL calculates the “hotness” and the popularity of the item with data from Redis then sends an HTTP 307 forward request back to the email client. The forward is pointed at the correct badge image — one for hot, one for popular and a special empty/transparent image for items that are not hot nor popular.
The item intermediate URL is a little simpler — this URL records that a visit occurred at a specific time and increments a counter for number of click-throughs. Once complete, it always forwards onto the same destination URL.
Here is a diagram of the whole process:

It’s less complicated than it looks.
How we’re going to calculate hotness
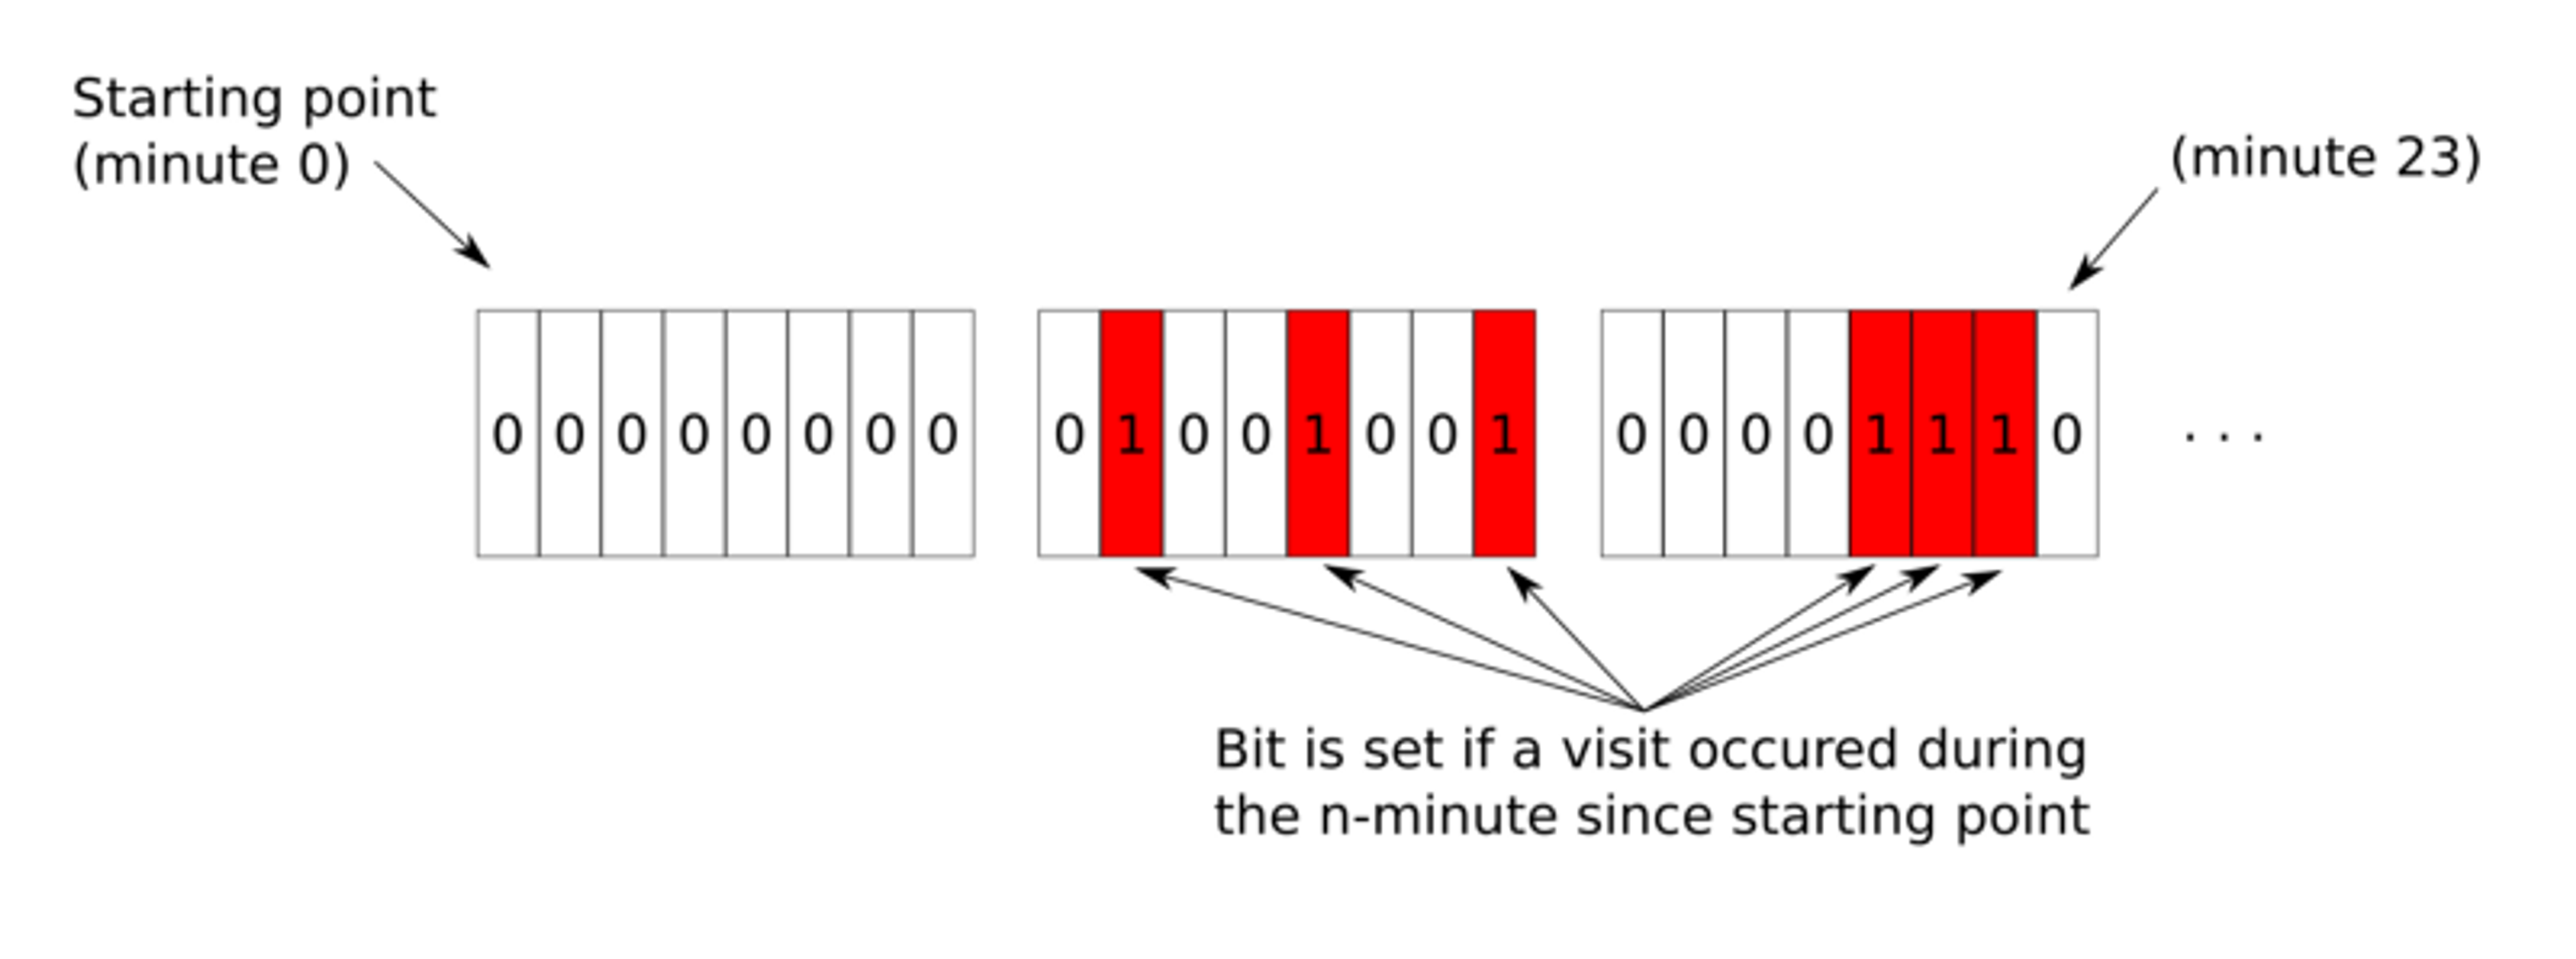
For the purpose of this script, an item is considered “hot” if it has been accessed several times in the past few minutes. To determine the “hotness” were counting minutes and counting bits.
Redis is able to flip individual bits in a string and we can exploit this feature to be extremely granular in a minimal amount of storage space.
Each “item” is represented by a string in Redis with a key derived from both the campaign and some form of item identifier. We’ll make the key look something like this:
We need to start counting from a fix point in time — much like the UNIX epoch time system, we’ll just use some point. For this simple example, we’ll just pick July 1, 2017 at midnight (GMT) — the countEpoch. We’ll compare this with the current timestamp using the date-utils Node.js module.
As an example, at 1am on July 1, 2017, the minutesSinceEpoch would be 59 (not 60, because of zero-based counting). We’ll flip a single bit each time a person interacts with an item. Note that if two users interact with the same item during the same minute period, it is only counted once — we’re getting the activity rather than the count in this case. This is very space efficient and provides some very rich data with a minimal storage footprint. Each day from the countEpoch would consume 180-bytes, ~5.4kb a month or ~65kb per year. Not bad.

To flip the bits, we can use the Redis function SETBIT with the offset being the minutesSinceEpoch and the value being a 1, representing a visit. Give the example above (1am on July 1), our Redis command would look like this:
SETBIT is a computationally inexpensive command, being O(1) and otherwise on the app-level we just need to do a little subtraction to get the minutesSinceEpoch.
Querying the “hotness” bits requires a little more work. We can use the Redis command BITCOUNT. With this command we can find the number of 1’s set a given string. While this would be useful on it’s own, we want to add in a recency- for our application it’s irrelevant to determine that the item was being interacted with 2 months ago — we need to find just the recent activity. With BITCOUNT we can supply the optional start and end arguments to slice out only a little bit of the data. The start and end arguments also “wrap” with negative numbers, so you can only the count the bits at the end of the data. In our example, let’s work with the last three bytes:
While this command sets bits, it’s important to understand that Redis only deals with bytes in the range arguments of BITCOUNT. This introduces some sloppiness into the calculation: Think about if you set the 17th byte in the example below:
Running the above command would count five 1 bits of the last 3 bytes, which is not perfectly 24 minutes as 3 bytes might lead you to think. So, we’re actually saying that 5 of the last 16–24 minutes were active. In our use-case, we’re really just trying to get some relative sense of hotness not an absolute so it’s acceptable given the space/time efficiencies.
Calculating Popularity
In our use case, we’re going to find the item with the most number of click throughs regardless of time. This is a straightforward process in Redis. The sorted set data structure excels at creating leaderboards — our popularity is calculated by finding the top item among all those in the group.
To record the popularity, we just need to increment the score of an item in a ZSET every time it is clicked on. We can make this happen by using the ZINCRBY command. Their is a single key for the entire campaign and the member is the item ID. We want to increment it by one. In Redis, we’d do something like this:
To be clear, the score is just acting as a counter. So, if the camera item in the august17 campaign was clicked 47 times, 46 on day one and once more on day 400, the score would be 47.
For each badge, we’ll check to see if the related itemId is the most popular one. We can do this by running:
If the response of this matches the itemId then the item is the most popular.
Performance Concerns
As you might have noticed from the process diagram, this produces a very “chatty” system with several moving parts. HTTP forwards add an extra network round trip and additional transit time. It’s critical to minimize the amount of time spent both recording and calculating the popularity. Redis is well known for being low latency and quick to calculate values.
The dynamics of this type of email being delivered to a large list of clients at one time also presents challenges. Let’s say your email is delivered to 500,000 recipients in a short amount of time and they start interacting with and view the email simultaneously. With a single instance of Redis, you may be able to weather the storm, but the single-threaded nature of the server could create higher than desired latencies under load. In addition, we’re creating a single point of failure that is risky. A good match for this use-case would be Redis Enterprise. Redis Enterprise can provide high-availability with automatic failover to ensure that your email assets have no single point of failure and it also can provide clustering that can spread the load out over multiple threads and/or machines reducing latency.
Next steps and other uses
Beyond these other use cases, the data can be leveraged in other ways. The “hotness” data is a bitmap that can be calculated to see how many hours of activity a given item has over a given range of time using BITCOUNT with offsets based on the calculated minutes. You can also aggregate the activity of multiple items using BITOP:
Then you can slice out a given time period of camera-and-watch to determine the hotness for a timeframe.
The technique of shimming Node and Redis between your interaction points and assets is not limited to serving out email images but can be integrated into any platform to dynamically change the images as data changes. In it’s current state, it could be applied to a e-commerce system with very little modification to deliver the same “badging” information. Integrating with other data could vary the resulting badge based on more than just “hotness” and popularity but also variables like item stock (“Almost Gone!”) or discounts (“Save 20%”). In addition, paired with a user system it could be good for personalized deals (“Reorder” or “Our Pick for You”). Imagine even integrating customer location conditions (“Beat the Heat” on an air conditioner if the customer’s location is warm).
The source code can be found on Github.
(This post originally appeared in the Node / Redis series on Medium)
Get started with Redis today
Speak to a Redis expert and learn more about enterprise-grade Redis today.
