Blog
How to Manage Real-Time IoT Sensor Data in Redis
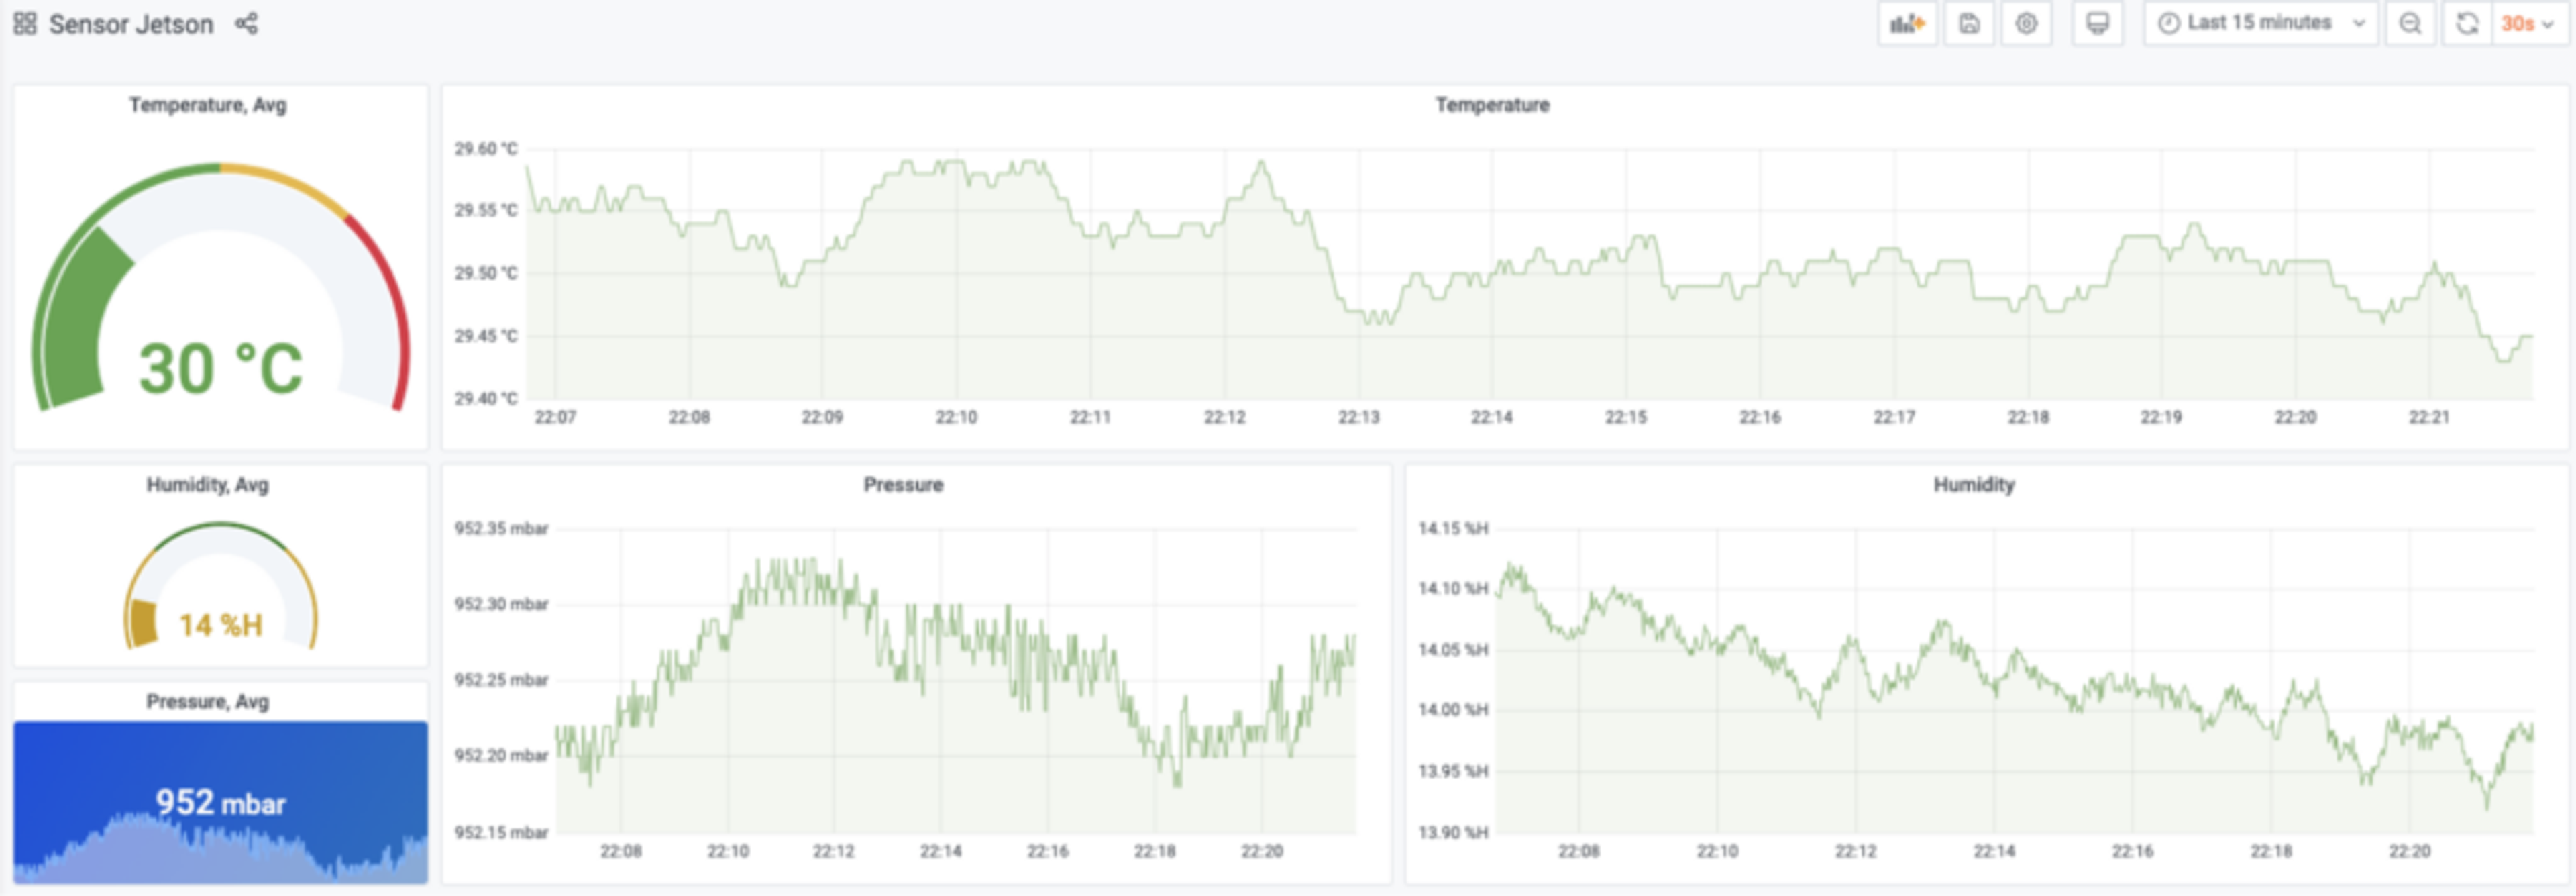
Imagine you’re an air-conditioner manufacturing company that sells millions of smart AC units to consumers. You are building a centralized, smart climate control system that collects sensor data about a house’s temperature, pressure, and humidity and sends it to a central location for an efficiency analysis to help end users trim their electricity bills.
This blog post will show a simplified version of such a use case to demonstrate how it all works—so you can understand how to manage a wide variety of real-time IoT sensor data in Redis.
Here’s what we used:
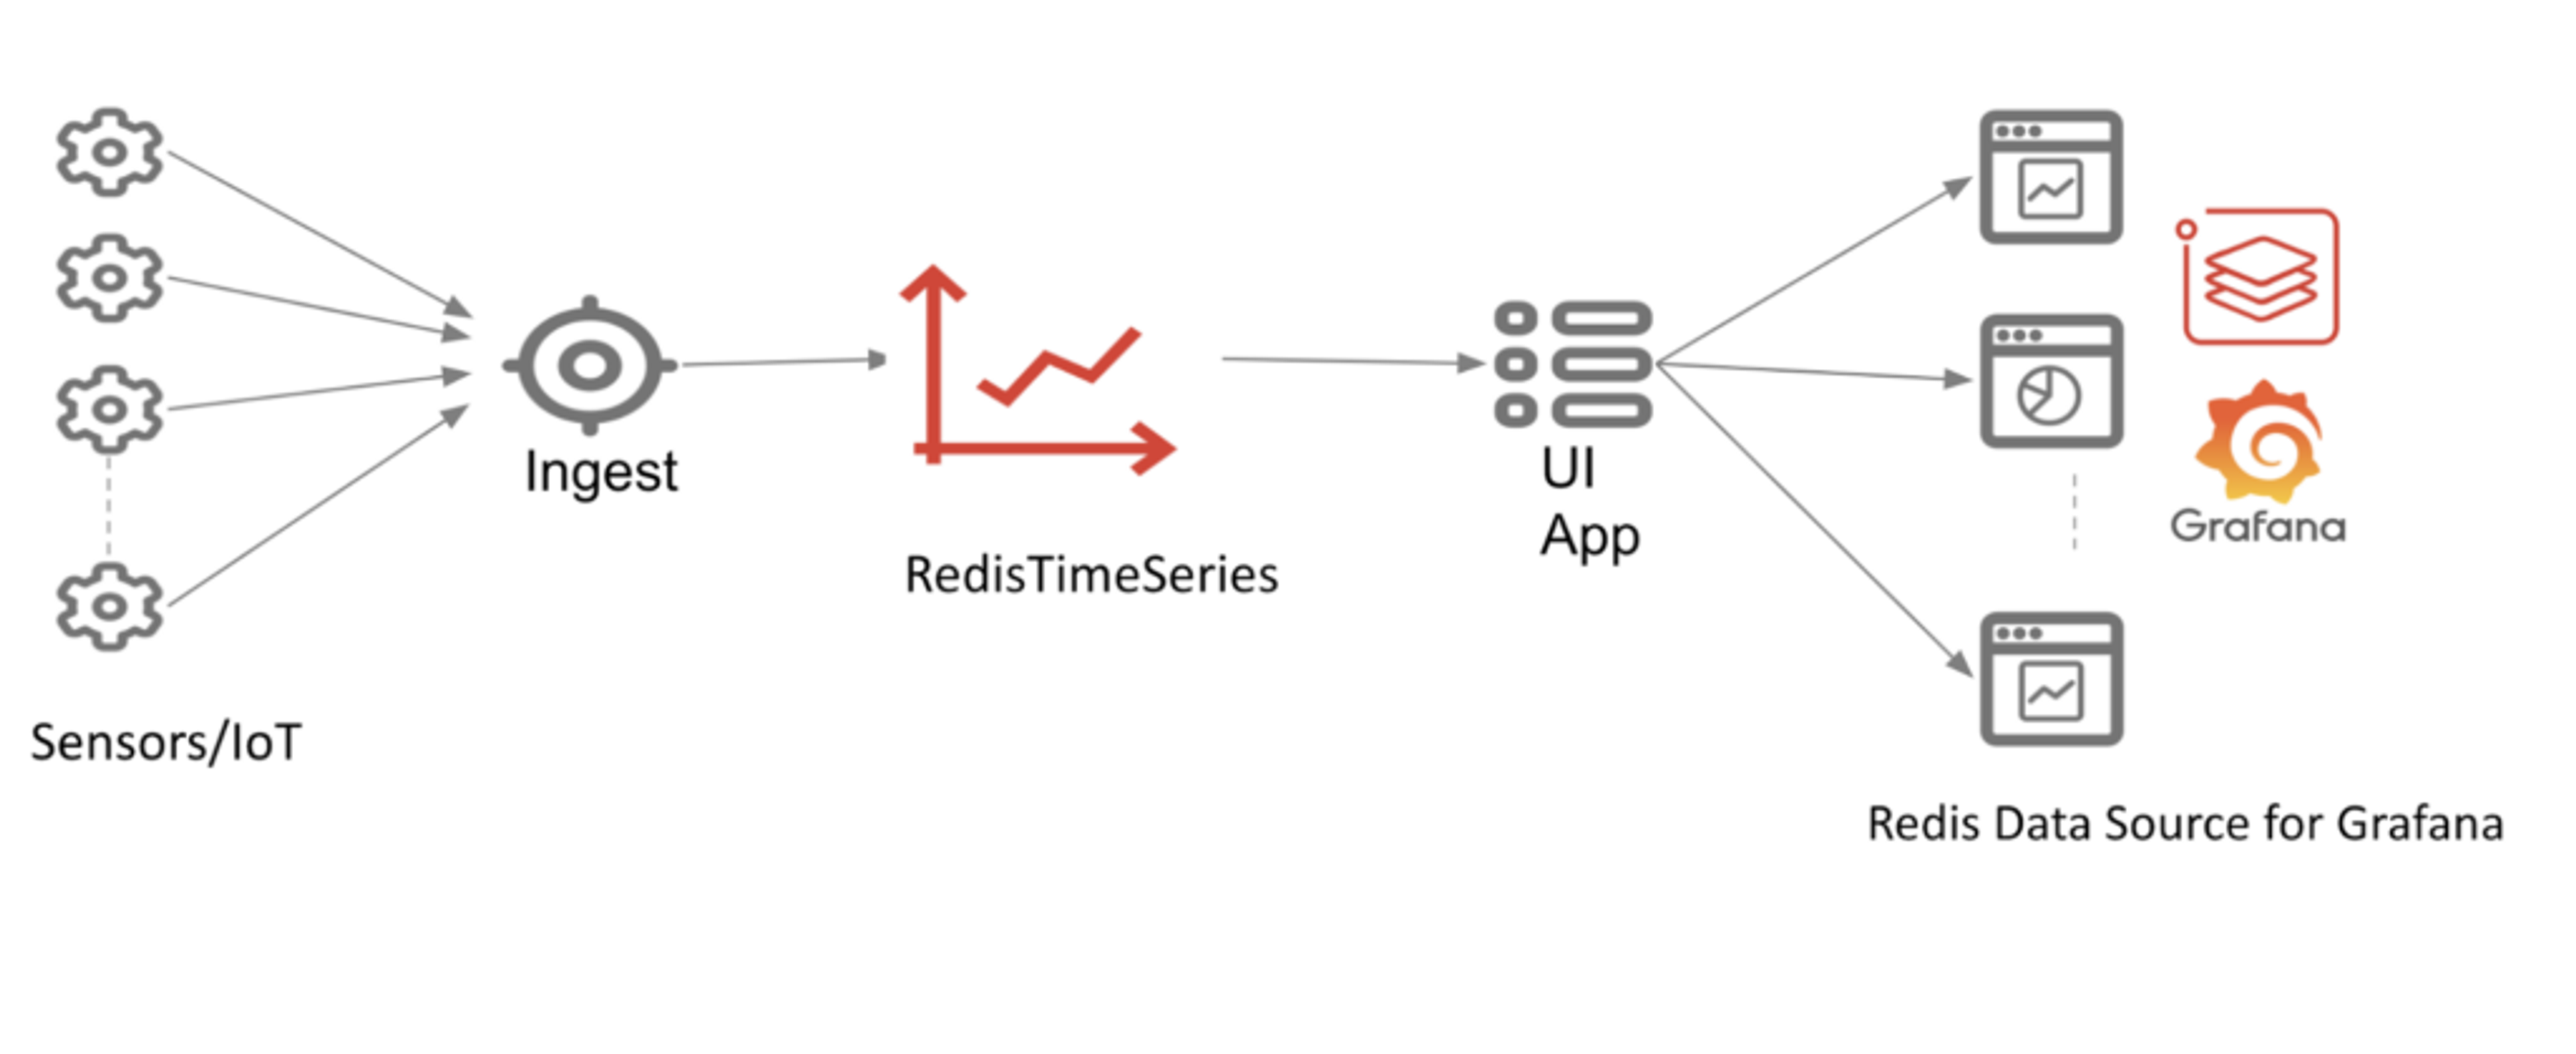
- ABME680 environmental sensor to simulate a smart air conditioner and send data to Redis
- TheRedisTimeSeries module to add time-series capabilities to Redis and store the data in time-series format
- Grafana with Redis Data Source to create graphs for usage analysis
Hardware requirements:
- Jetson Nano: 2GB Model ($59)
- A 5V 4Amp charger
- 128GB SD card
- BME680 sensors
Software requirements:
- Jetson SD card image from NVIDIA
- Etcher software installed on your system
Preparing Your Jetson Nano for OS Installation
- Unzip the SD card image downloaded from https://developer.nvidia.com/embedded/downloads.
- Insert the SD card into your system.
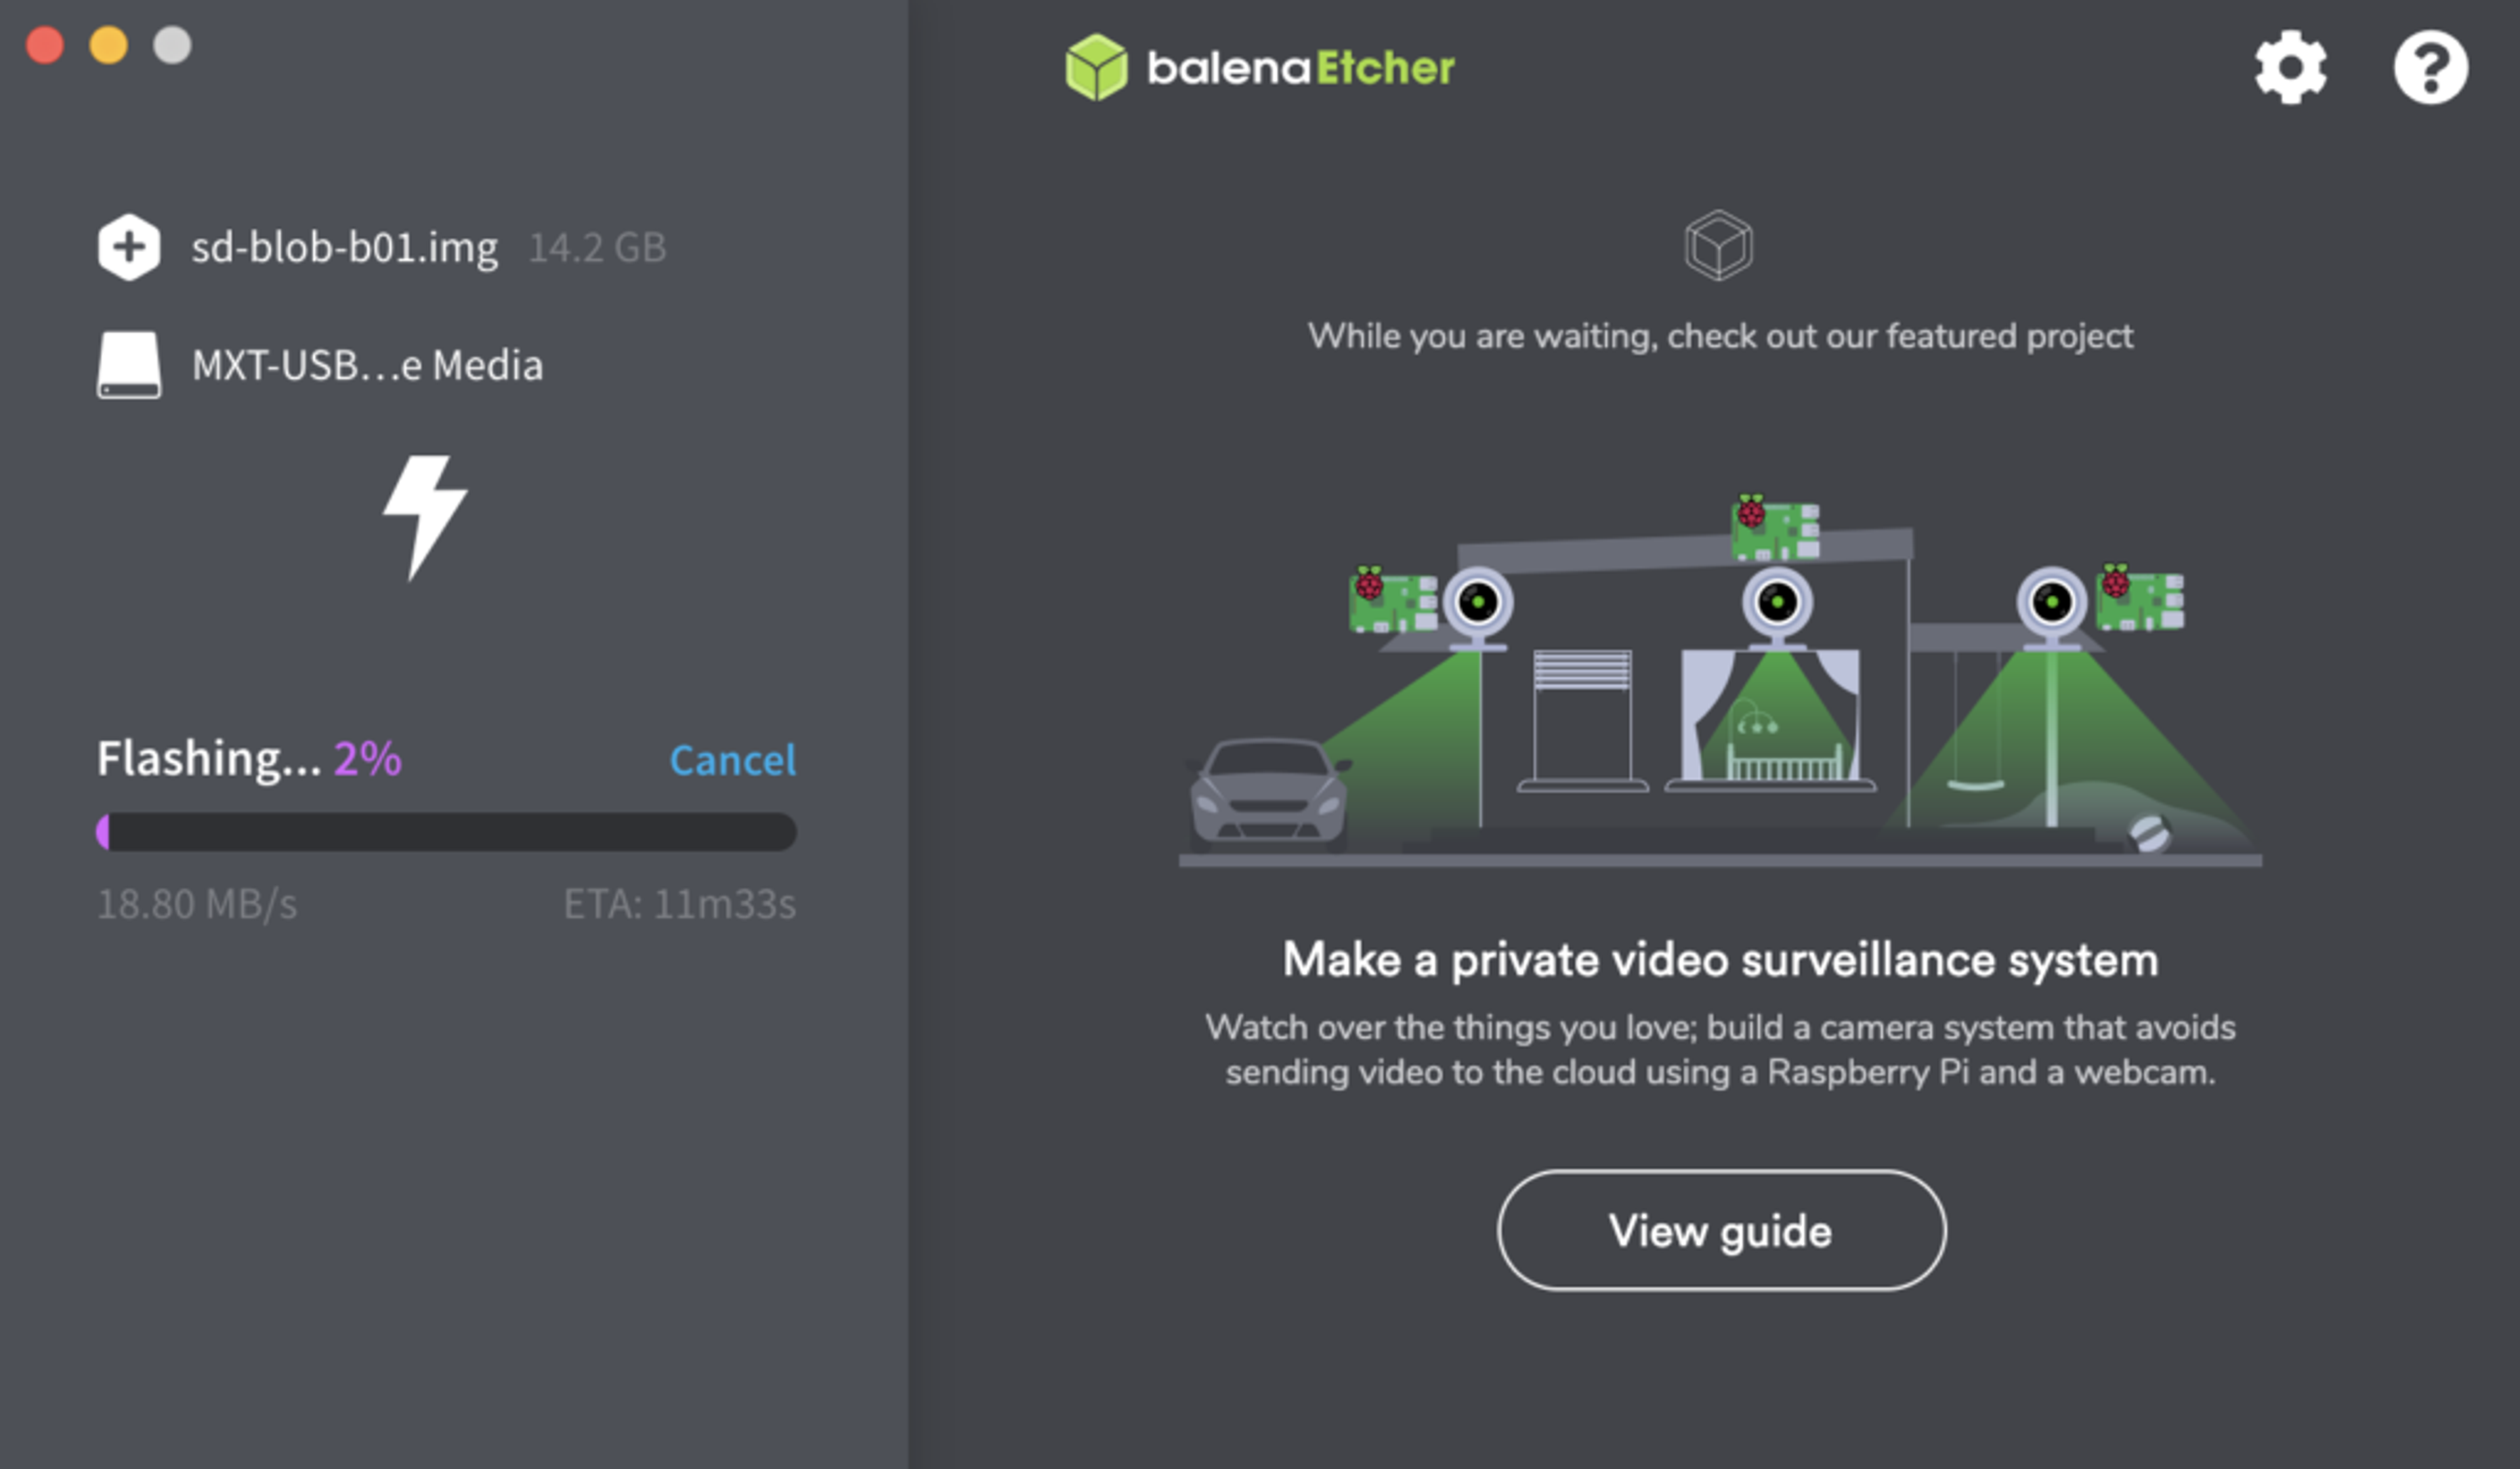
- Bring up the Etcher tool and select the target SD card to which you want to flash the image.
Follow this 10-step process to see how it all fits together:
Step 1: Get your sensors
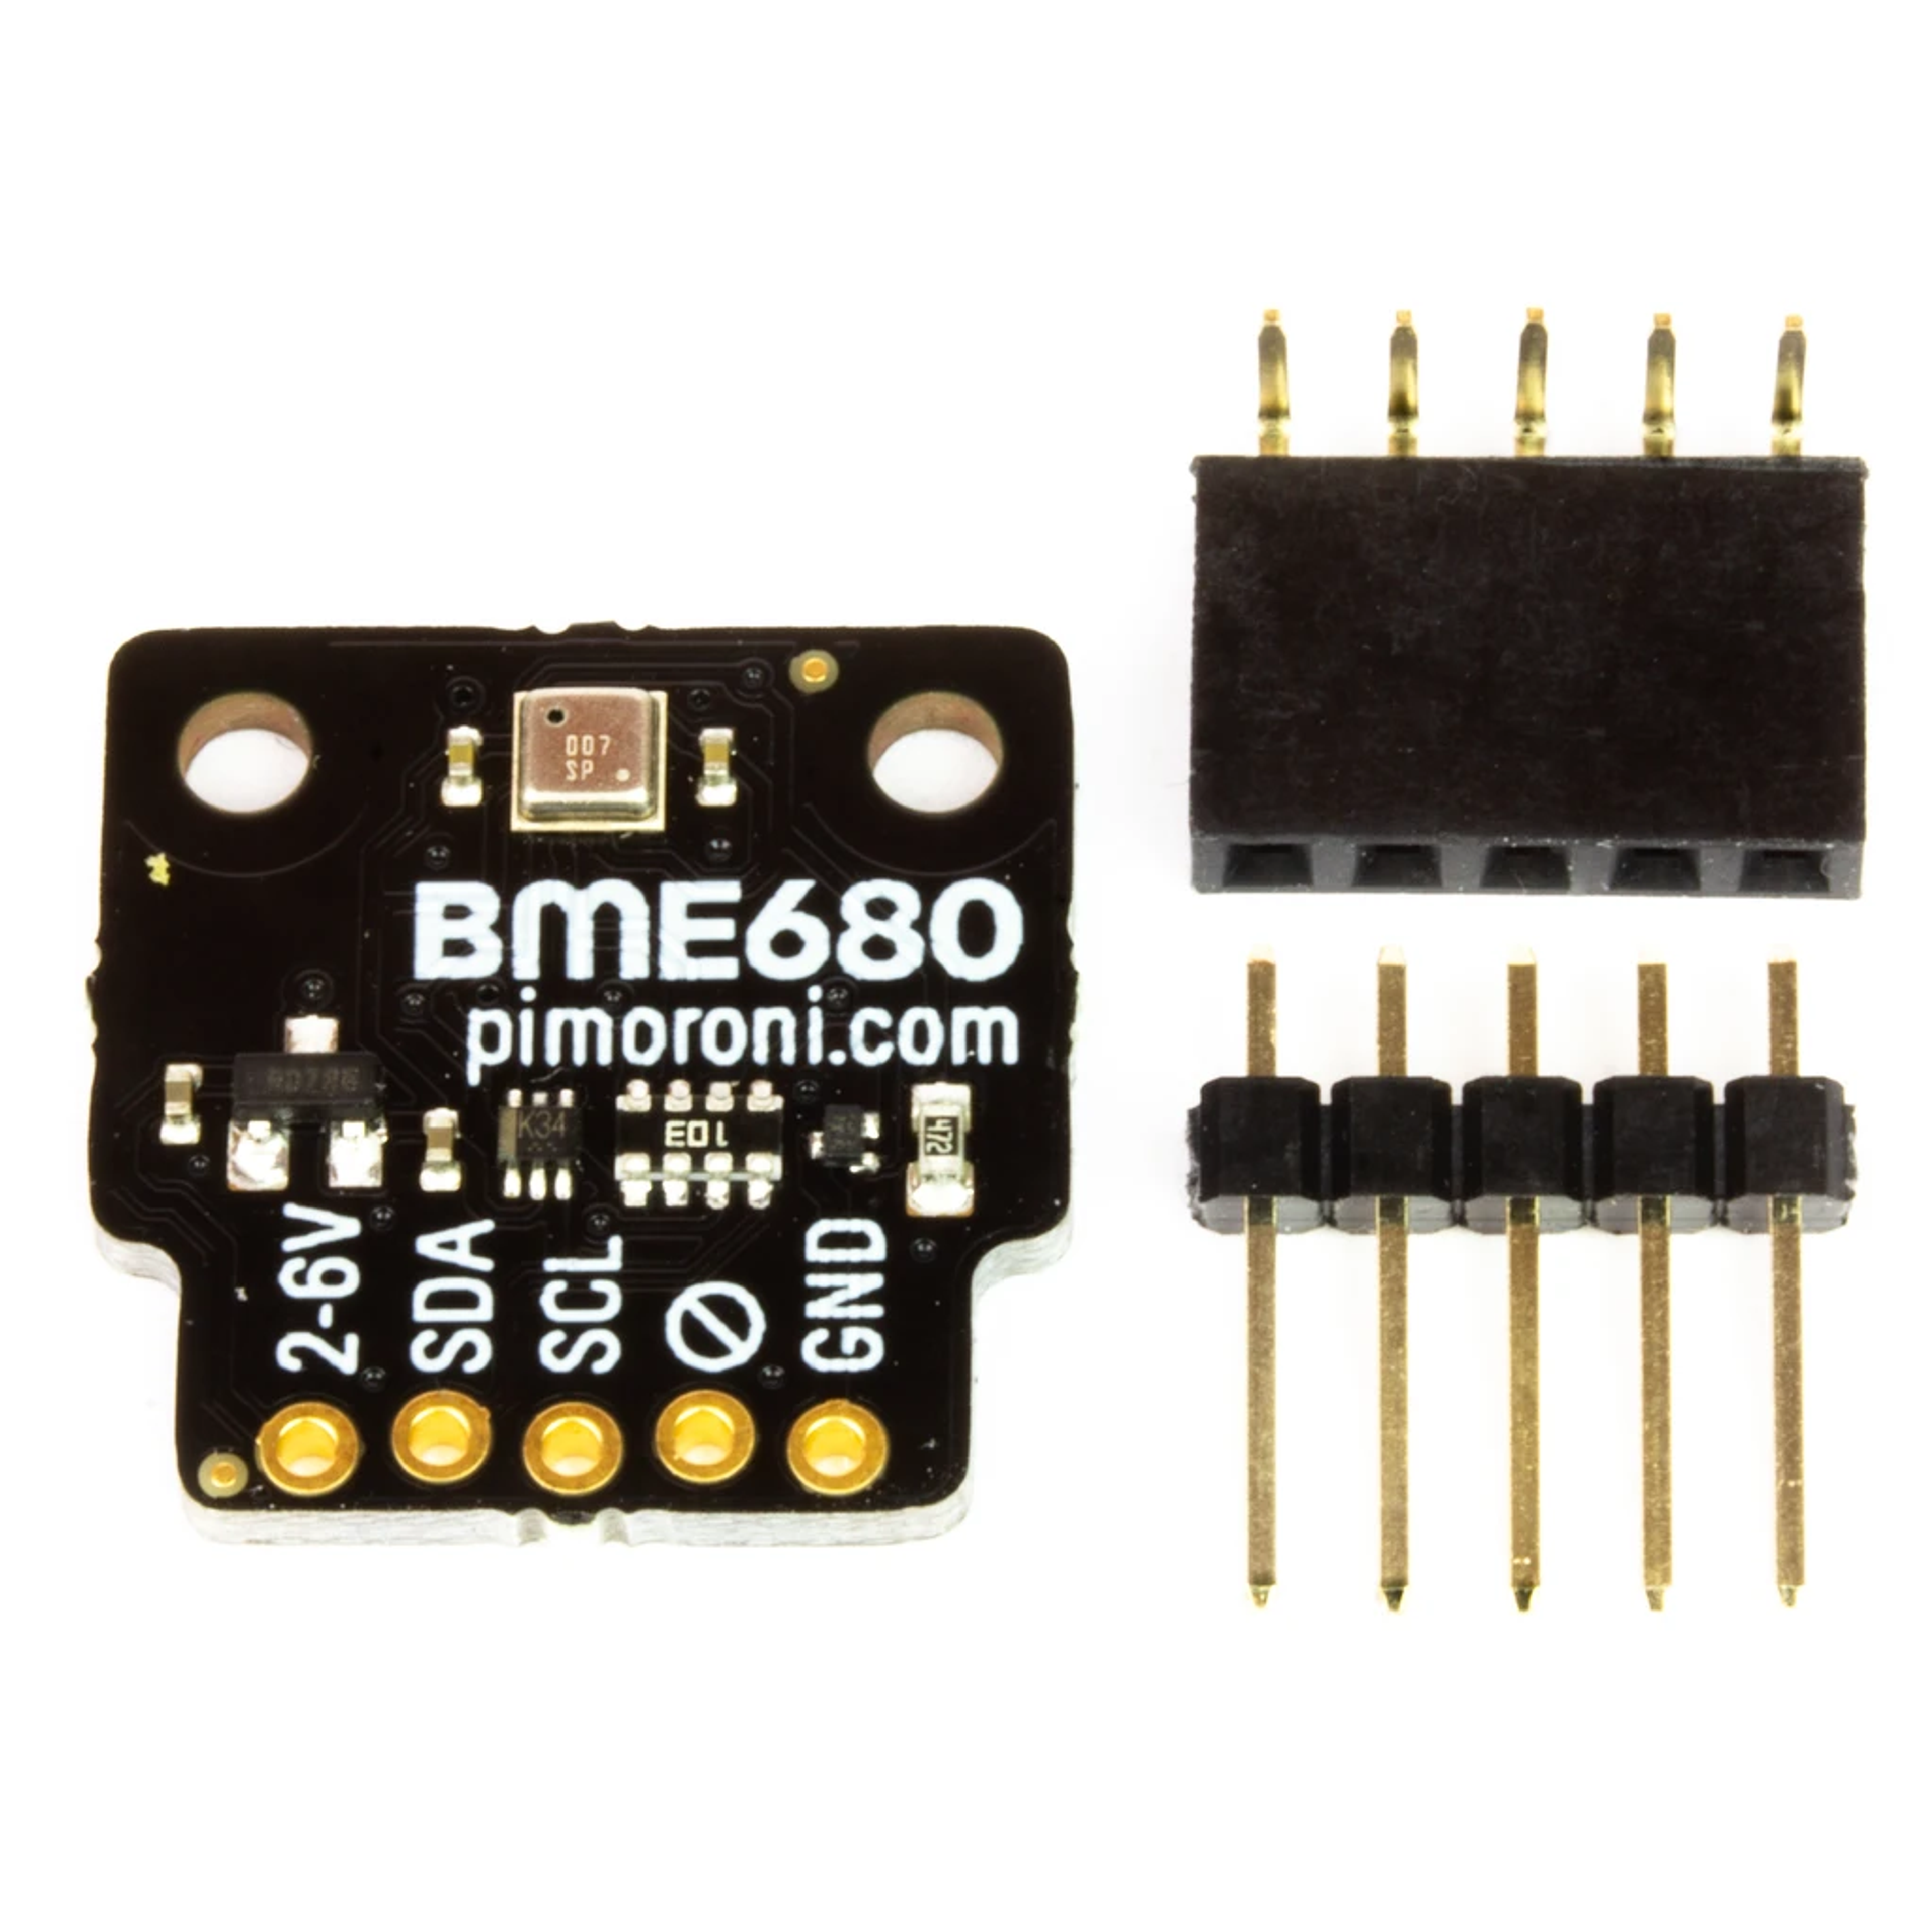
There’s a huge variety of sensors on the market, but this demonstration uses a Pimoroni BME680 breakout board. BME680 is an integrated environmental sensor developed for mobile applications and wearables, where size and low power consumption are key requirements. It can measure temperature, pressure, humidity, and indoor air quality, and is Raspberry Pi and Arduino-compatible.
Step 2: Set up your IoT board
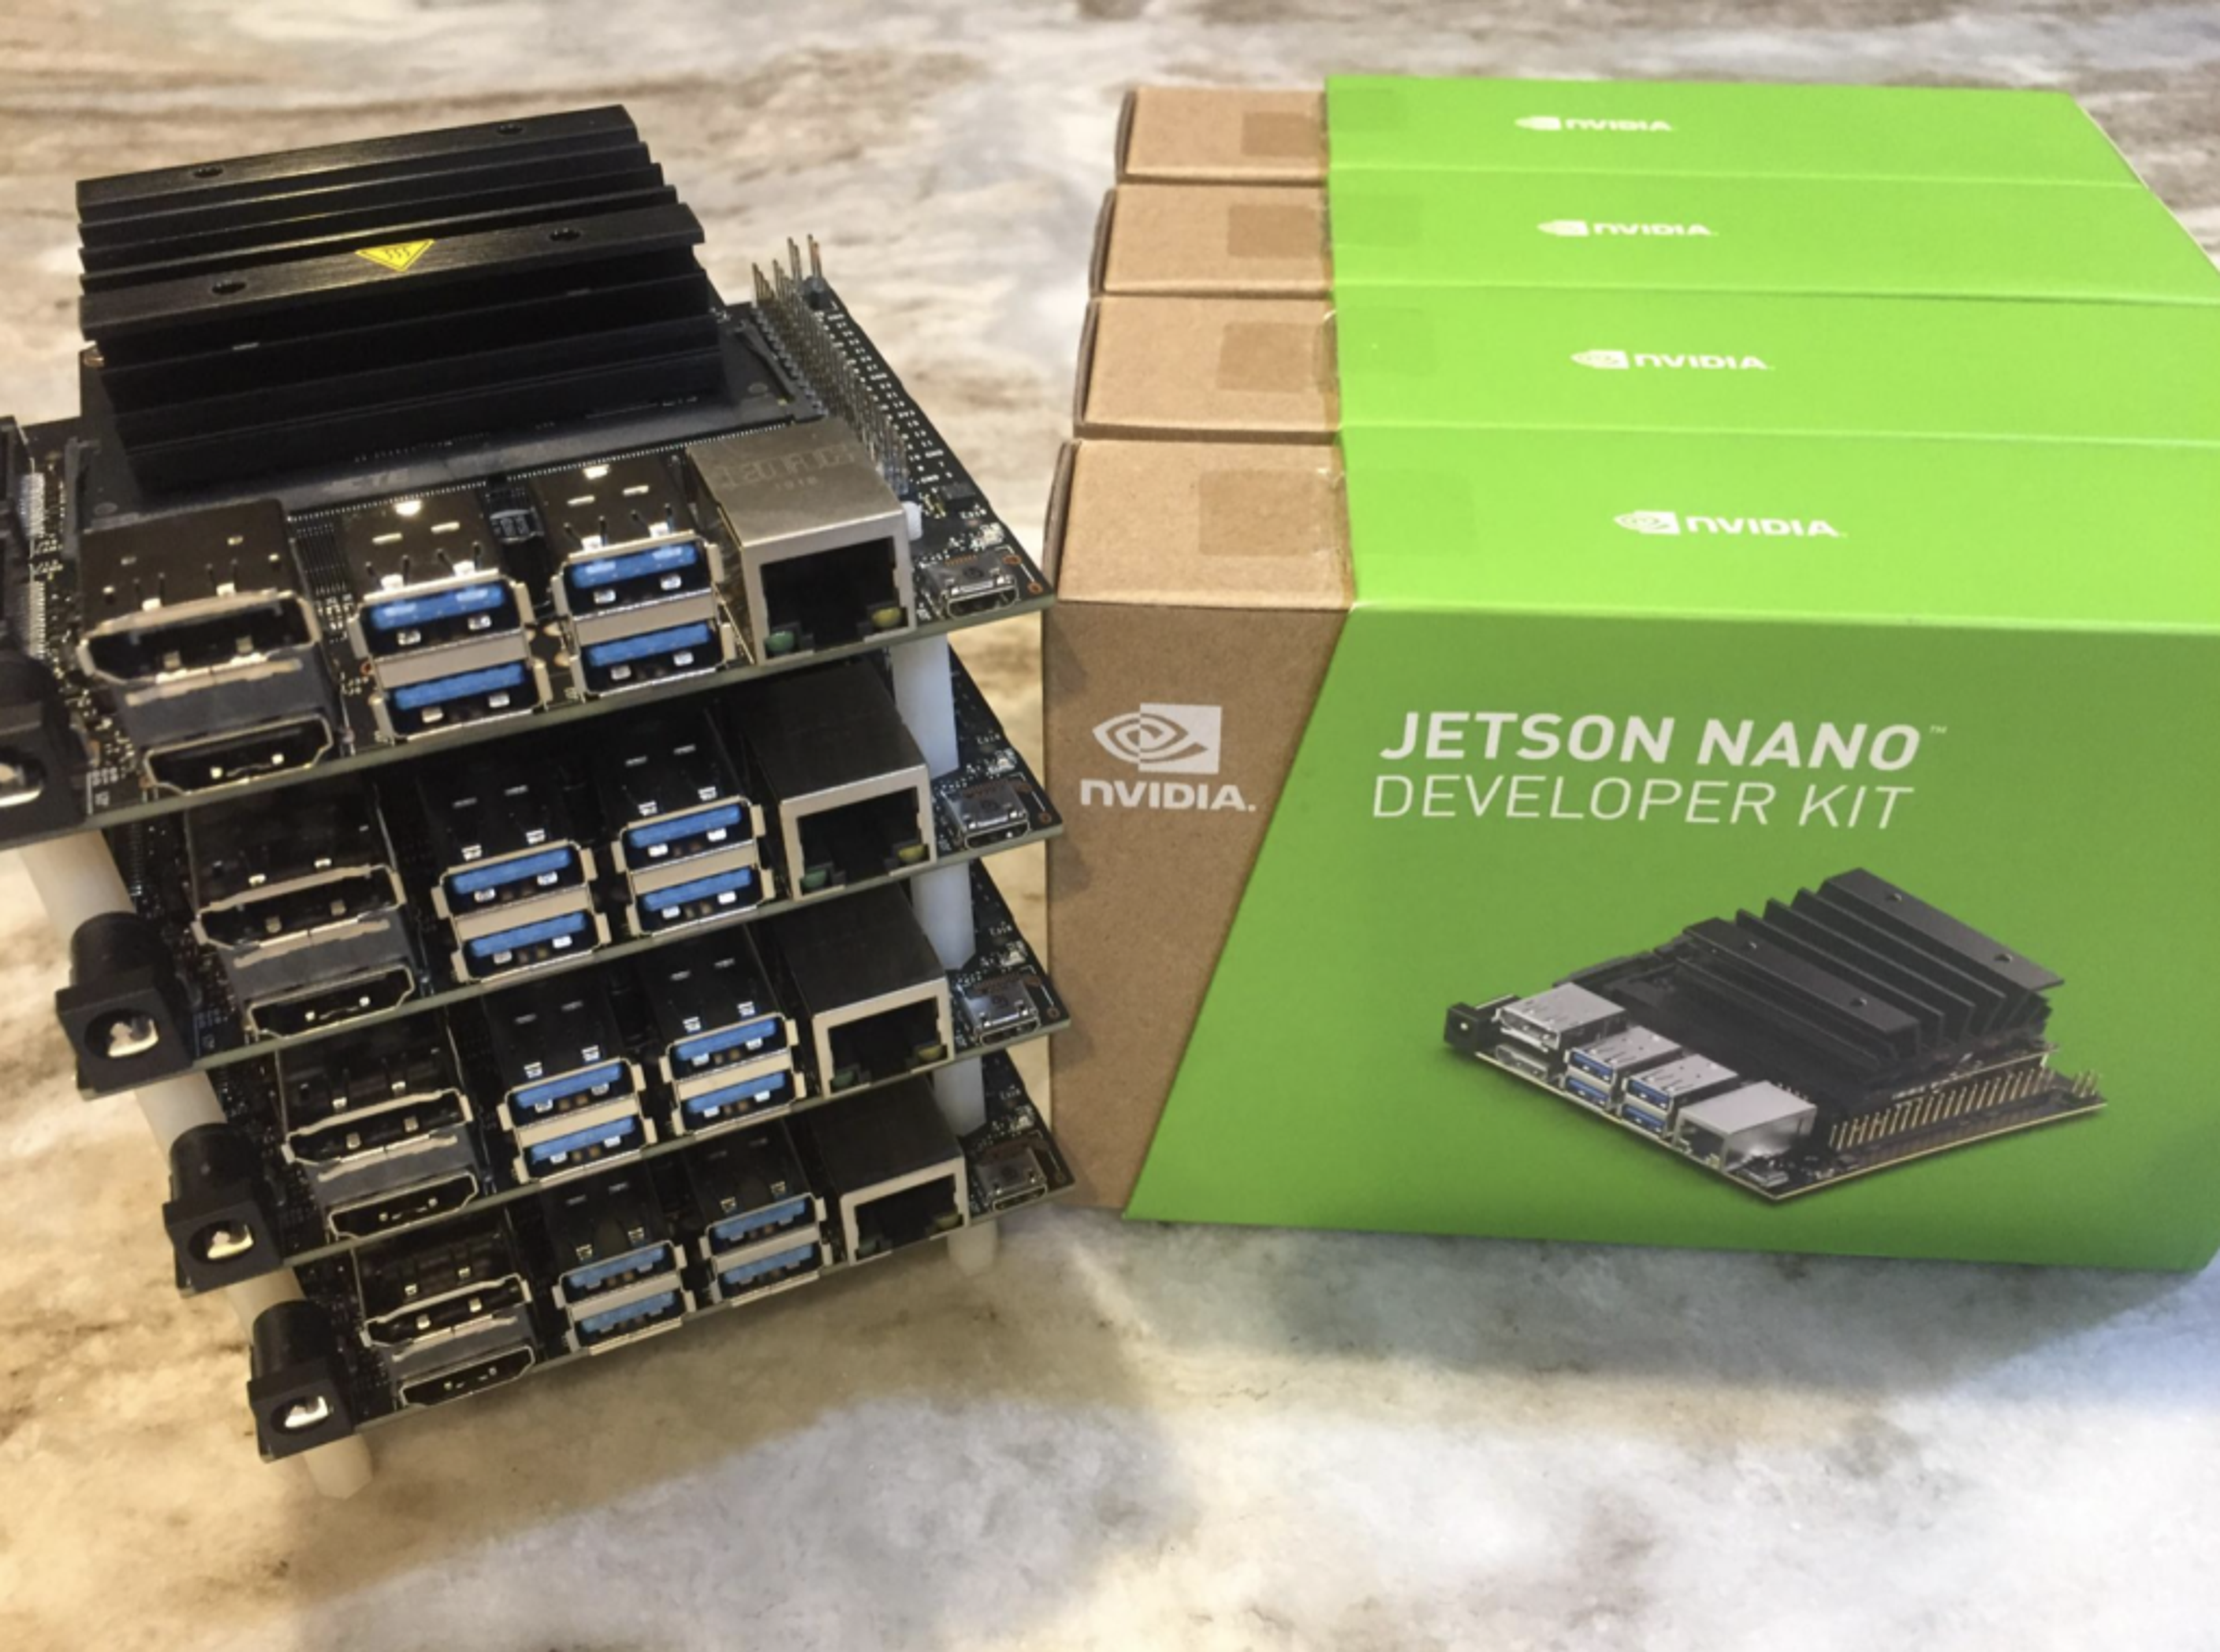
For this demonstration, we’re using an NVIDIA Jetson Nano board, a small, powerful computer for developers to learn, explore, and build AI applications for edge devices. Priced at $59, it’s basically a developer kit that includes a Jetson Nano module with 2GB memory and delivers 472 GFLOPS of compute power. This demonstration should also work with other popular IoT devices, such as the Raspberry Pi, Arduino, Banana Pi, etc.
Step 3: Wire it up
The BME680 plugs directly into a Jetson Nano board without any connecting wires.
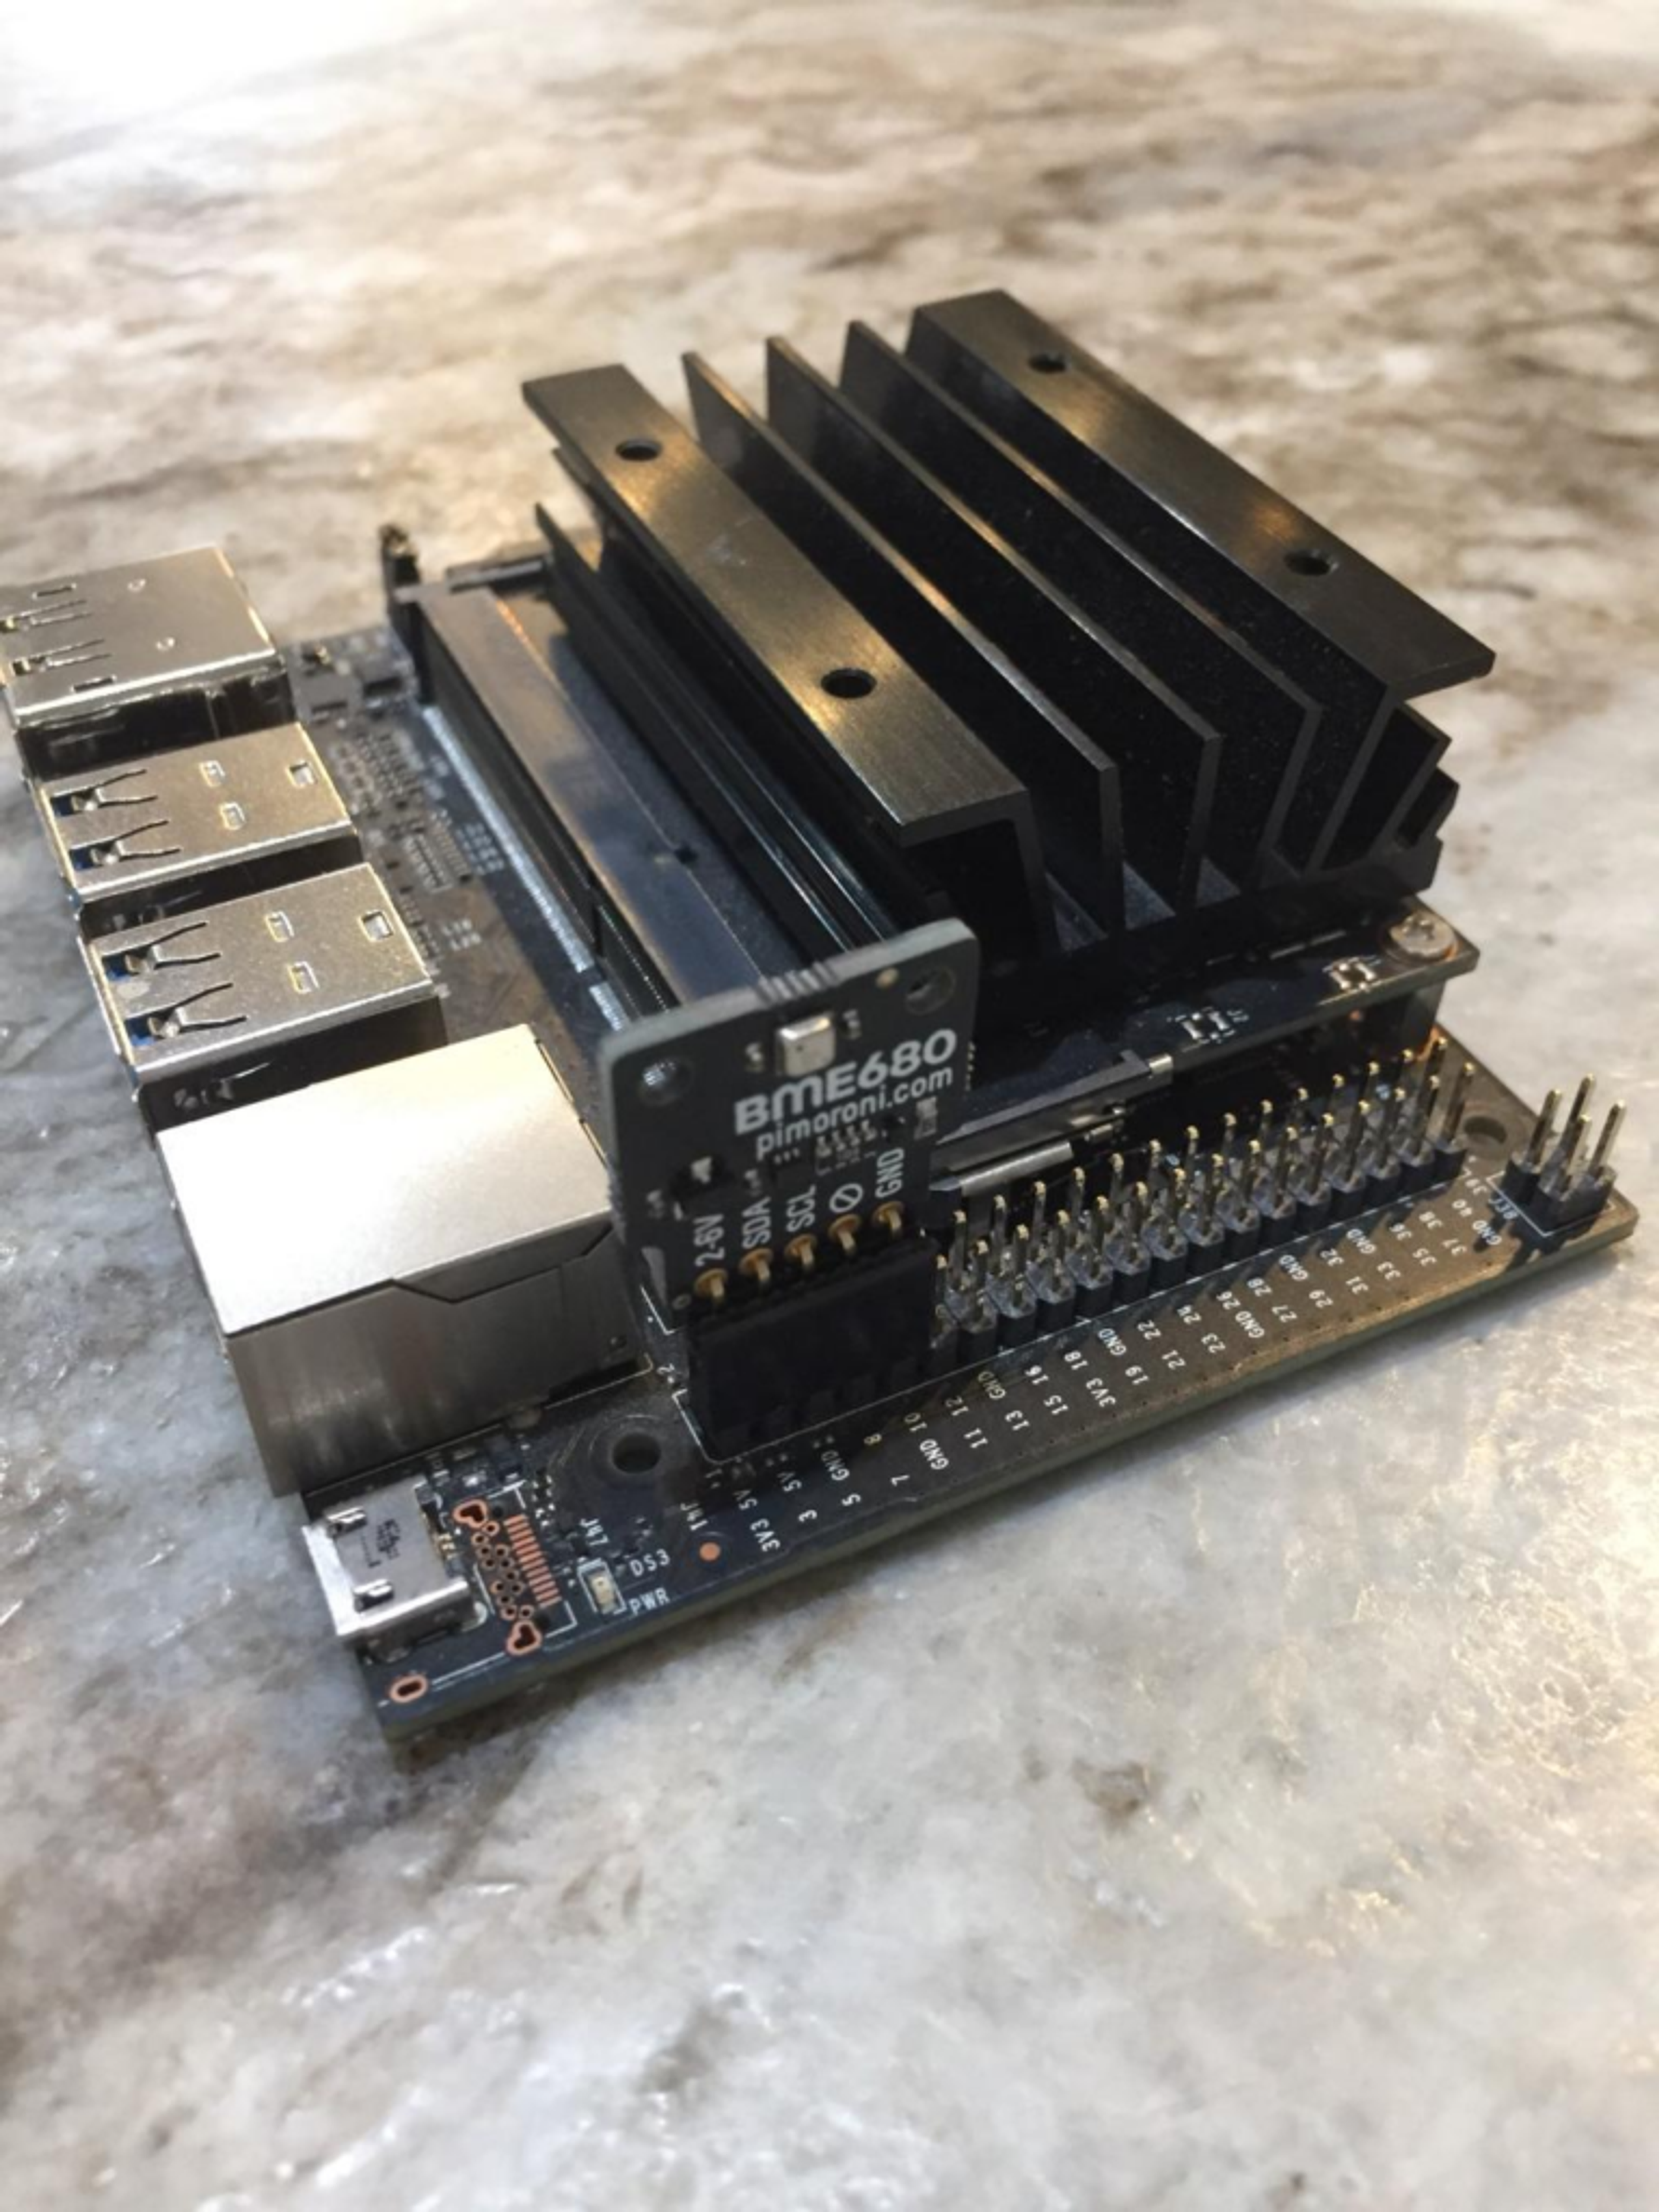
Step 4: Get your sensor working
After wiring the sensors, we recommend running I2C detection with i2cdetect to verify that you see the device: in our case it shows 76. Please note that the sensor communicates with a microcontroller using I2C or SPI communication protocols.
Step 5: Get ready to Redis
You will need a Redis server up and running, either on your local laptop or in the cloud, and the Redis server must be compiled with the RedisTimeSeries module. In this demonstration, we’re using Redis Enterprise Cloud, a fully managed cloud database service that comes with the RedisTimeSeries module already built in and integrated.
Step 6: Set up Redis Enterprise Cloud
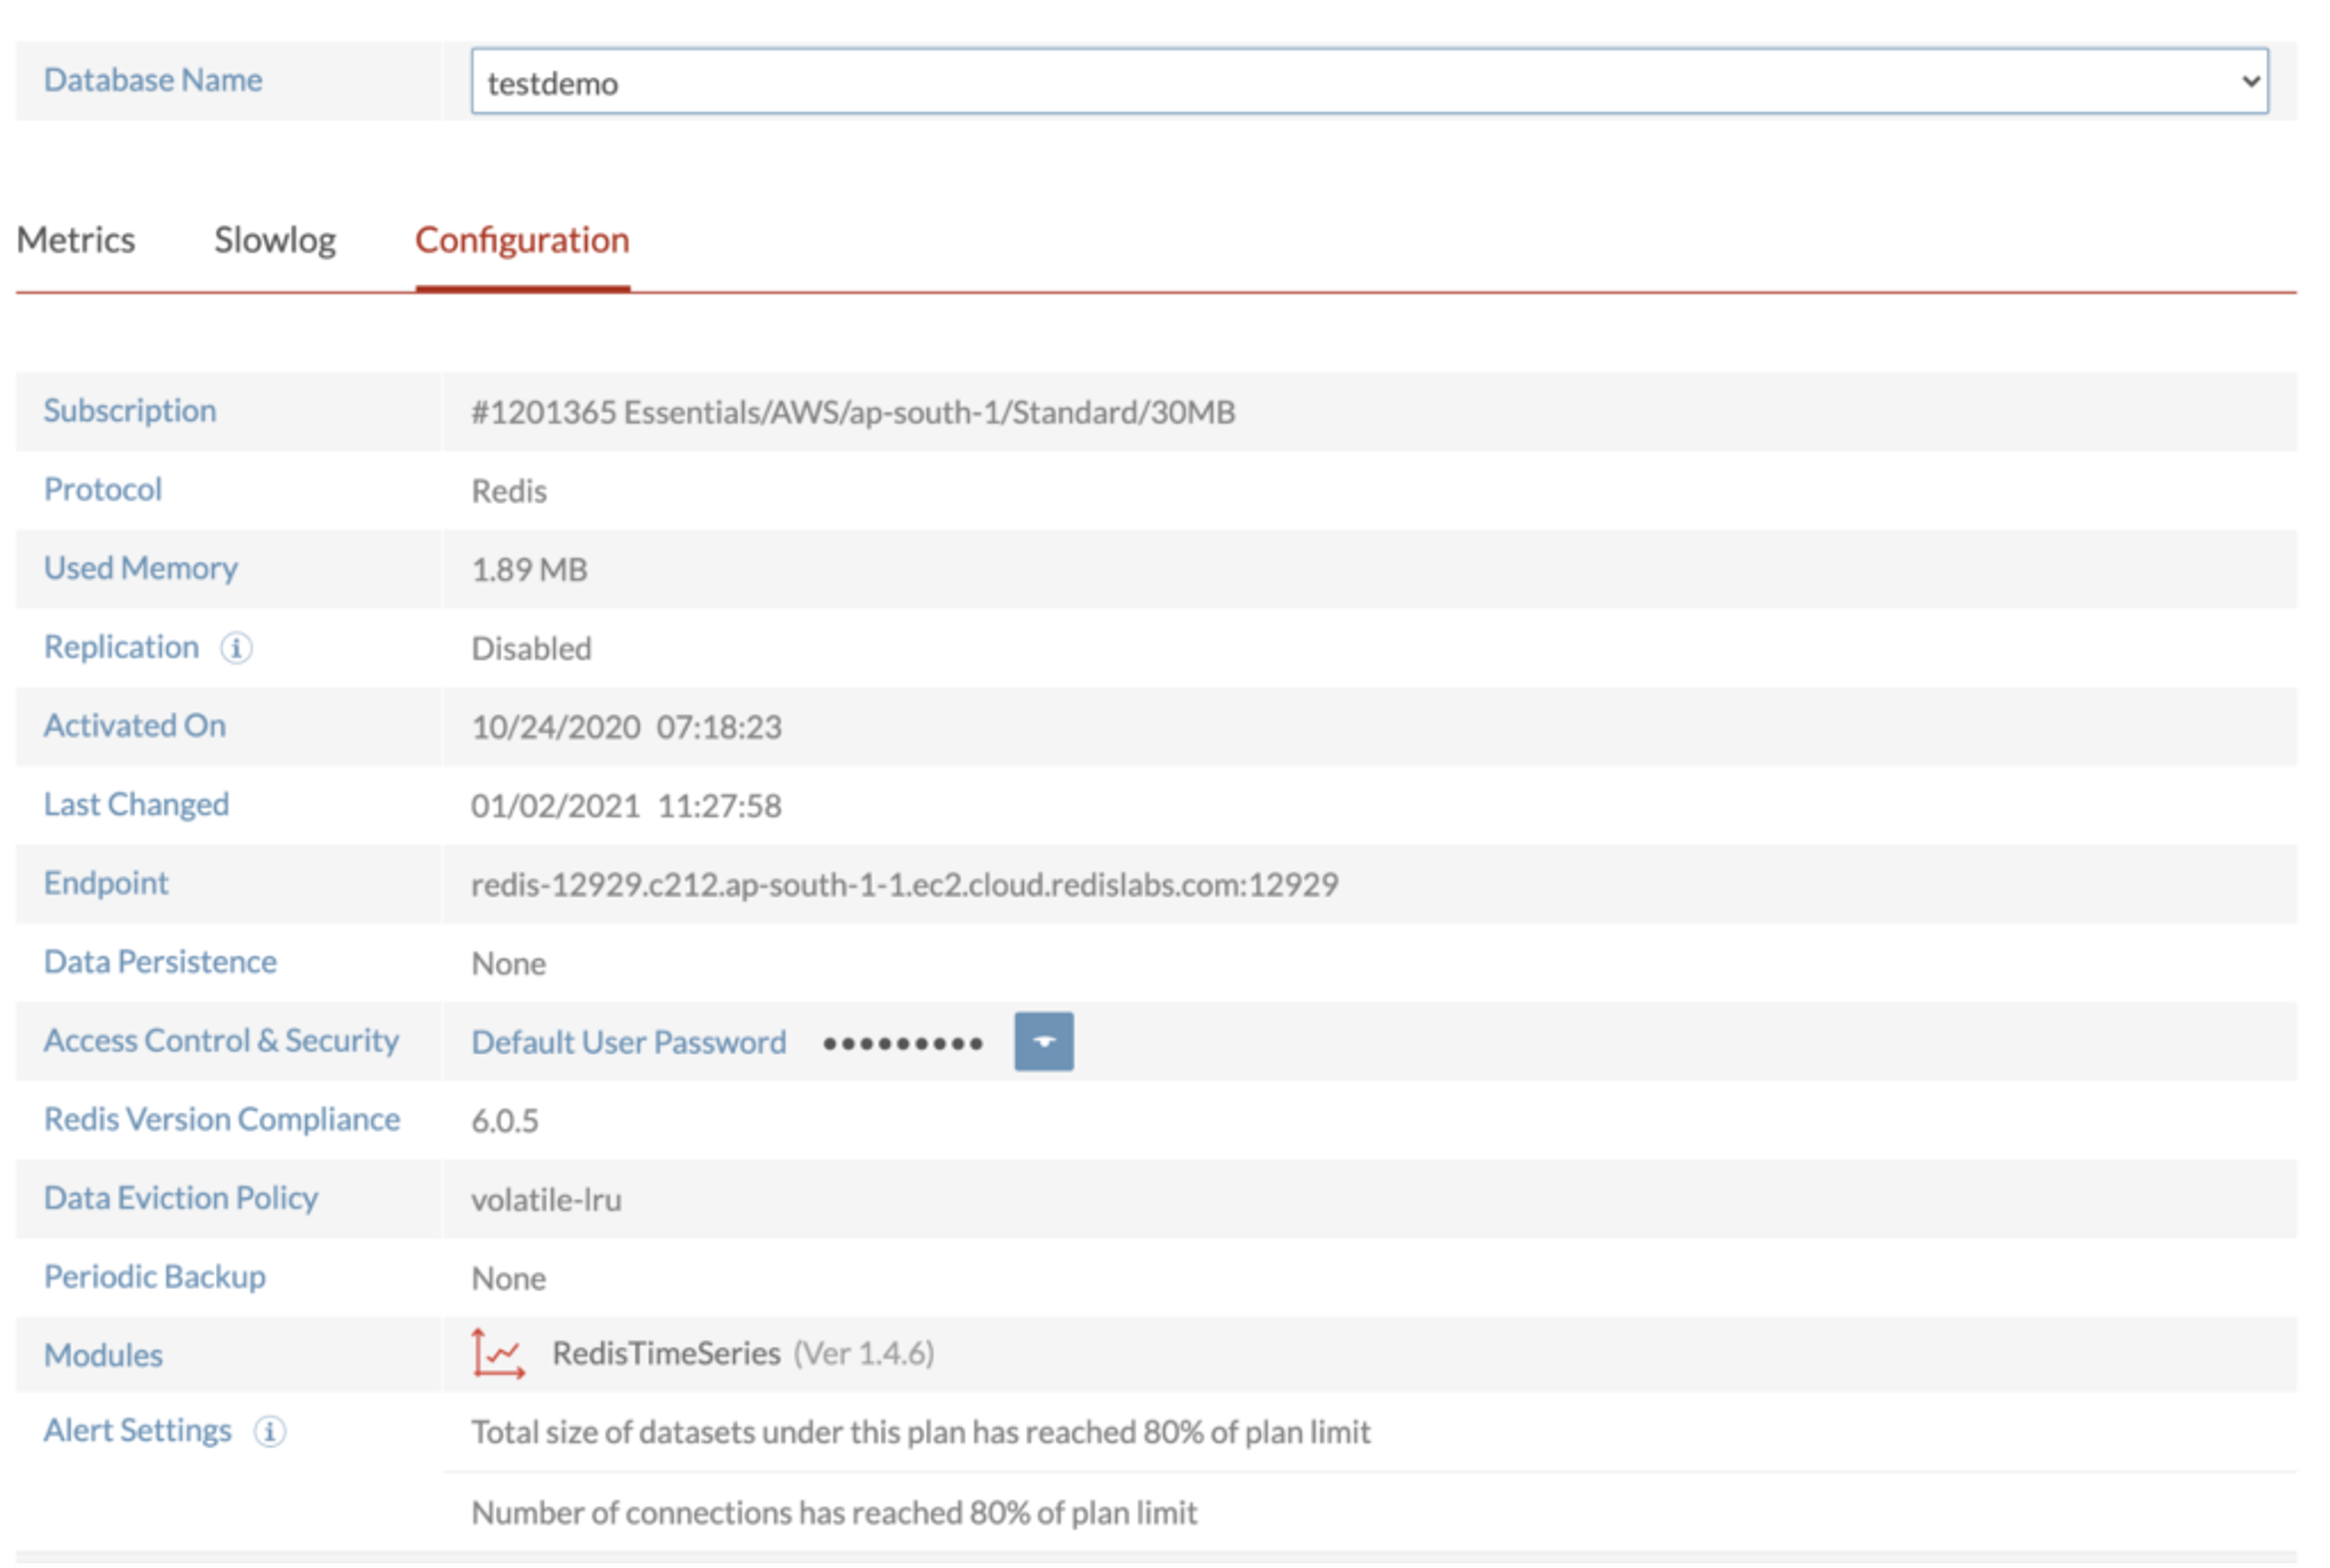
If you are completely new to RedisTimeSeries, check out our RedisTimeSeries Quick Start tutorial. It explains how to get started with Redis Enterprise Cloud and how to enable RedisTimeSeries. You will need a few details for this implementation:
- Redis database name
- Redis database endpoint
- Port number
- Default user password
Step 7: Clone the project repository
Reading the sensor values from the BME680 is fairly straightforward, but requires you to set a few configuration values. You can also run the sensor in two different “modes”—with or without gas readings. Just taking temperature, pressure, and humidity readings lets you sample data much faster.
Let’s look first at the library import and the configuration settings. Open a terminal window, create a file, and then type the following:
The first module, bme680, allows you to easily write Python code that reads the humidity, temperature, and pressure from the sensor. Similarly, there are other Python modules, such as time, to handle time-related tasks, redis to import Redis Python modules, and so on. We’re using the time library to introduce a small delay between each reading of the sensor to help ensure consistent results.
The sensor = bme680.BME680() command creates an instance of the sensor that we’ll use to configure the settings and get the sensor’s readings. The _oversample settings we established for the humidity, pressure, and temperature measurements are designed to strike a balance between accurate readings and minimizing noise. The higher the oversampling, the greater the noise reduction, albeit accompanied by a reduction in accuracy.
The _filter protects sensor readings against transient changes in conditions, e.g. a door slamming that could cause the pressure to change momentarily, and the IIR filter removes these transient spiky values.
Shown in the code below, the gas measurement has a few settings that can be tweaked. It can be enabled or disabled with set_gas_status. Disabling it allows the other readings to be taken more rapidly, as mentioned above. The temperature of the hot plate and how long it’s held at that temperature can also be altered, although we recommend not changing these settings if your gas resistance readings look sensible.
Next, we define the Redis connector, where we specify the Redis instance host, port, and password. As shown below, the code below defines the various RedisTimeSeries keys, such as a temperature key (TS:TEMPERATURE), pressure key (TS:PRESSURE), and humidity key (TS:HUMIDITY).
The sensor.get_sensor_data() instruction gets the data from the sensor and populates the three variables with temperature, humidity, and pressure.
Next, a “transactional pipeline” is constructed by calling the .pipeline() method on a Redis connection without arguments. Under the covers, the pipeline collects all the commands that are passed until the .execute() method is called. As you can see, we used RedisTimeSeries’ TS.ADD command to populate the sensor data structure. You can access the complete code via this GitHub Repository.
Step 8: Execute the script
Before you execute the script, you will need to import the bme680 and smbus Python modules, as shown here:
Make sure you supply the right Redis Enterprise Cloud database endpoints, username, and password:
You can run the monitor command to verify that sensor data is being populated, as shown here:
Step 9: Deploy Grafana
It’s exciting to see the sensor data plotted in Grafana. To implement this, run the command below:
Be sure that you have Docker Engine running in your system, either on your desktop system or in the cloud. For this demonstration, I have tested it on Docker Desktop for Mac.
Point your browser to https://<IP_ADDRESS>:3000. Use “admin” as username and password to log in to the Grafana dashboard.
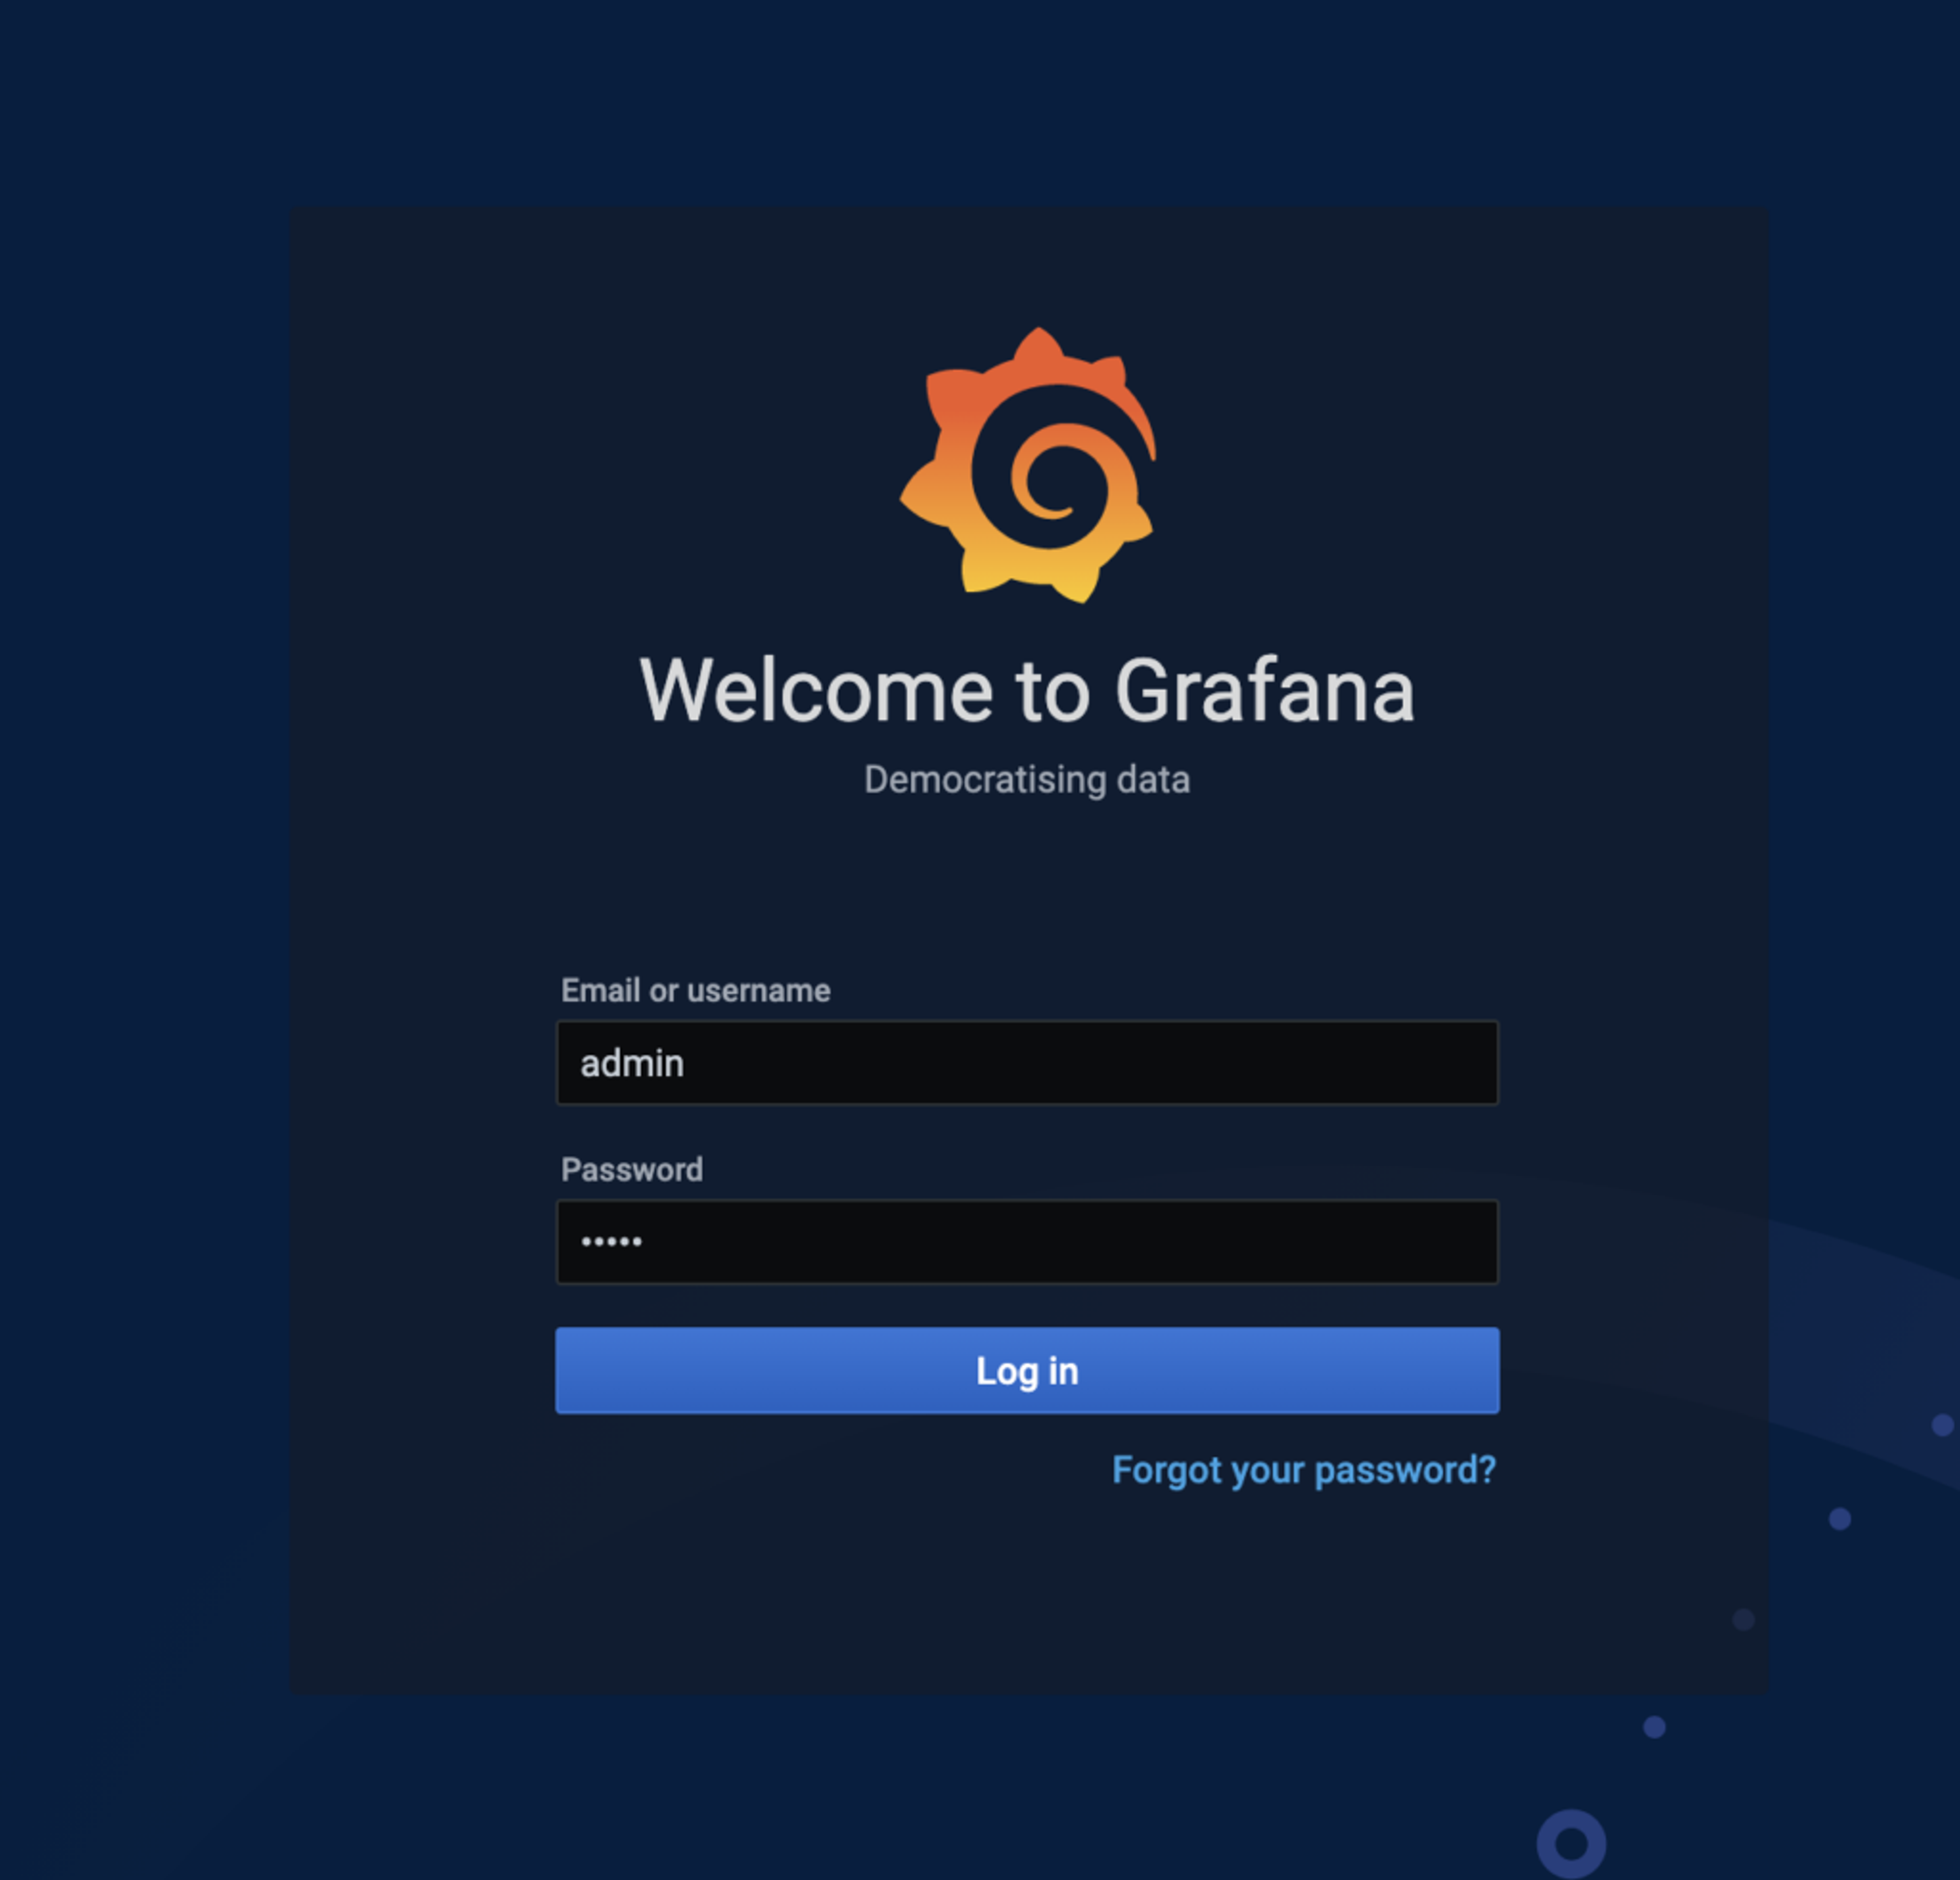
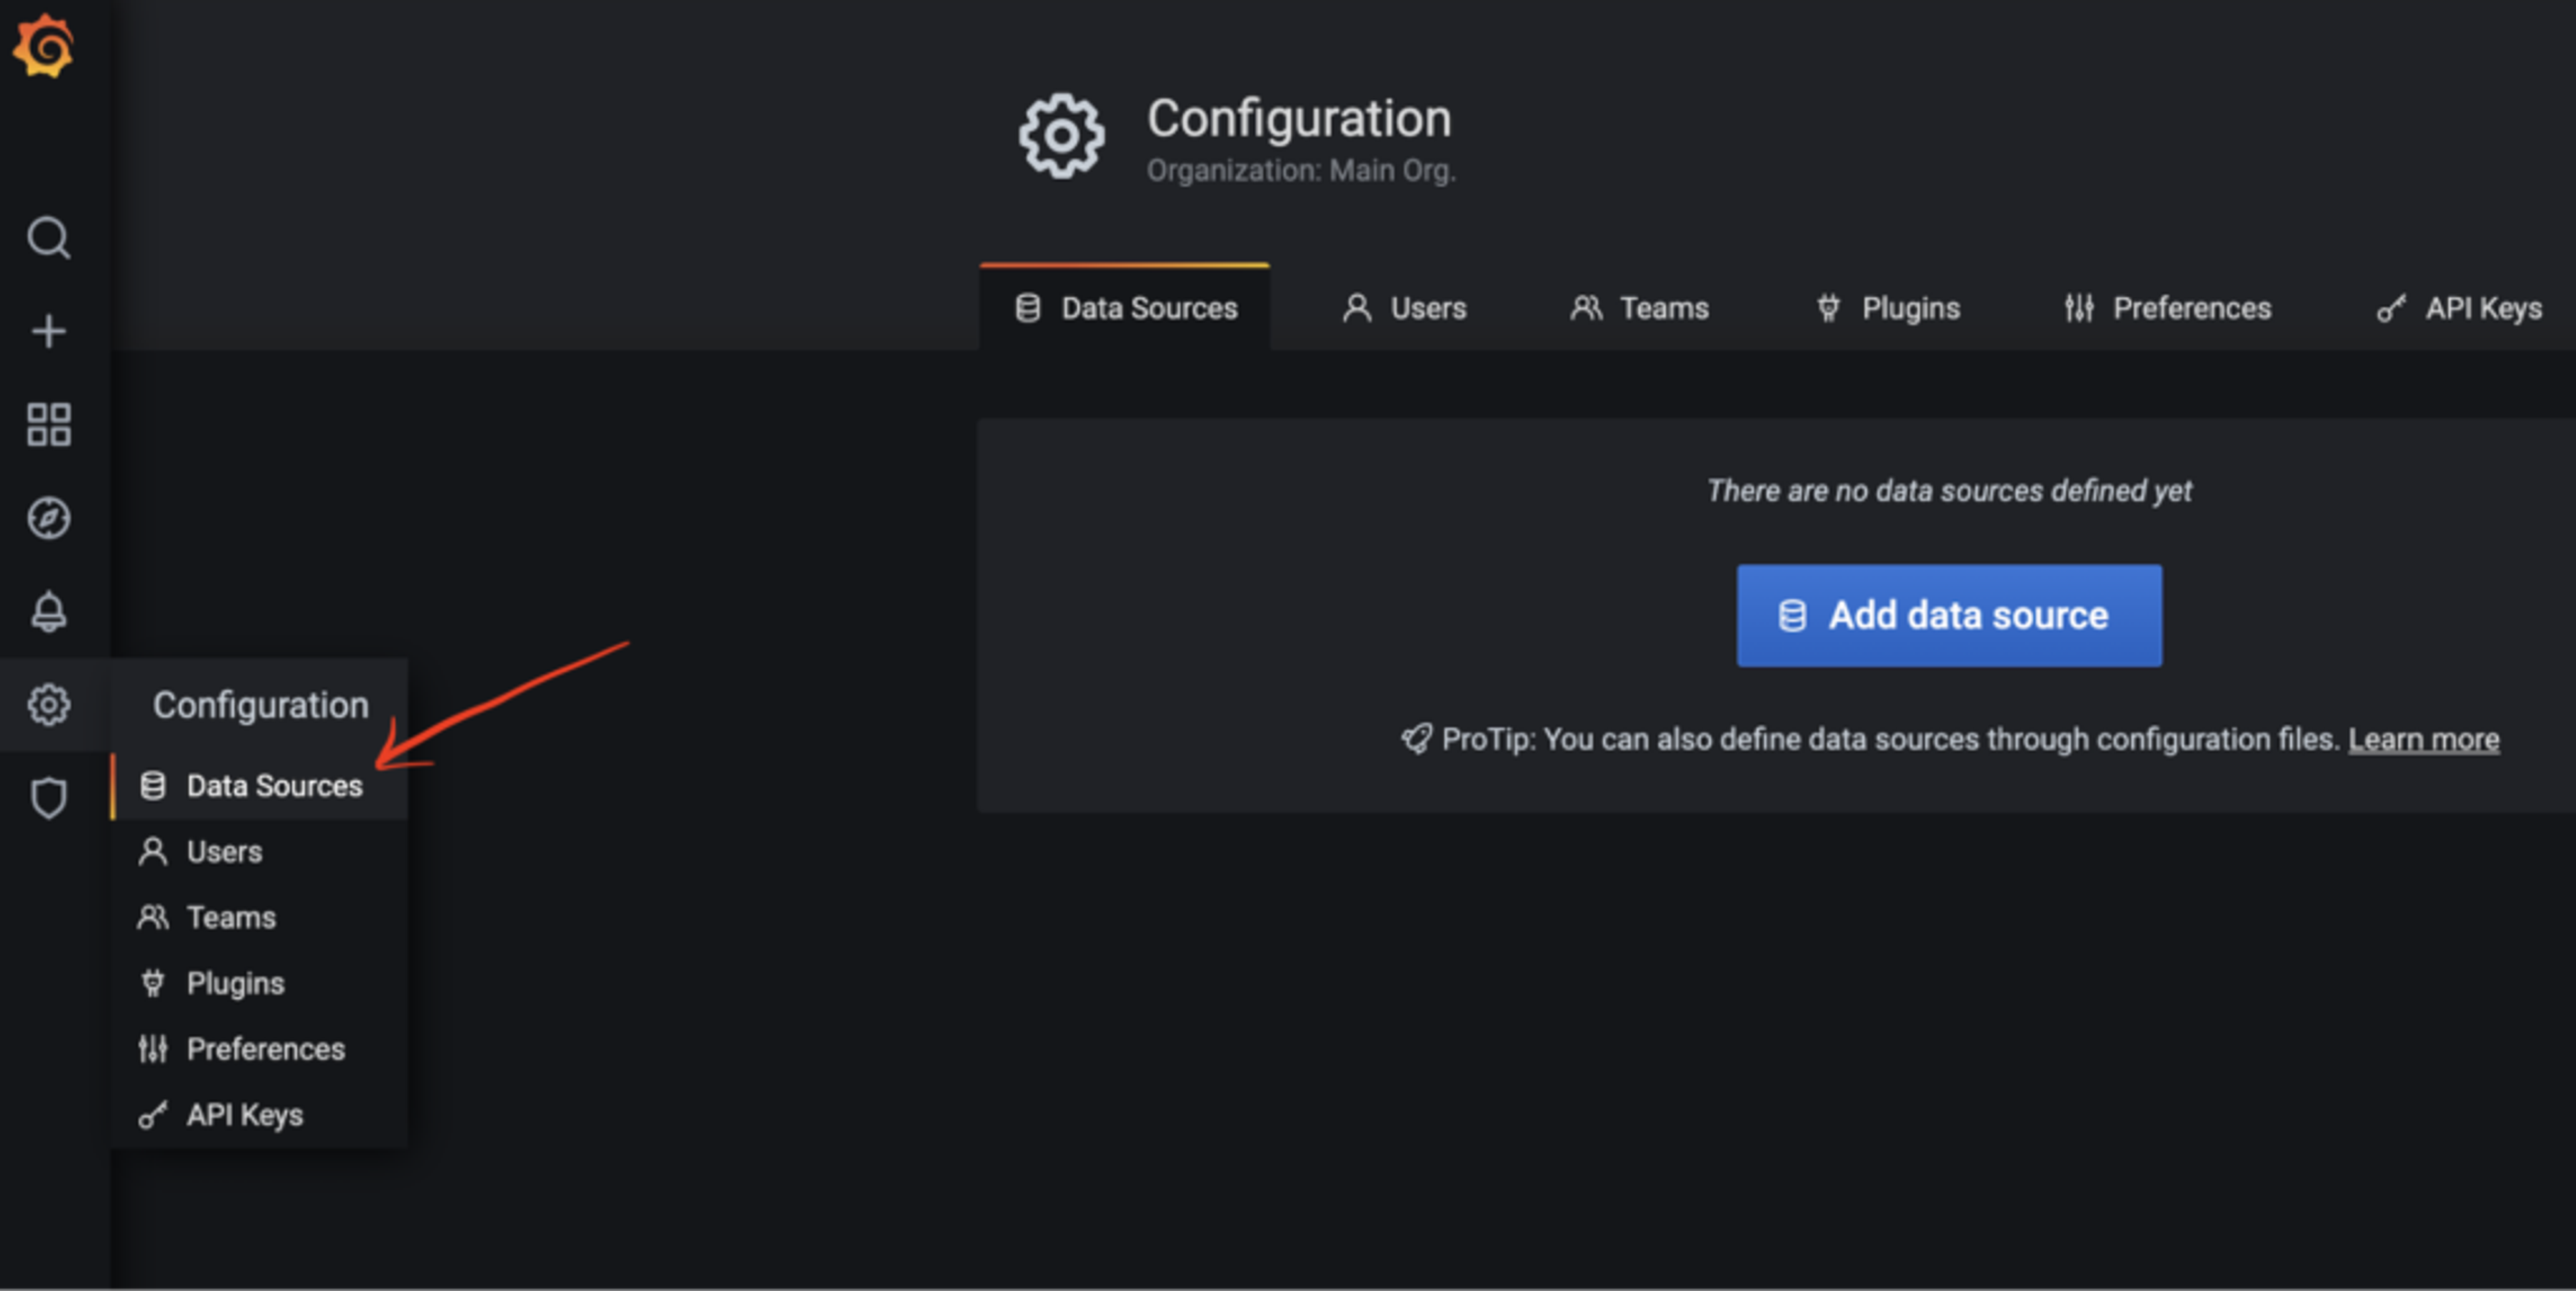
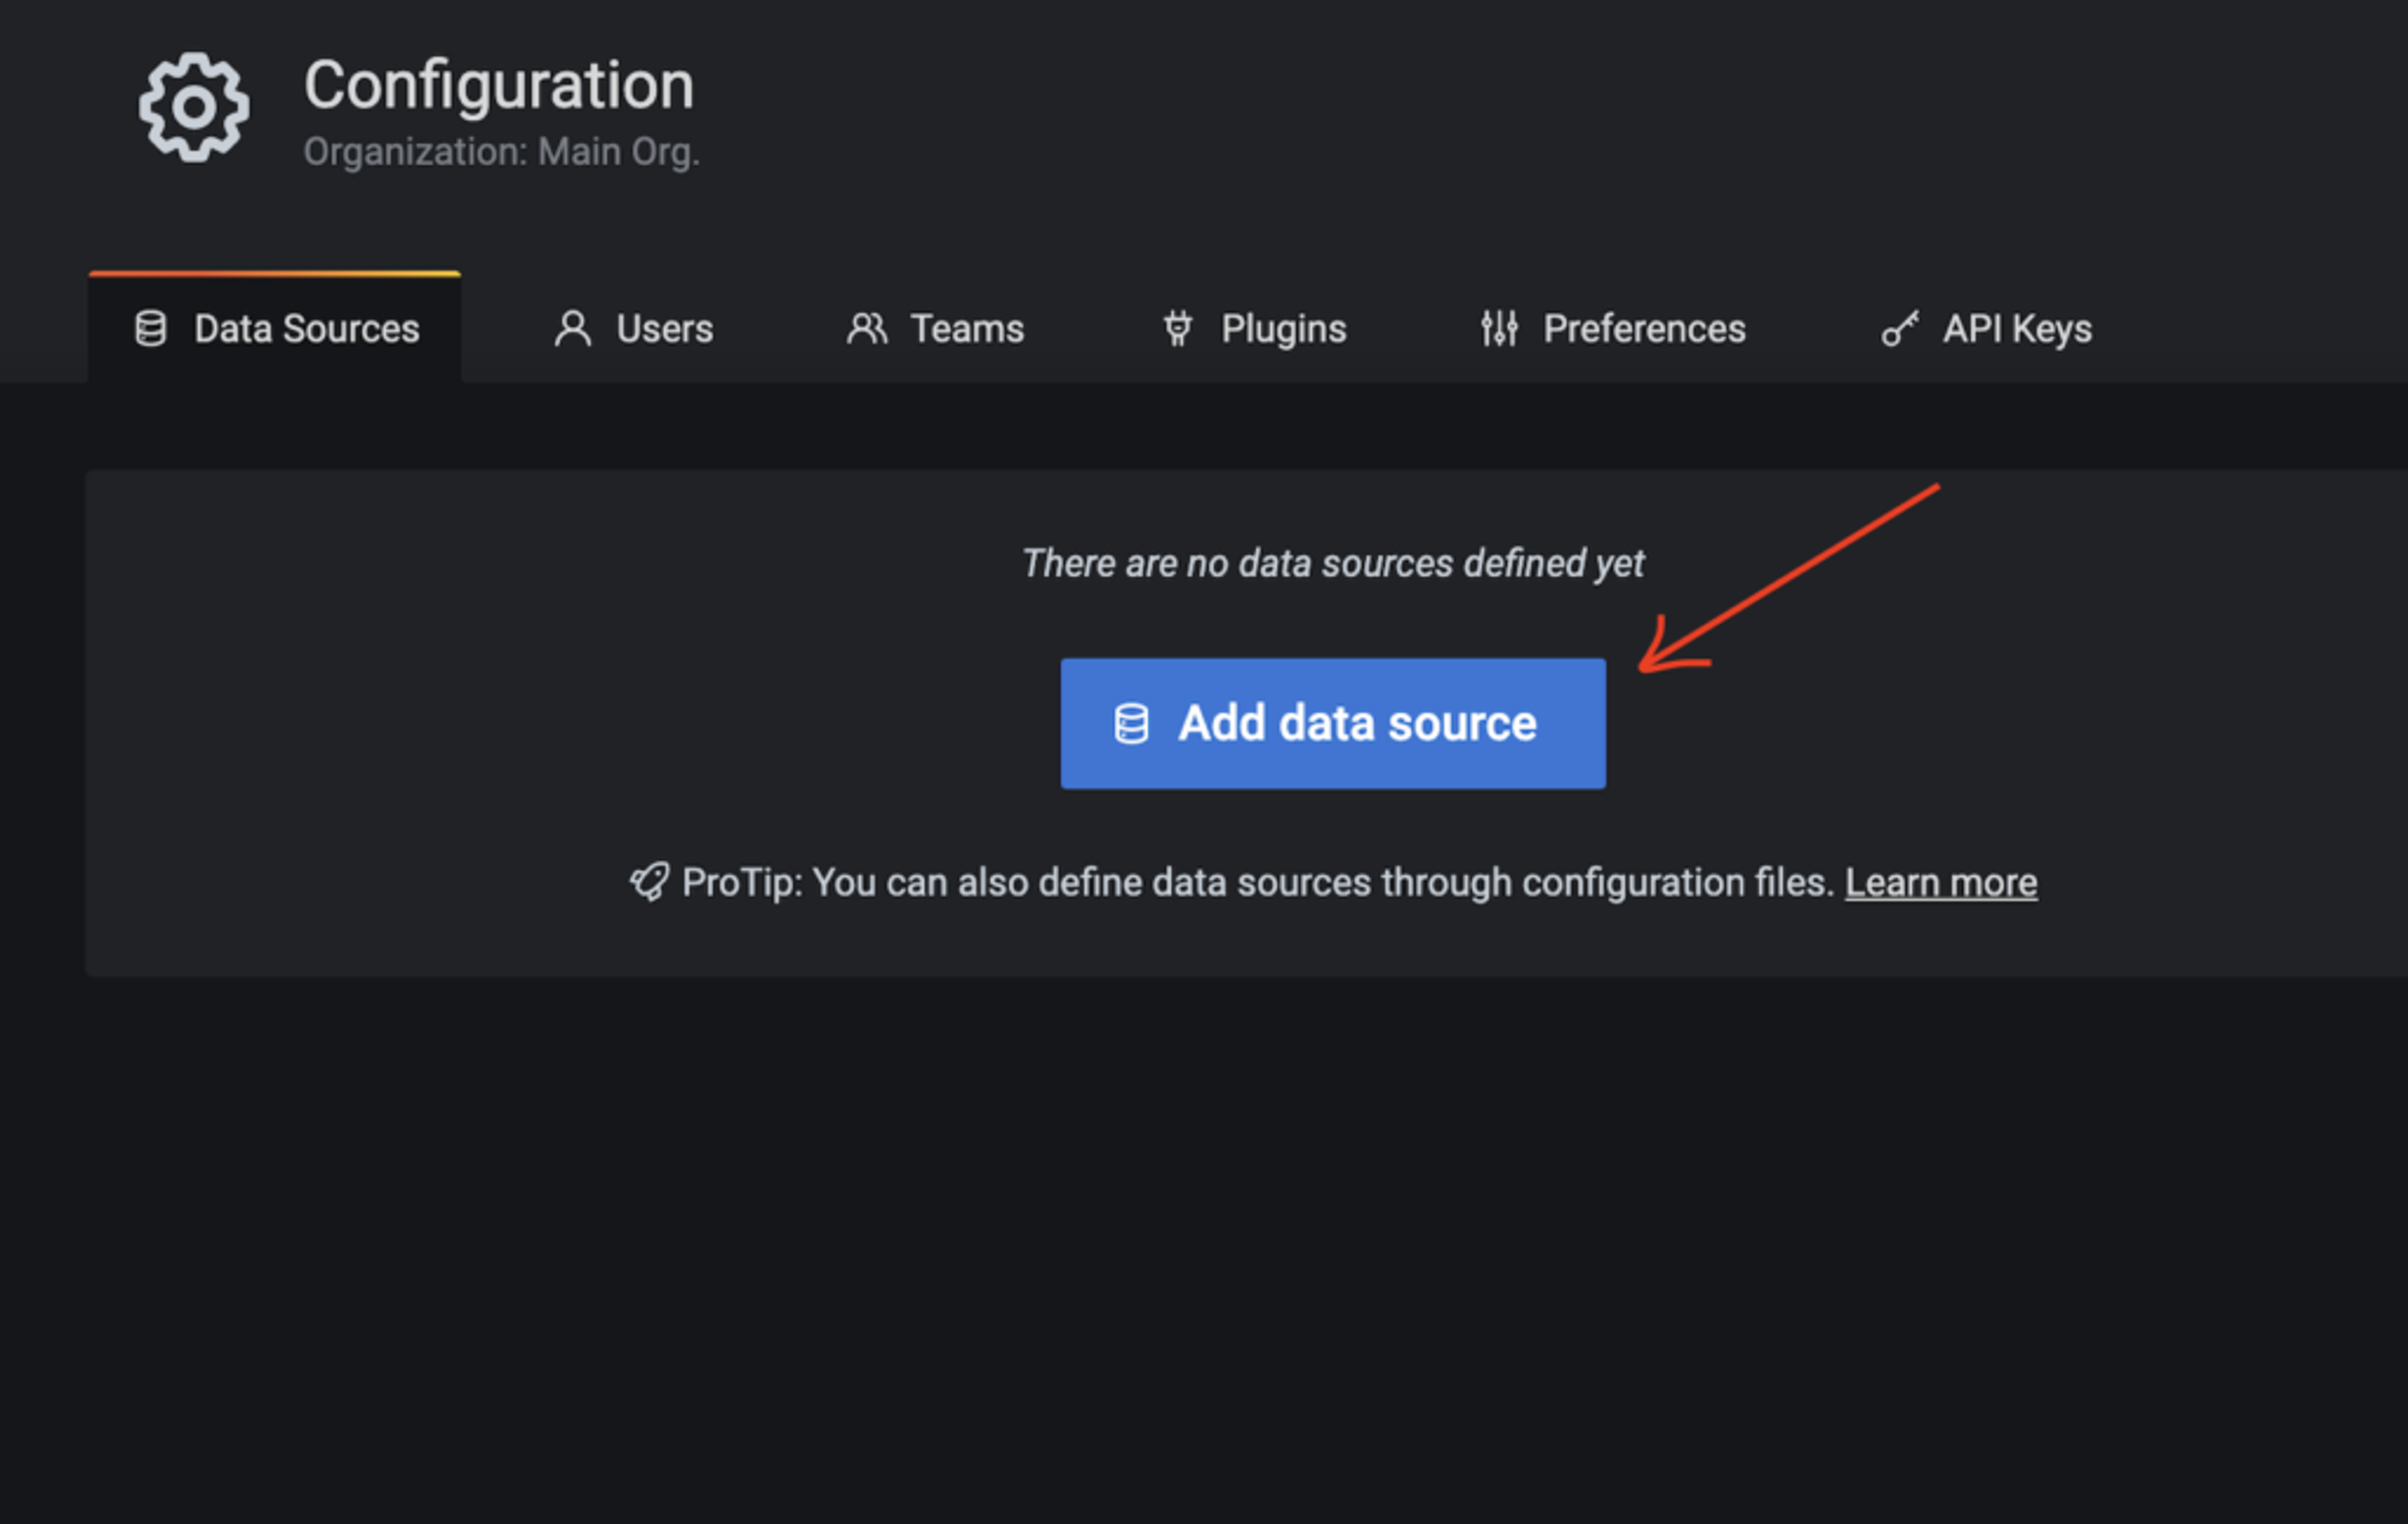
Click the Data Sources option on the left side of the Grafana dashboard to add a data source.
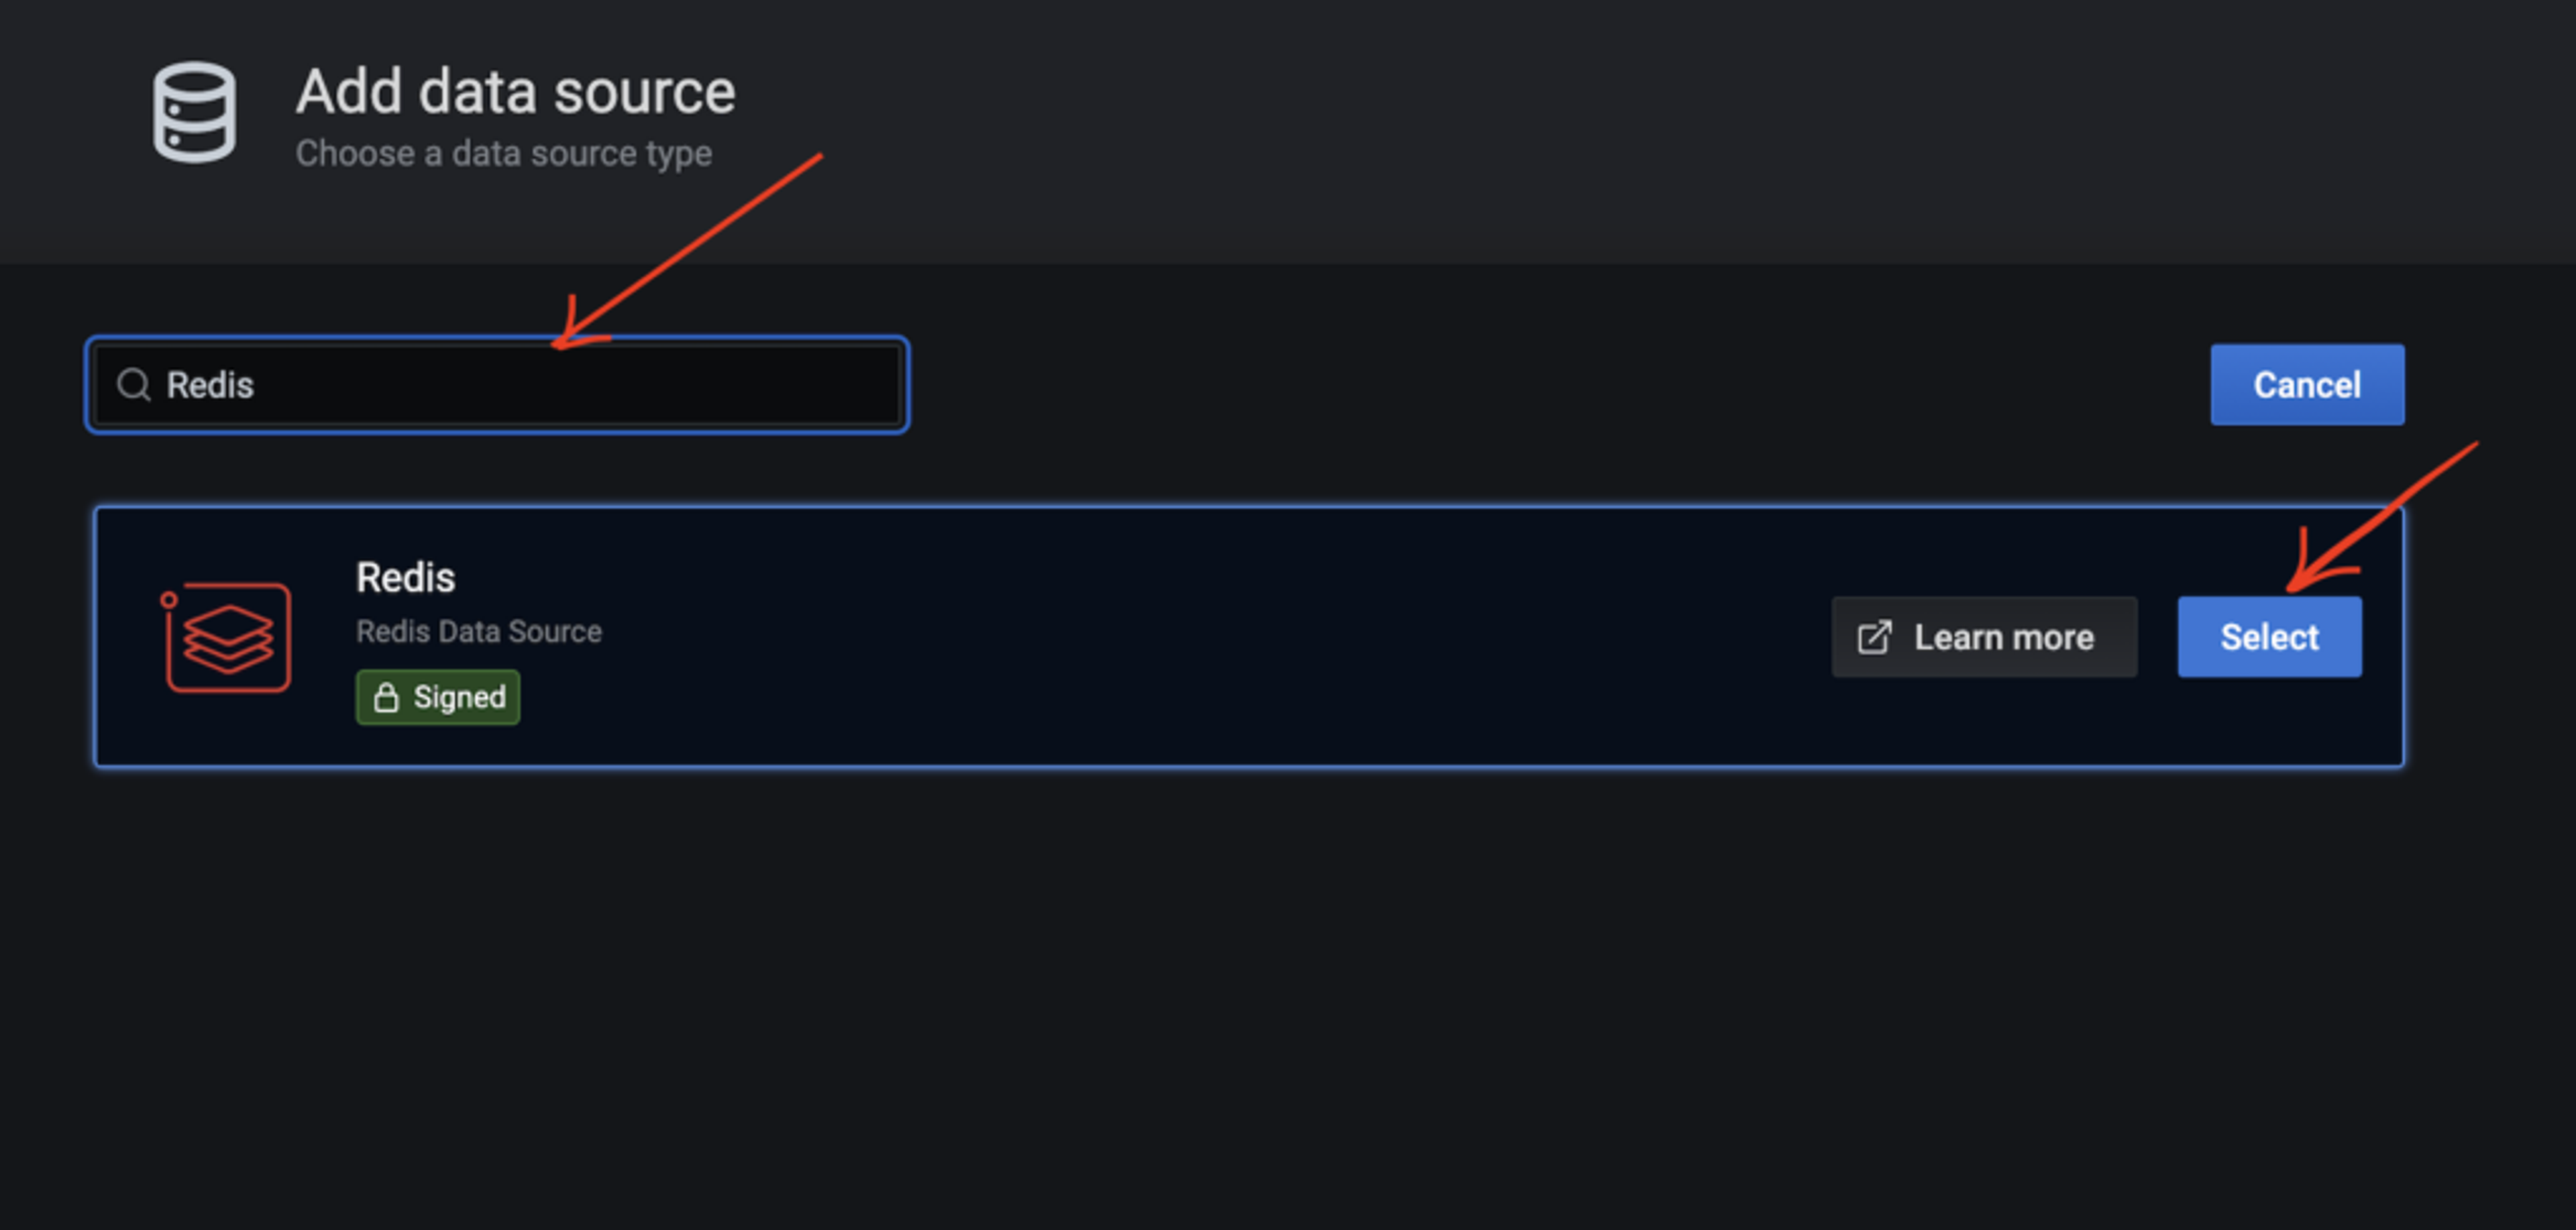
Under the Add data source option, search for Redis and the Redis data source will appear as shown below:
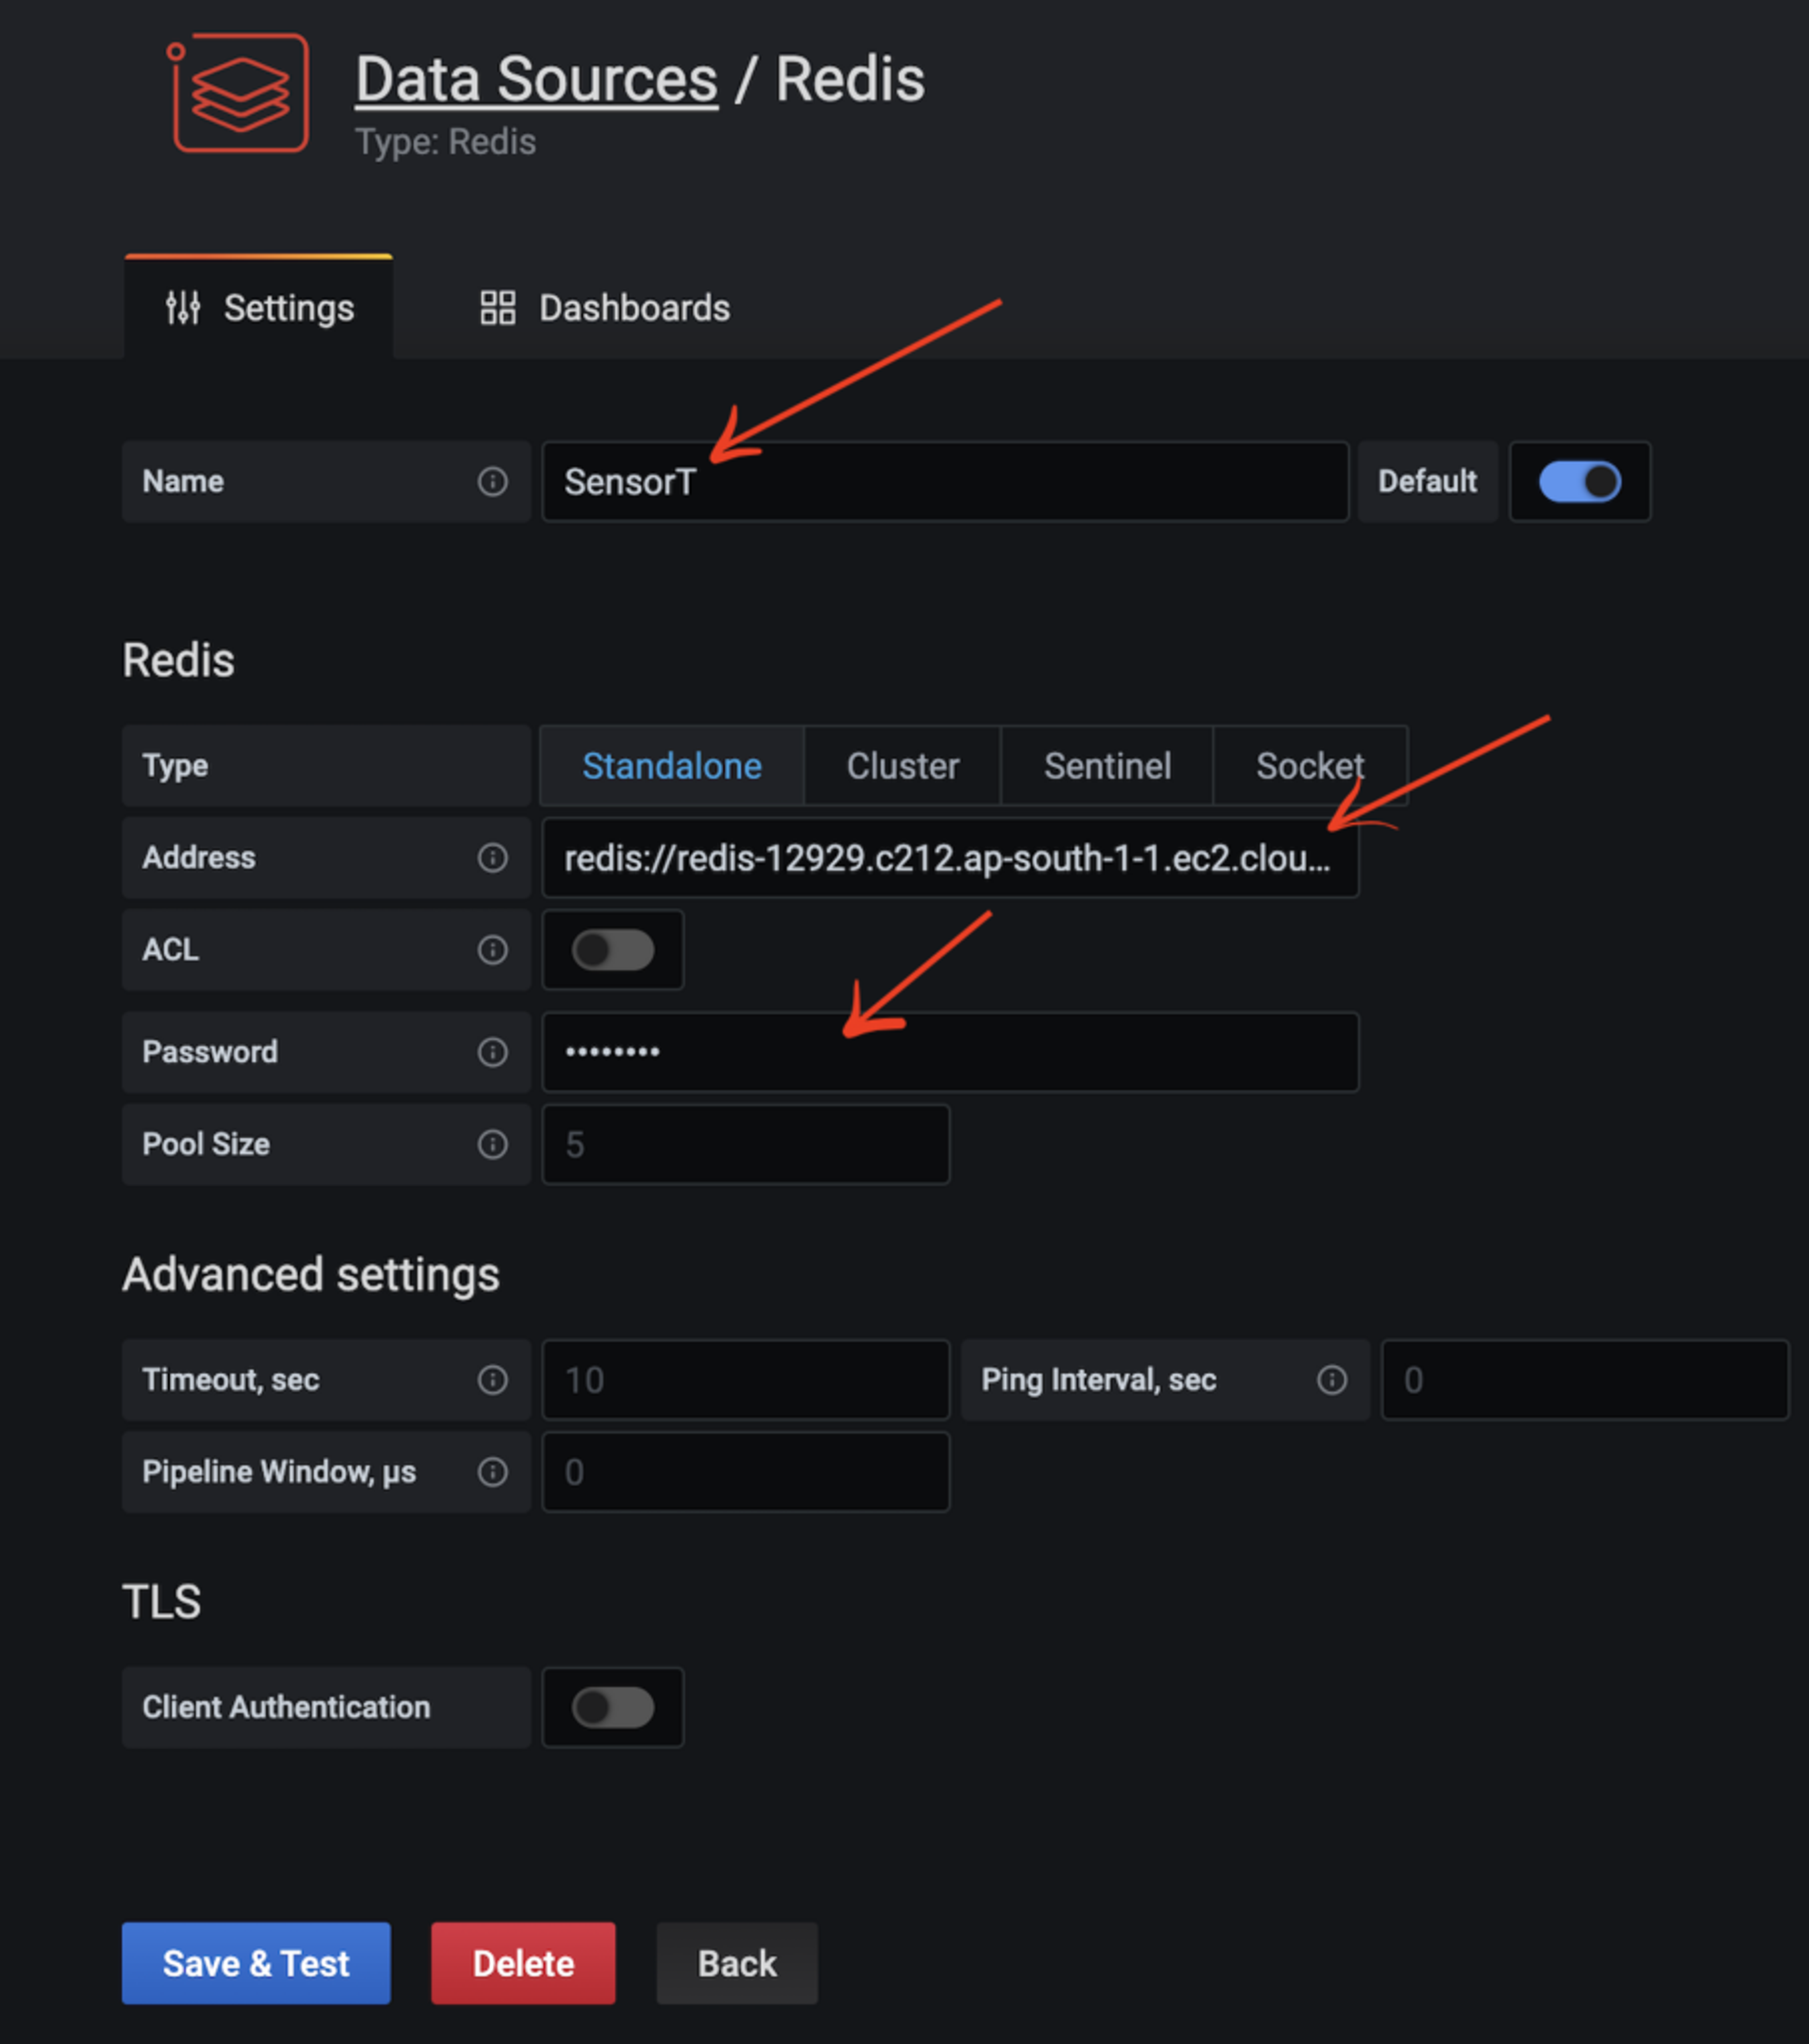
Supply the name, Redis Enterprise Cloud database endpoint, and password, then click Save & Test.
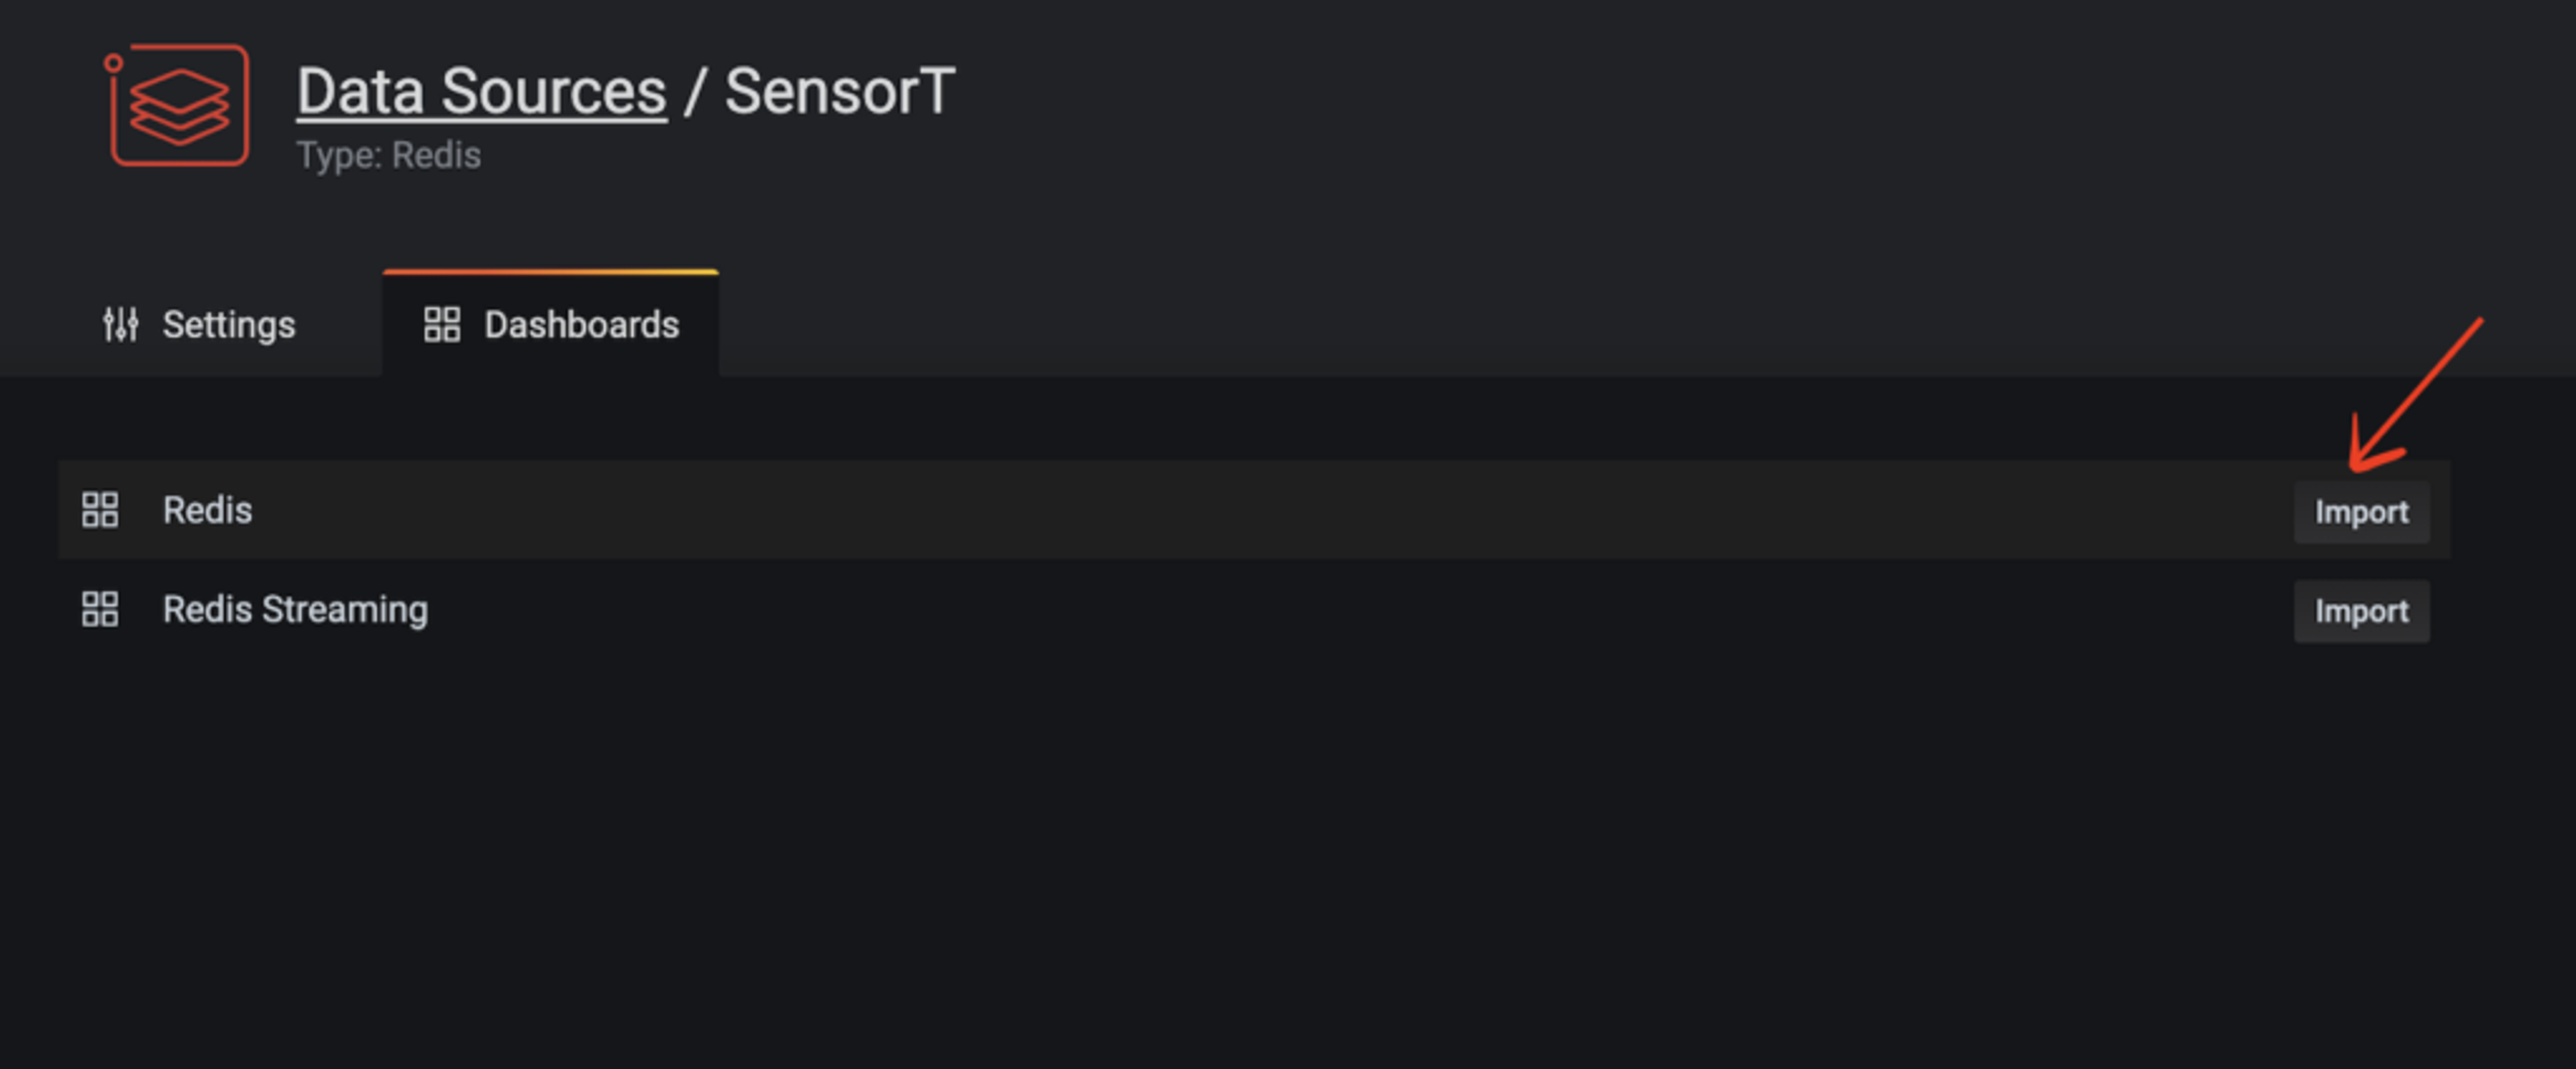
Click Dashboards to import Redis and Redis Streaming. Click Import for both these options.
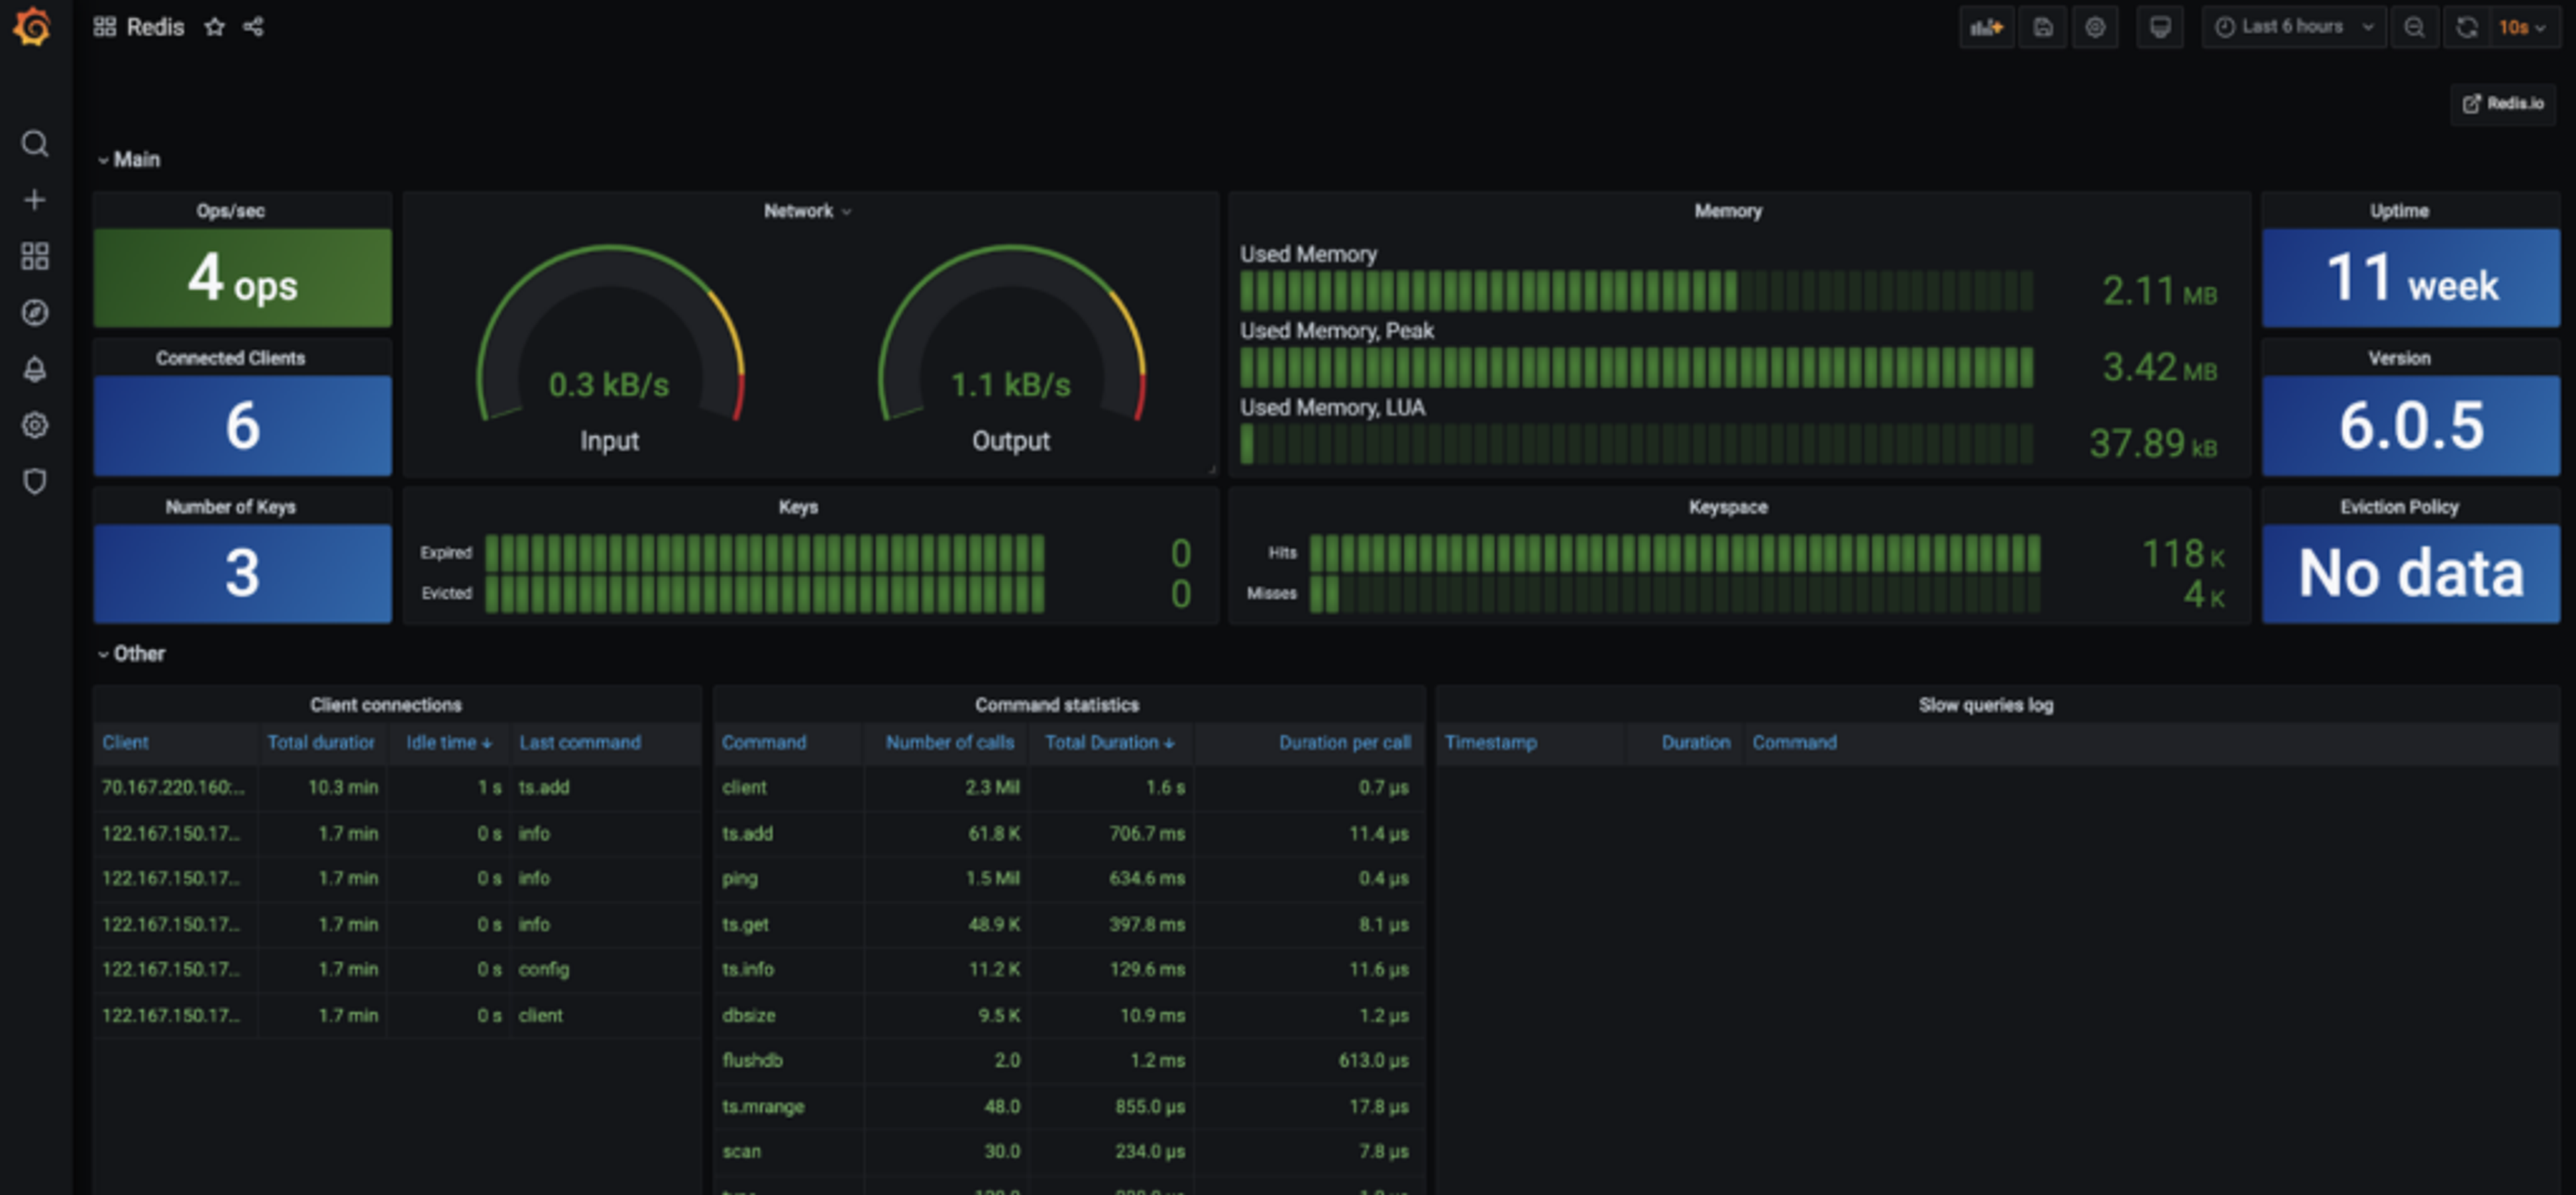
Click on Redis to see a fancy Grafana dashboard that shows the Redis database information:

Step 10: Plot RedisTimeSeries sensor data in Grafana
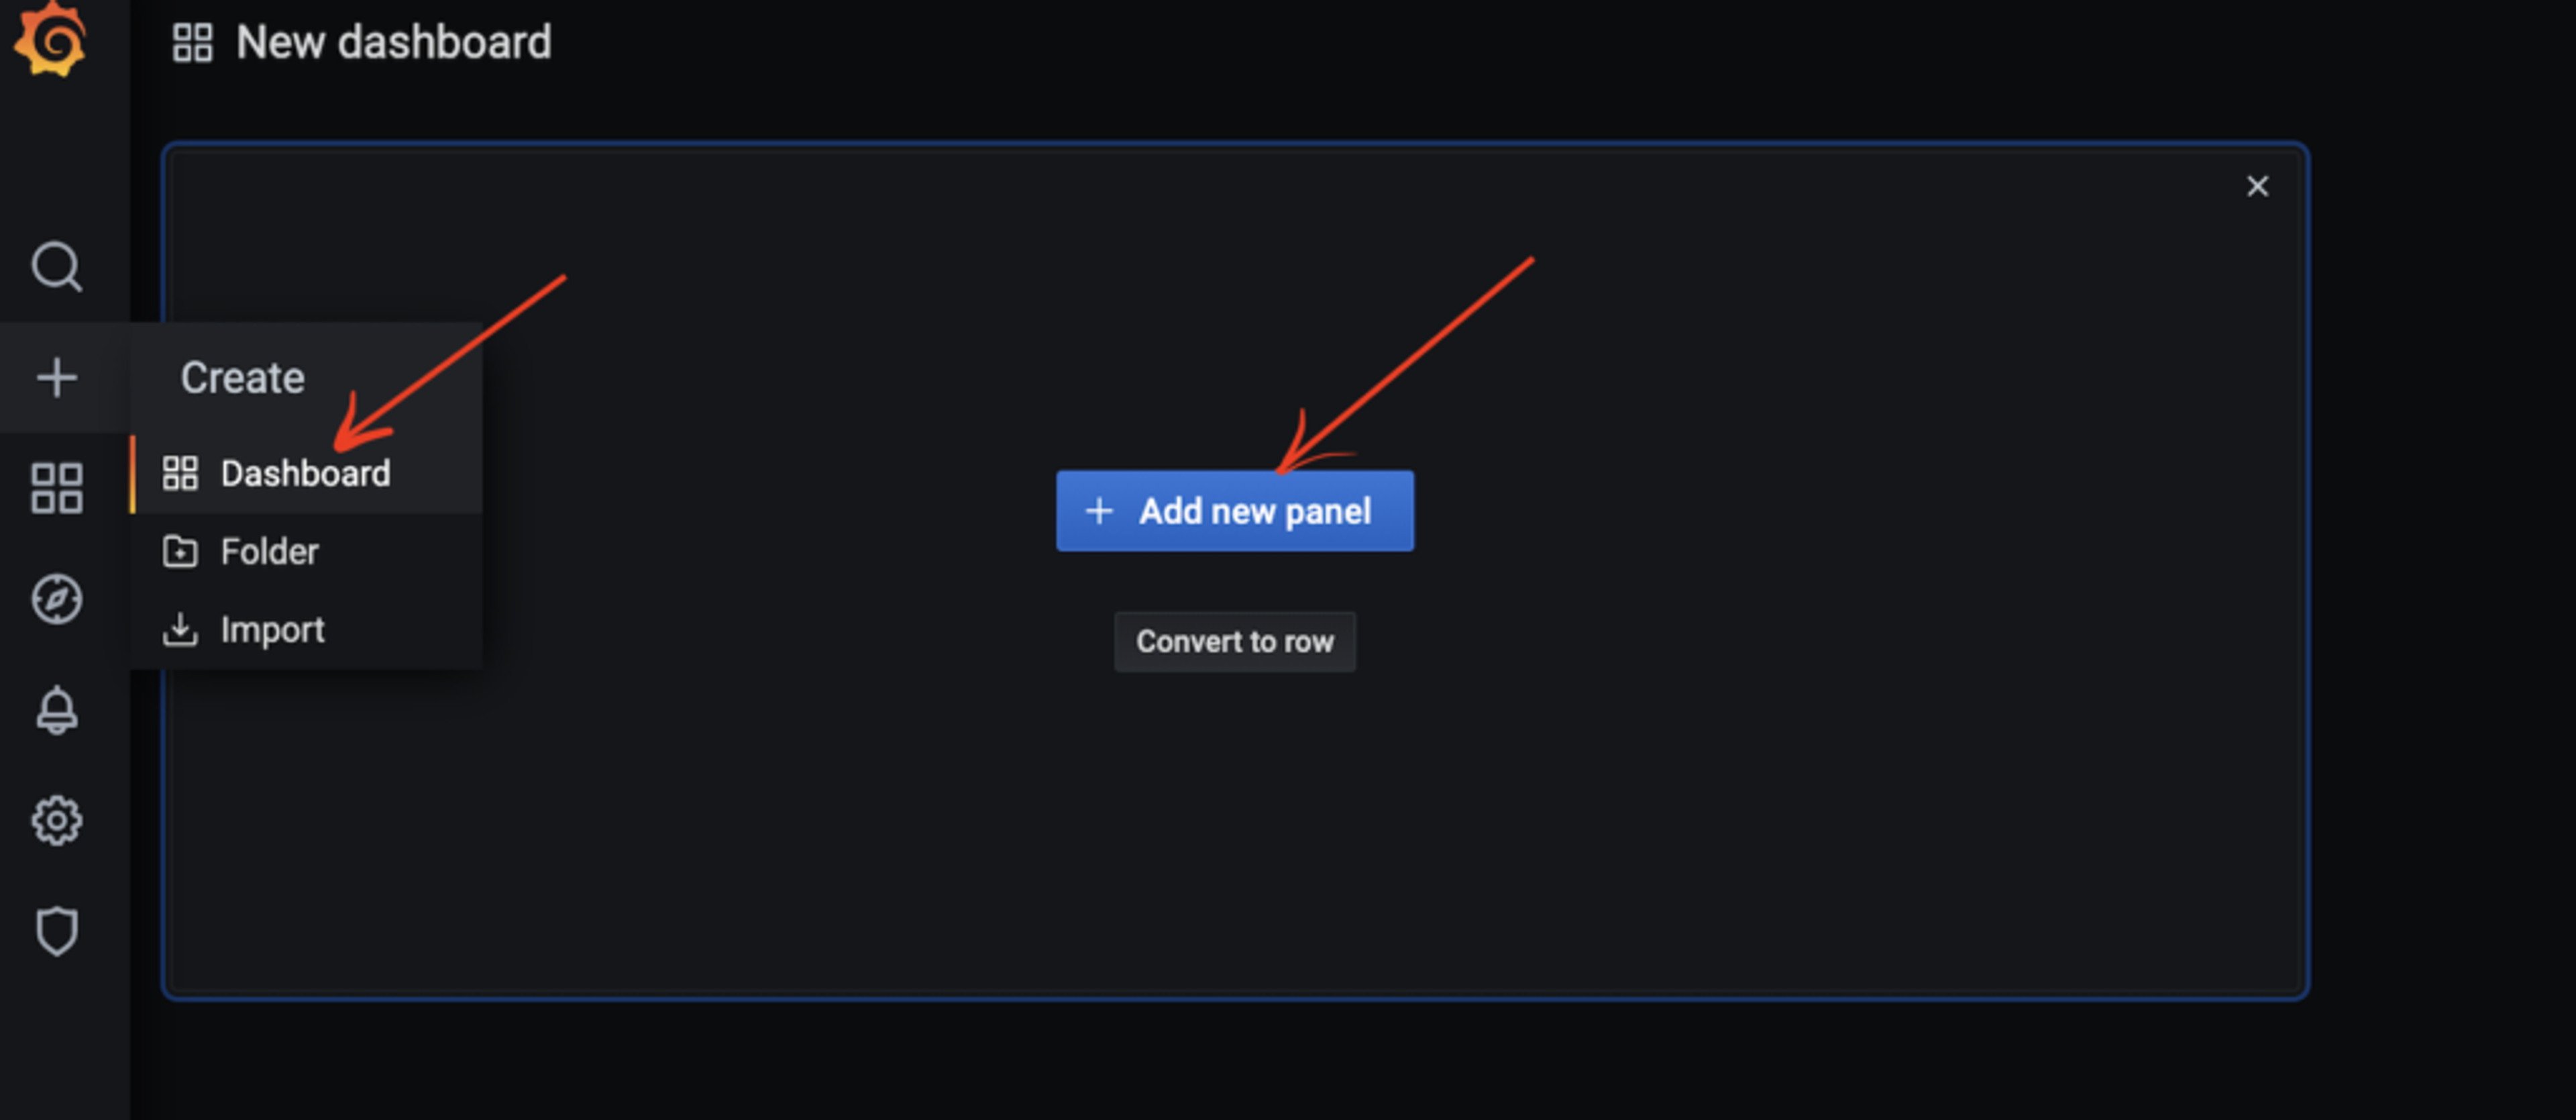
Finally, let’s create a sensor dashboard that shows temperature, pressure, and humidity. To start with temperature, first click on + on the left navigation window. Under Create option, Select Dashboard and click on the Add new panel button.
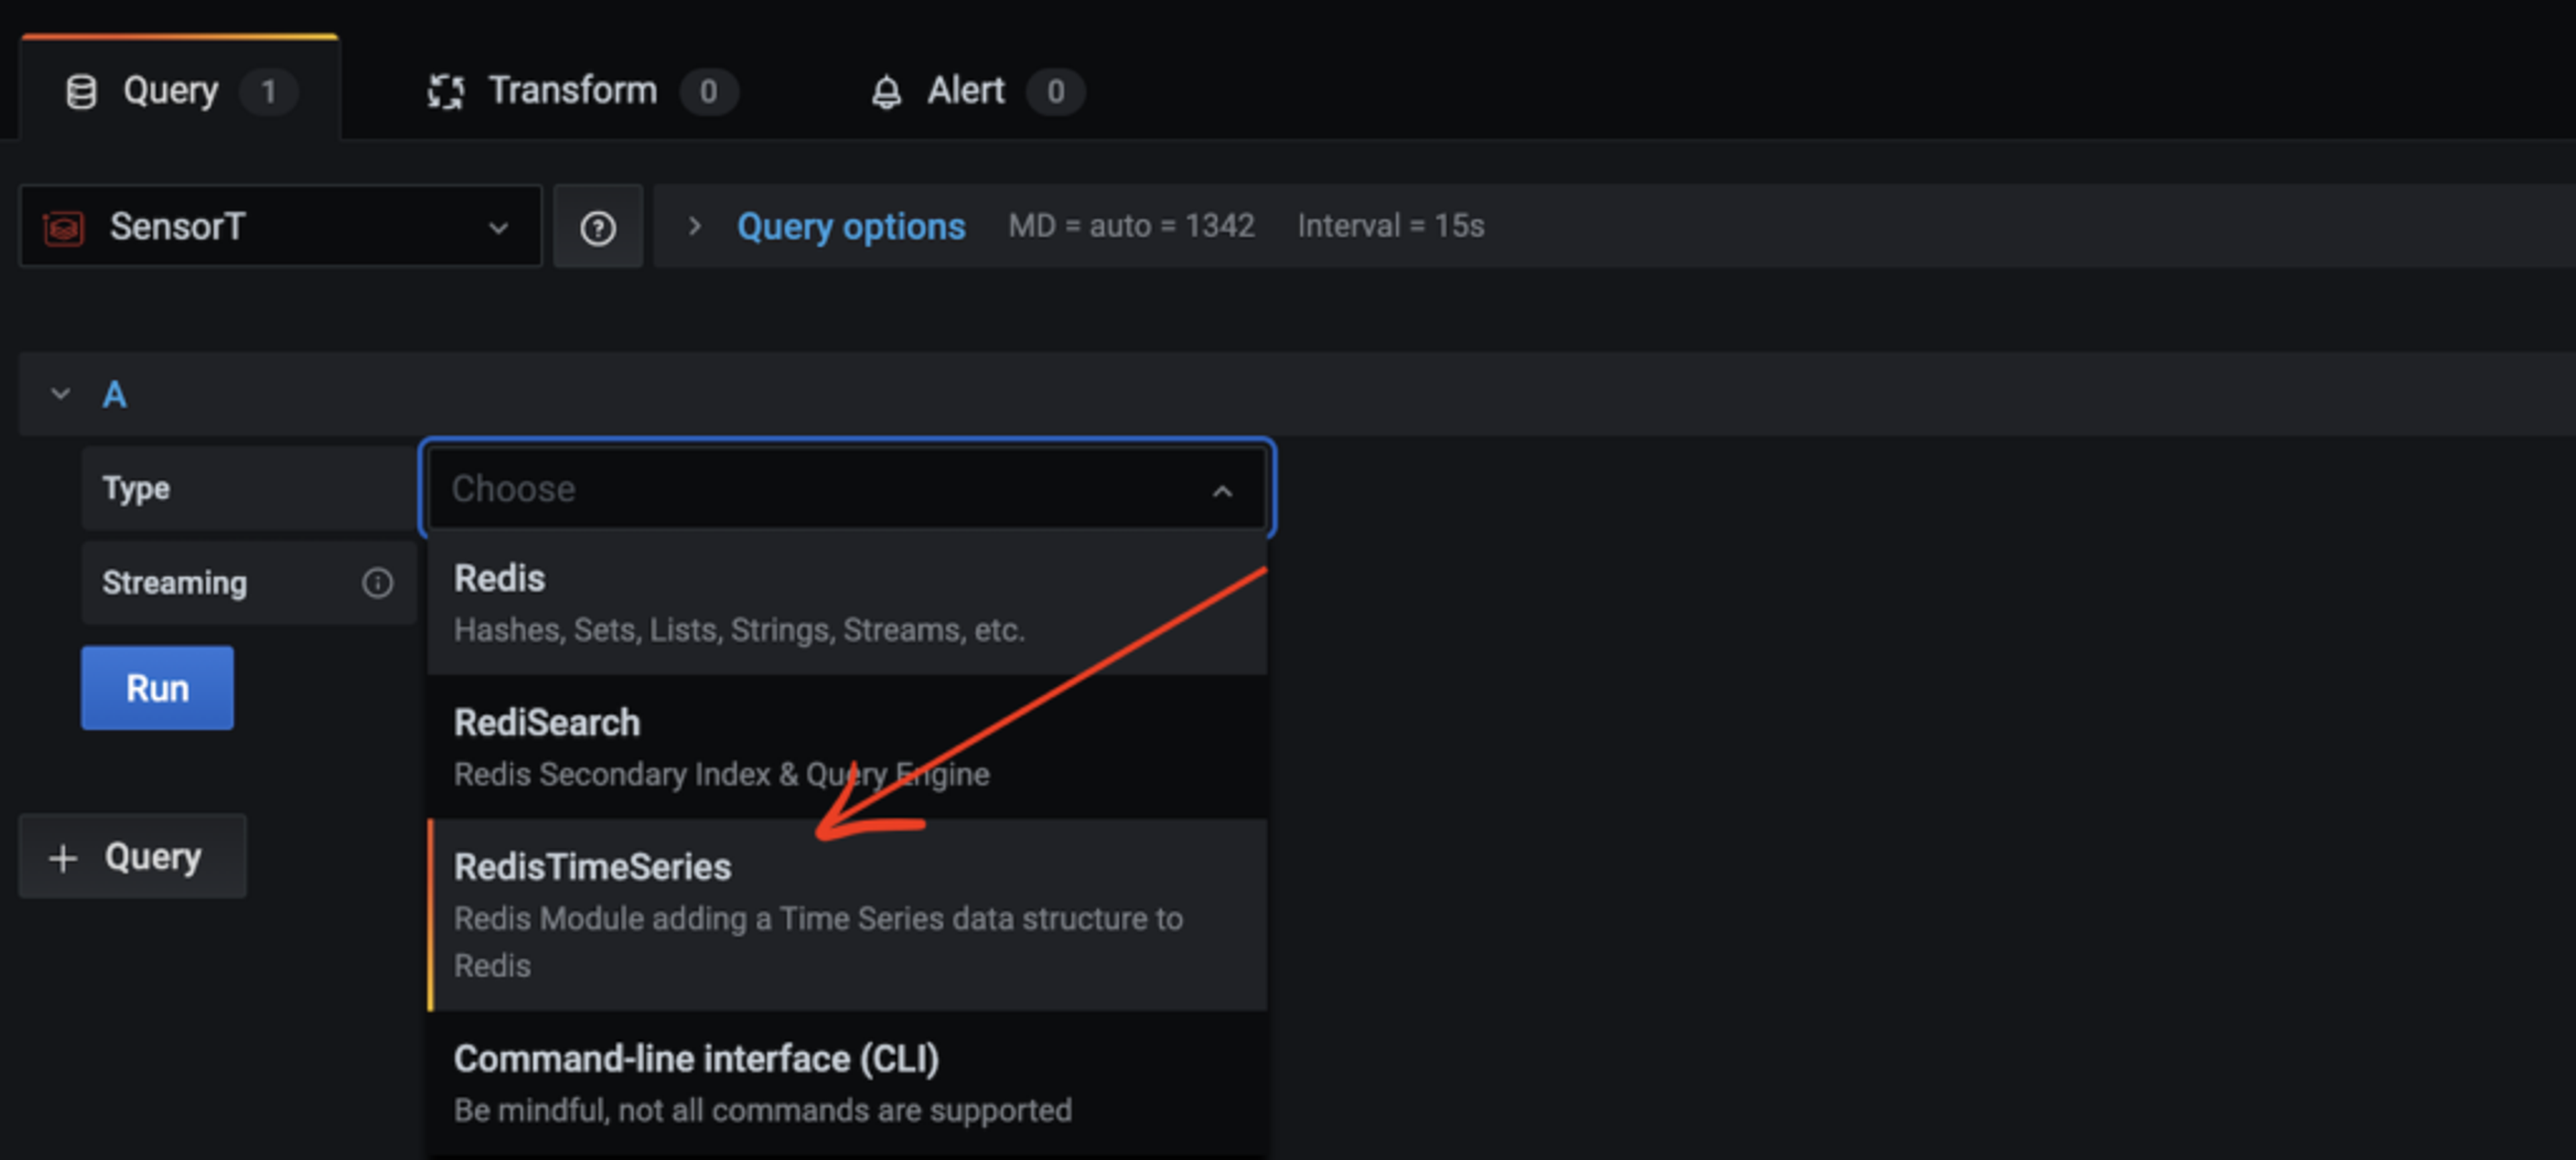
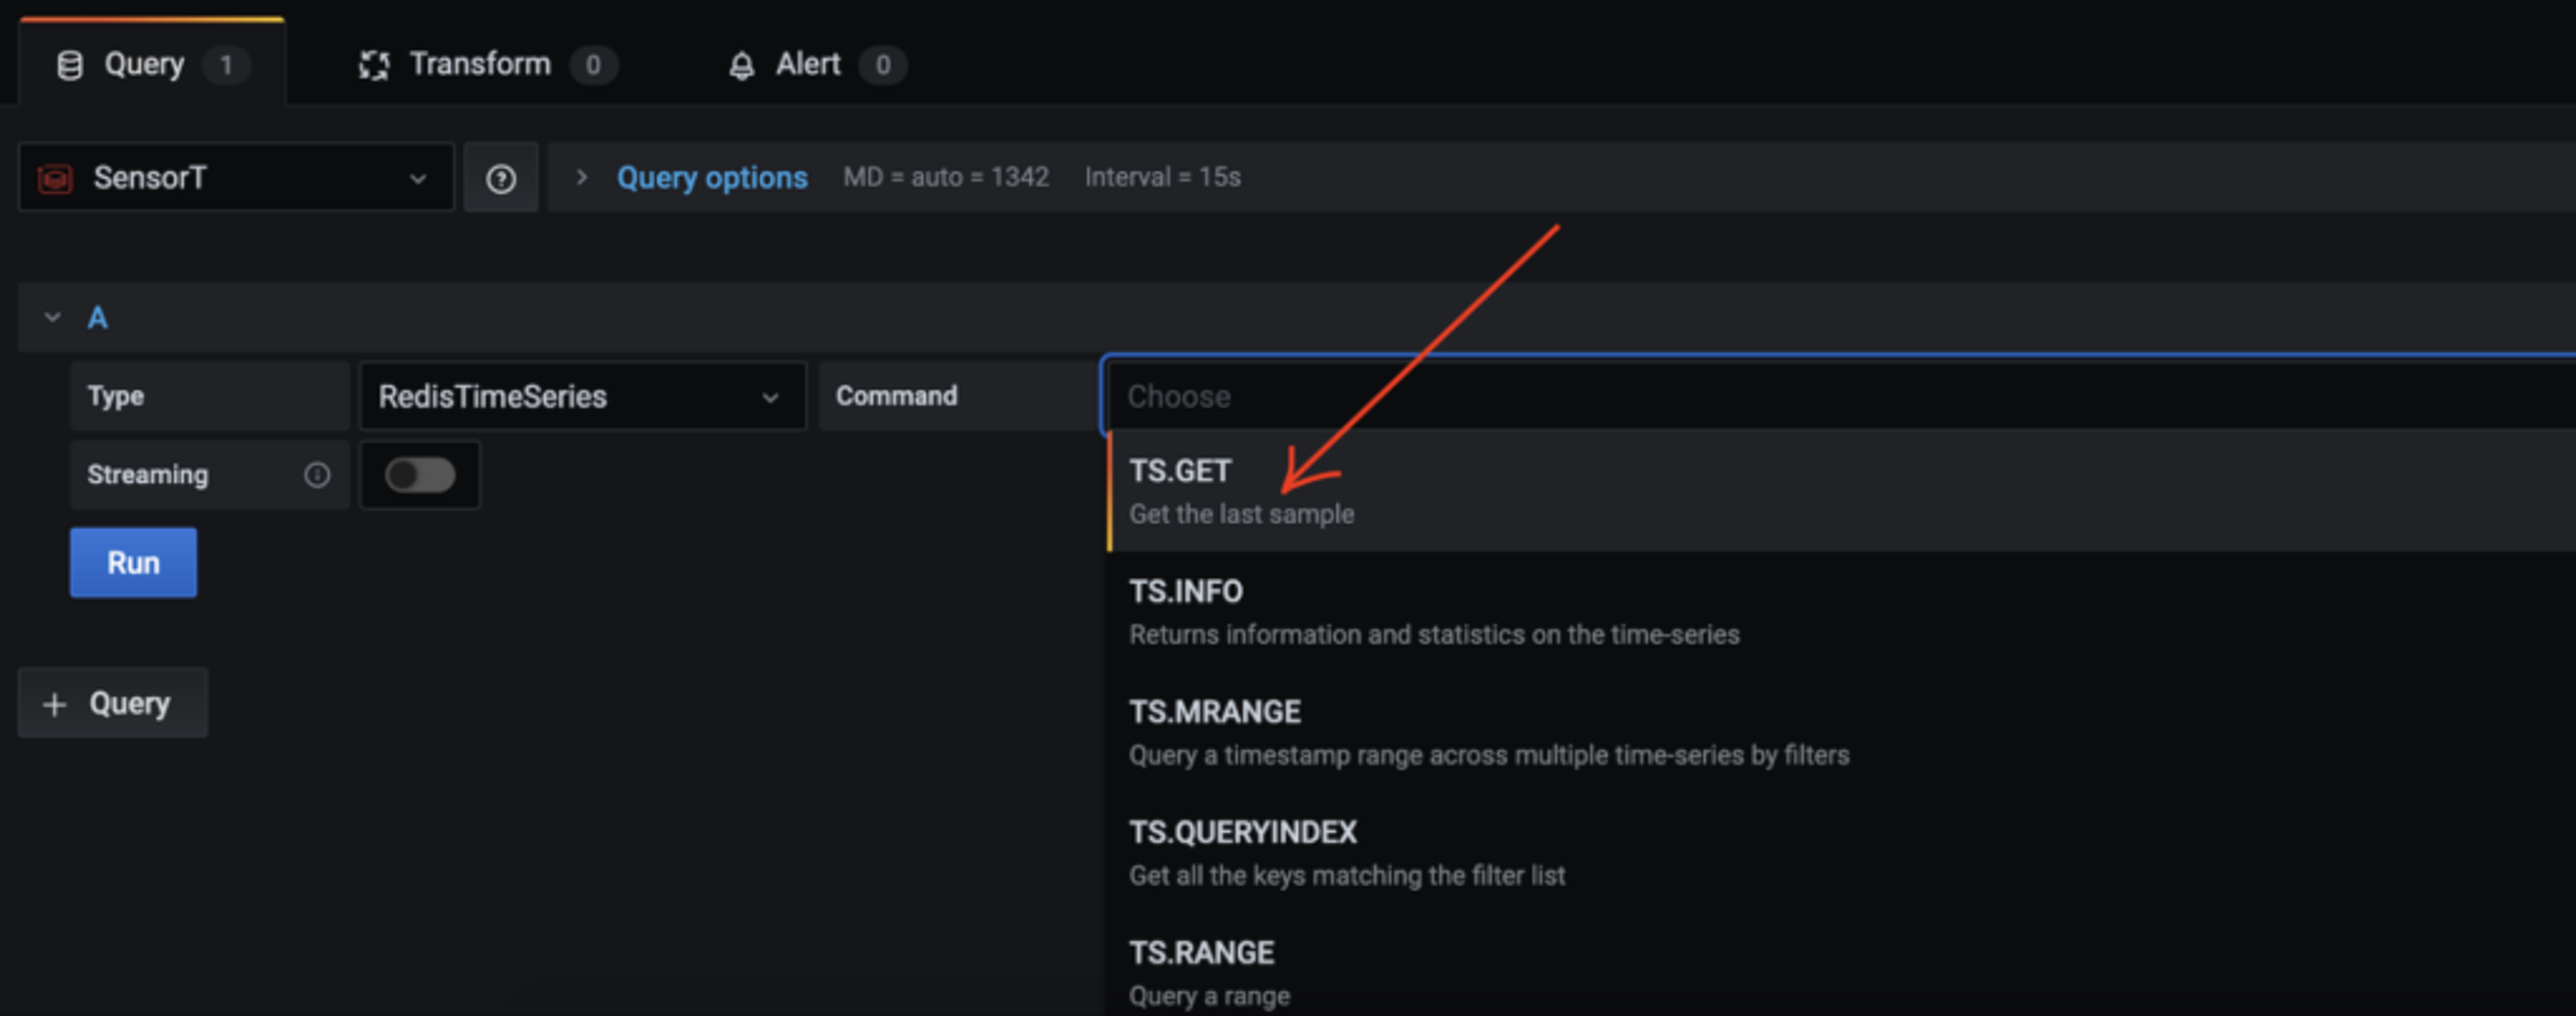
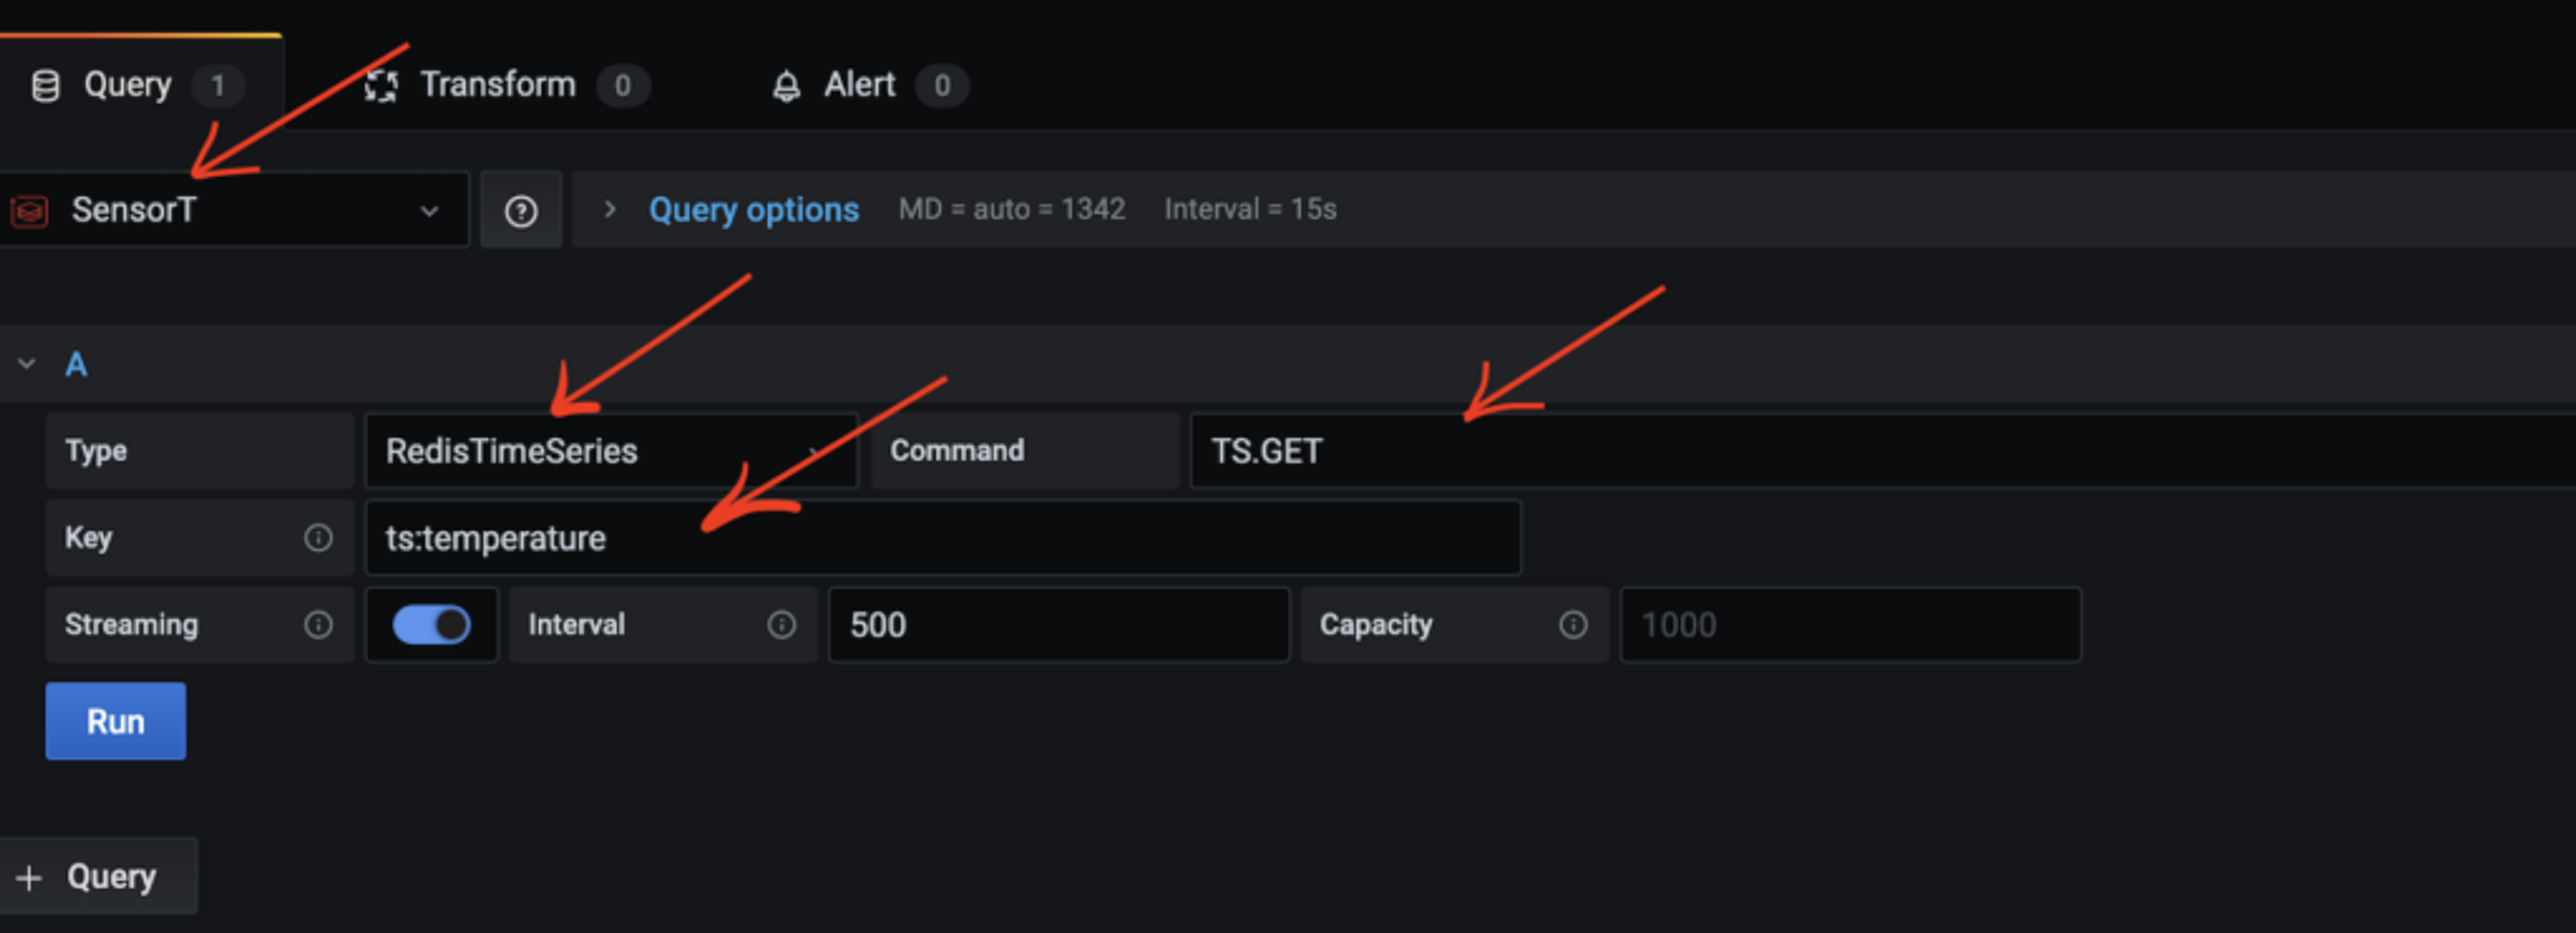
A new window will open showing the Query section. Select SensorT from the drop-down menu, choose RedisTimeSeries as type, TS.GET as command and ts”temperature as key.
Choose TS.GET as a command.
Type ts”temperature as the key.
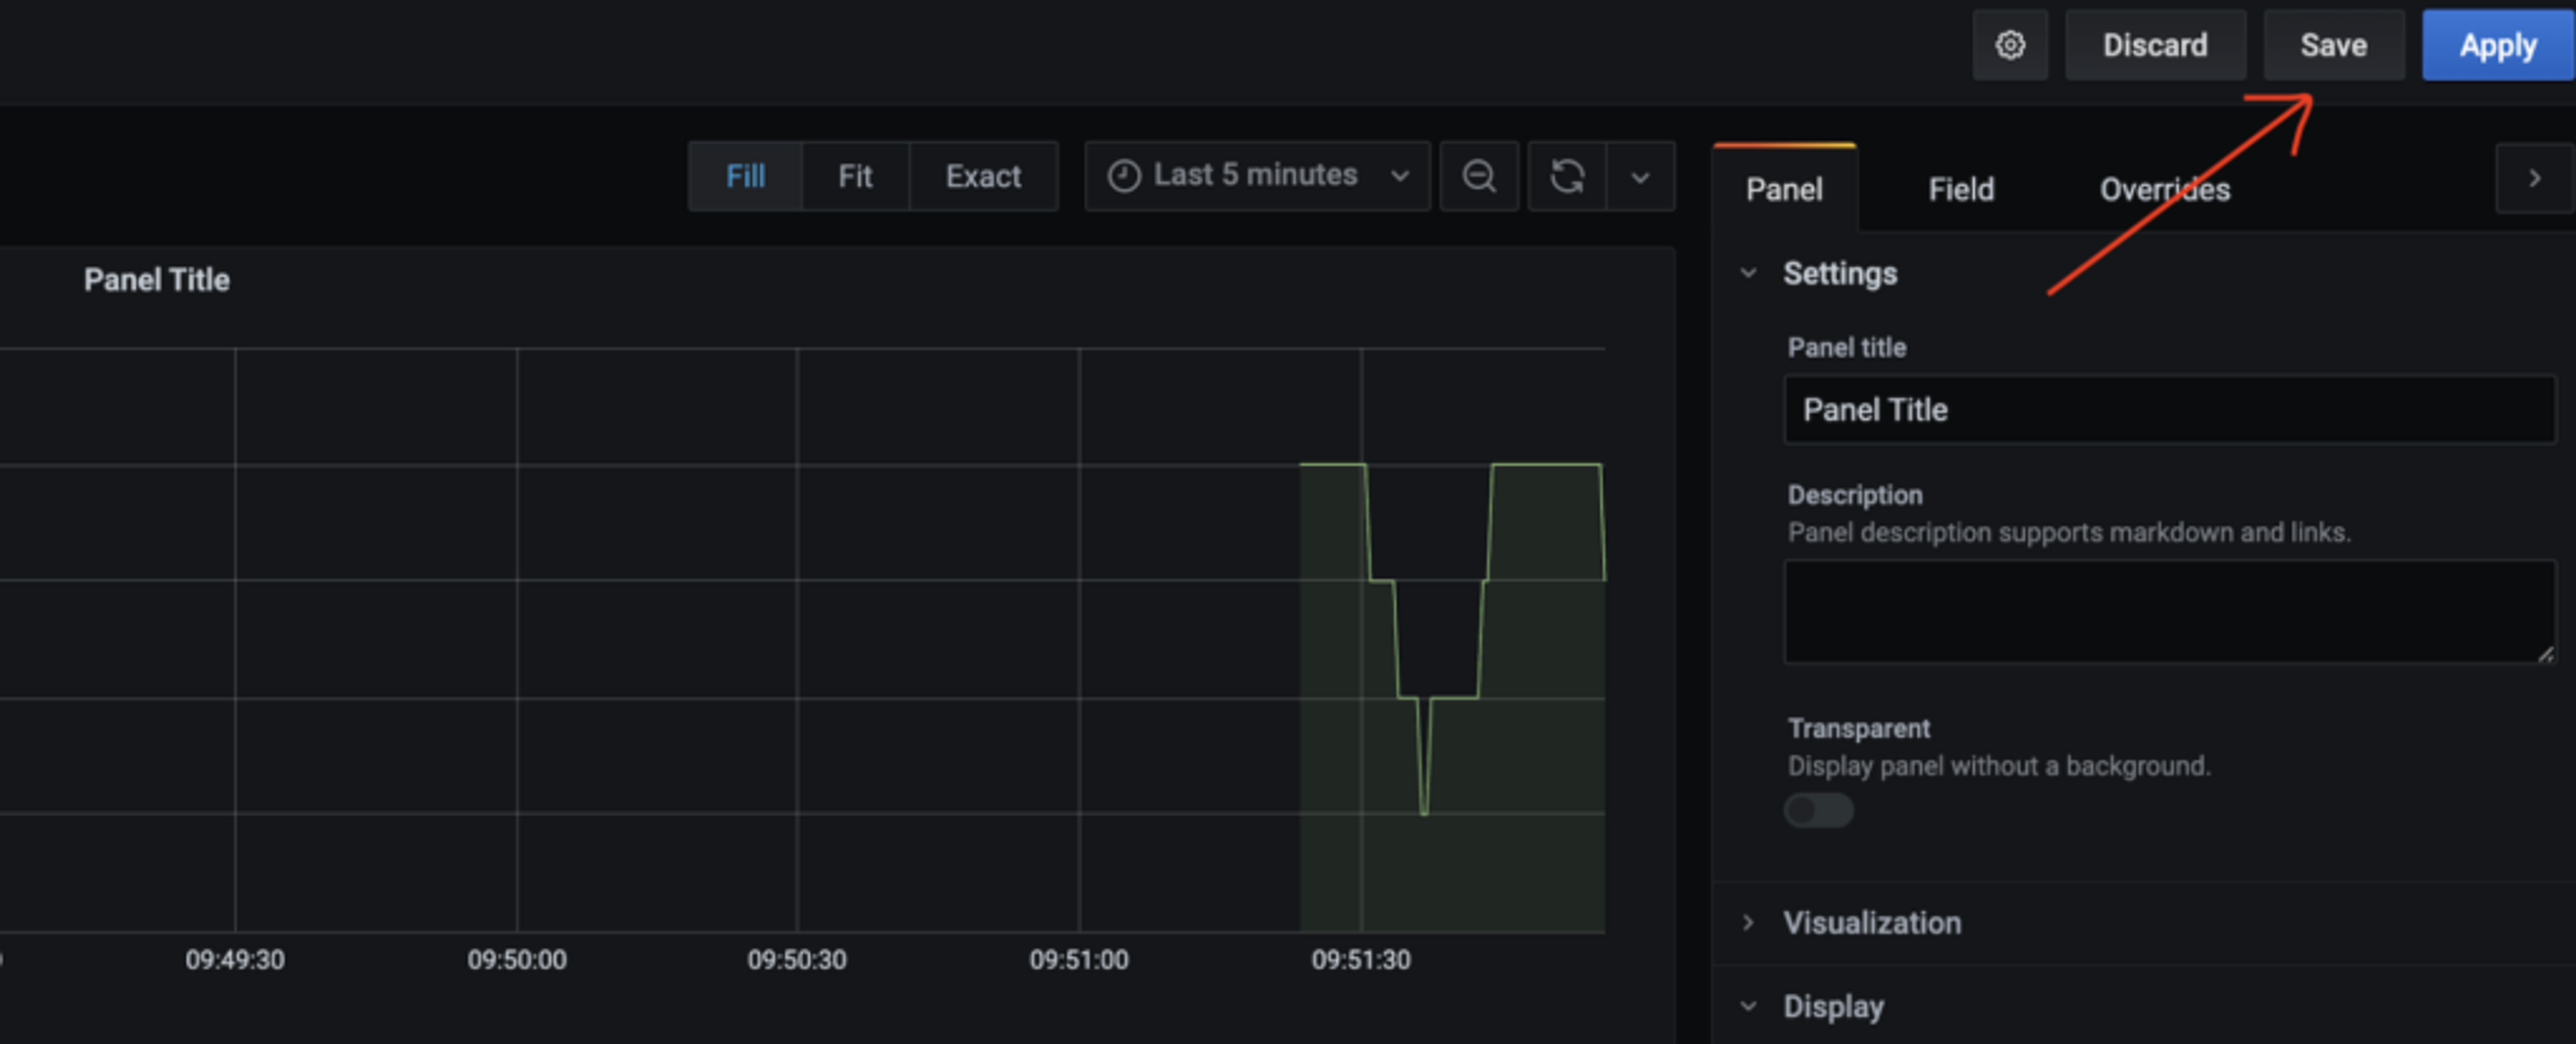
Click Run followed by Save, as shown below:
Now you can save the dashboard by your preferred name:
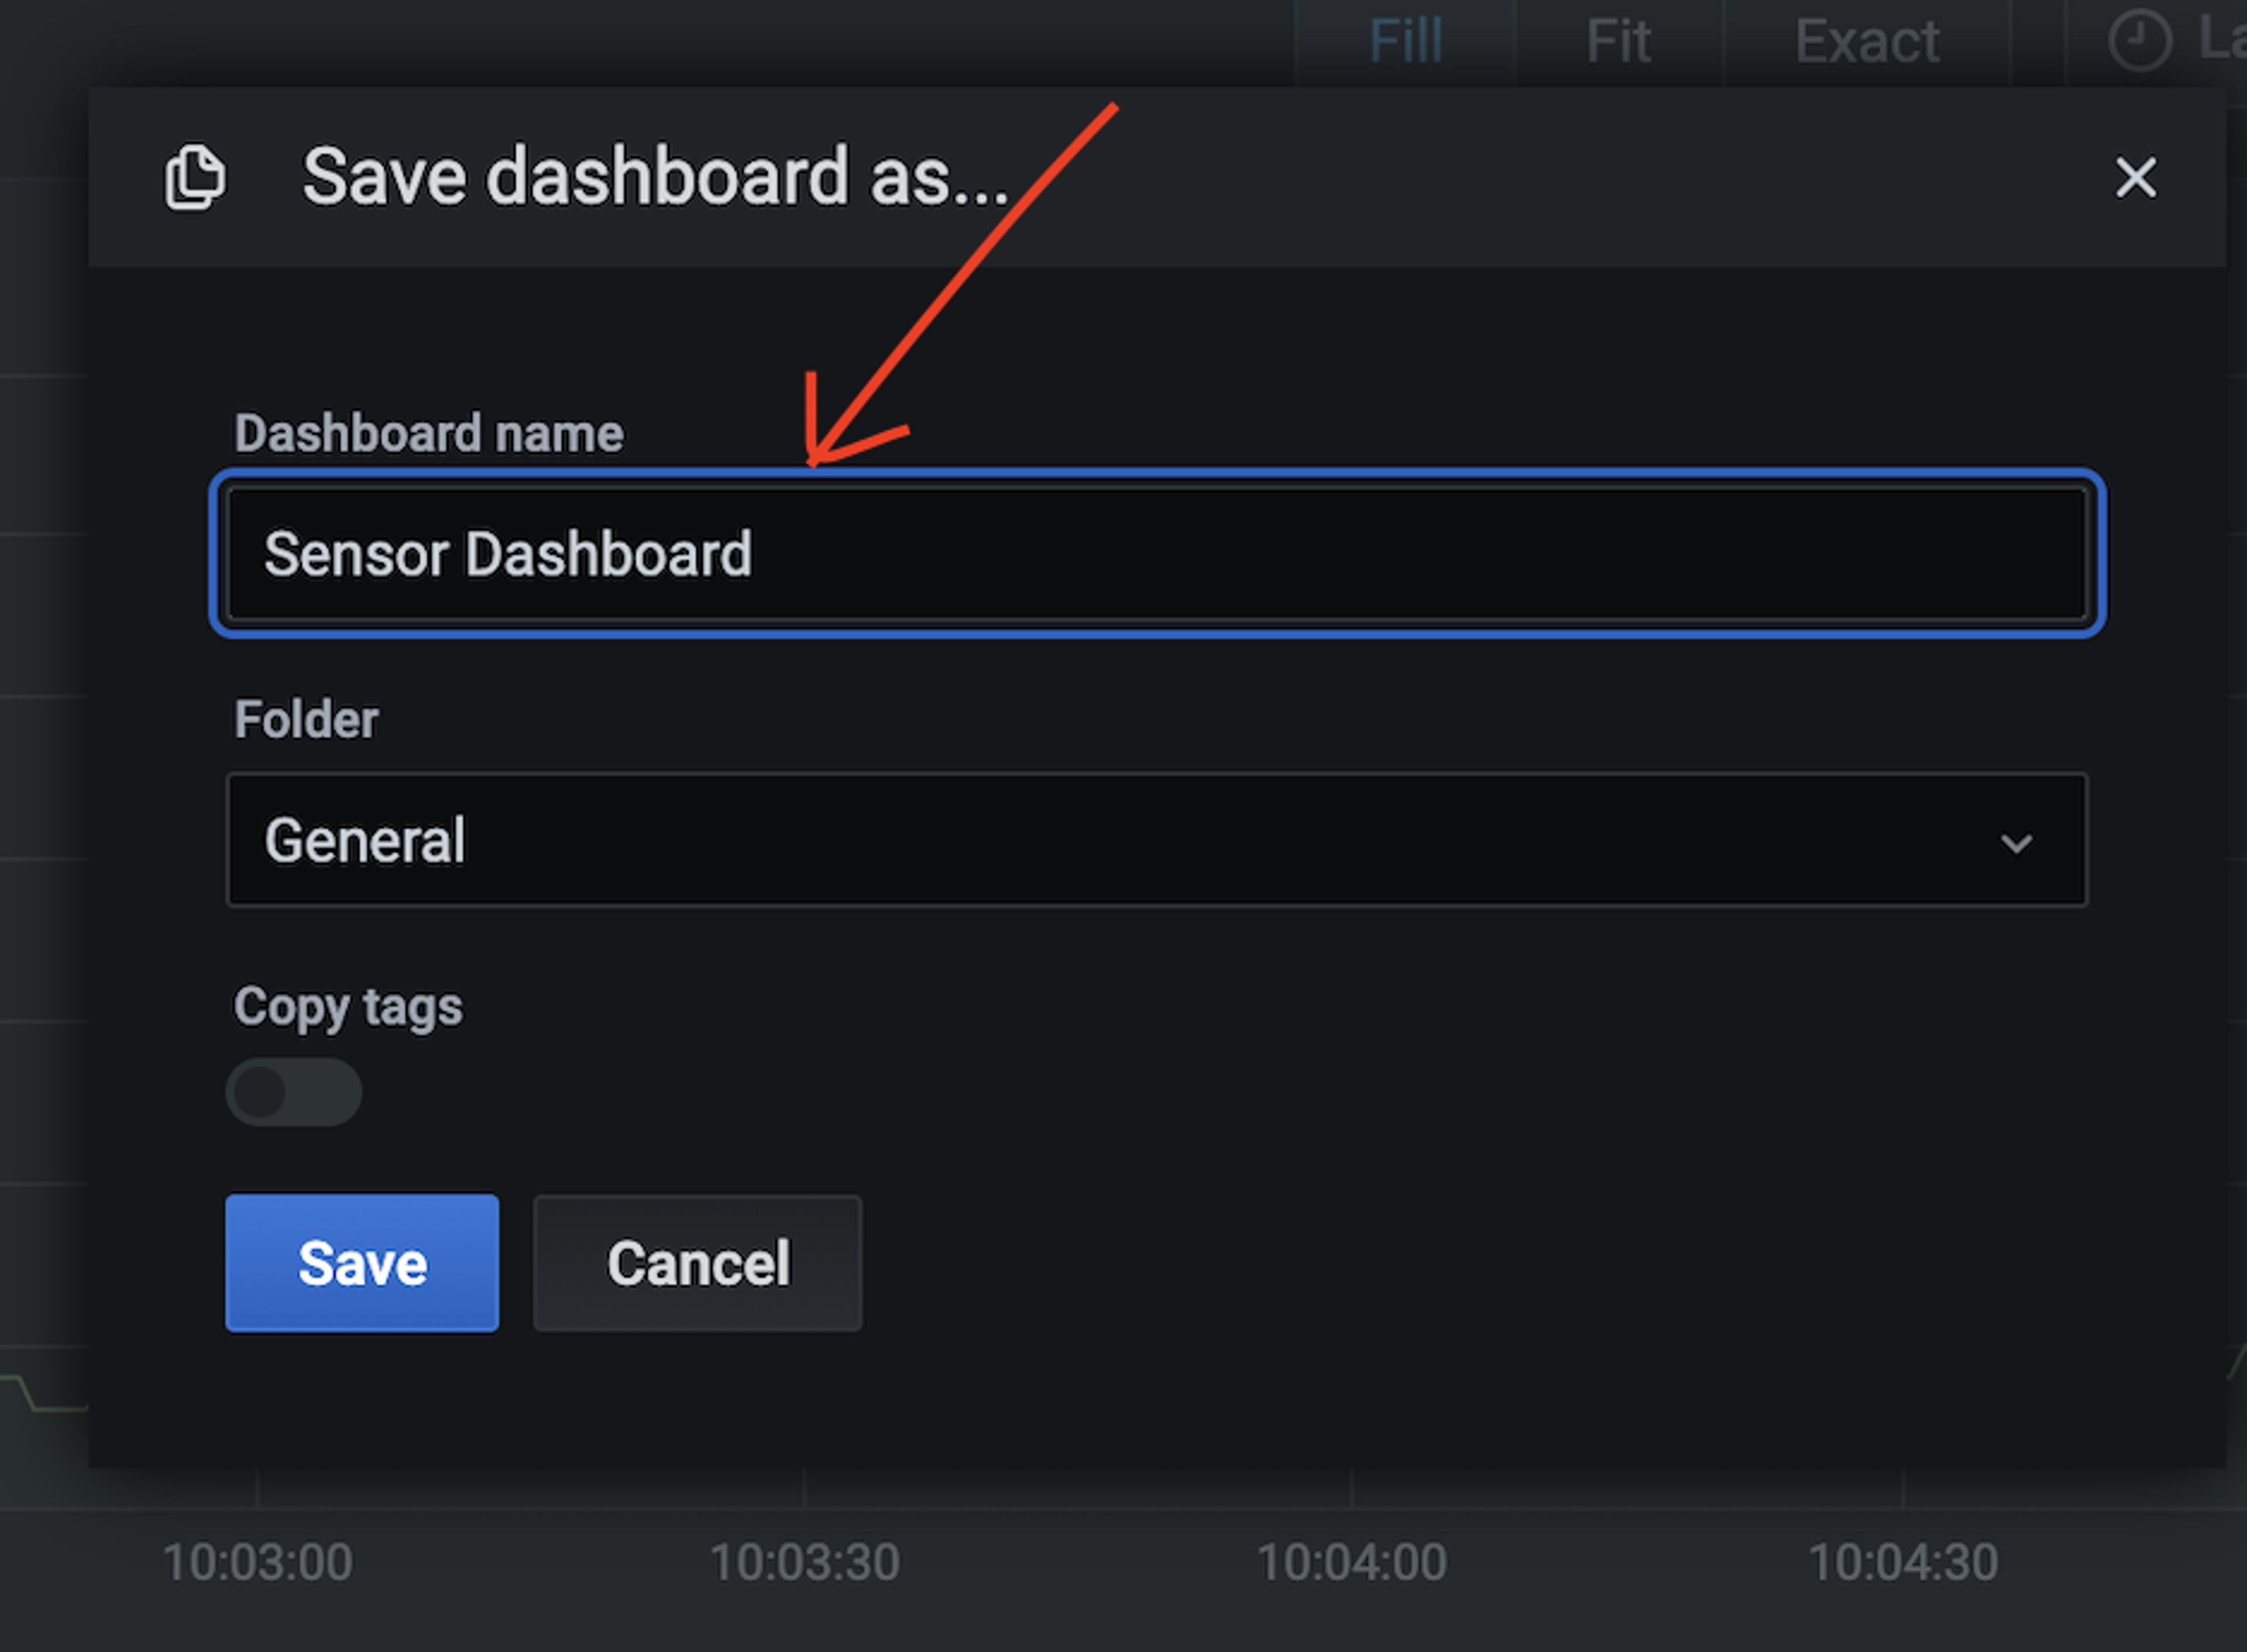
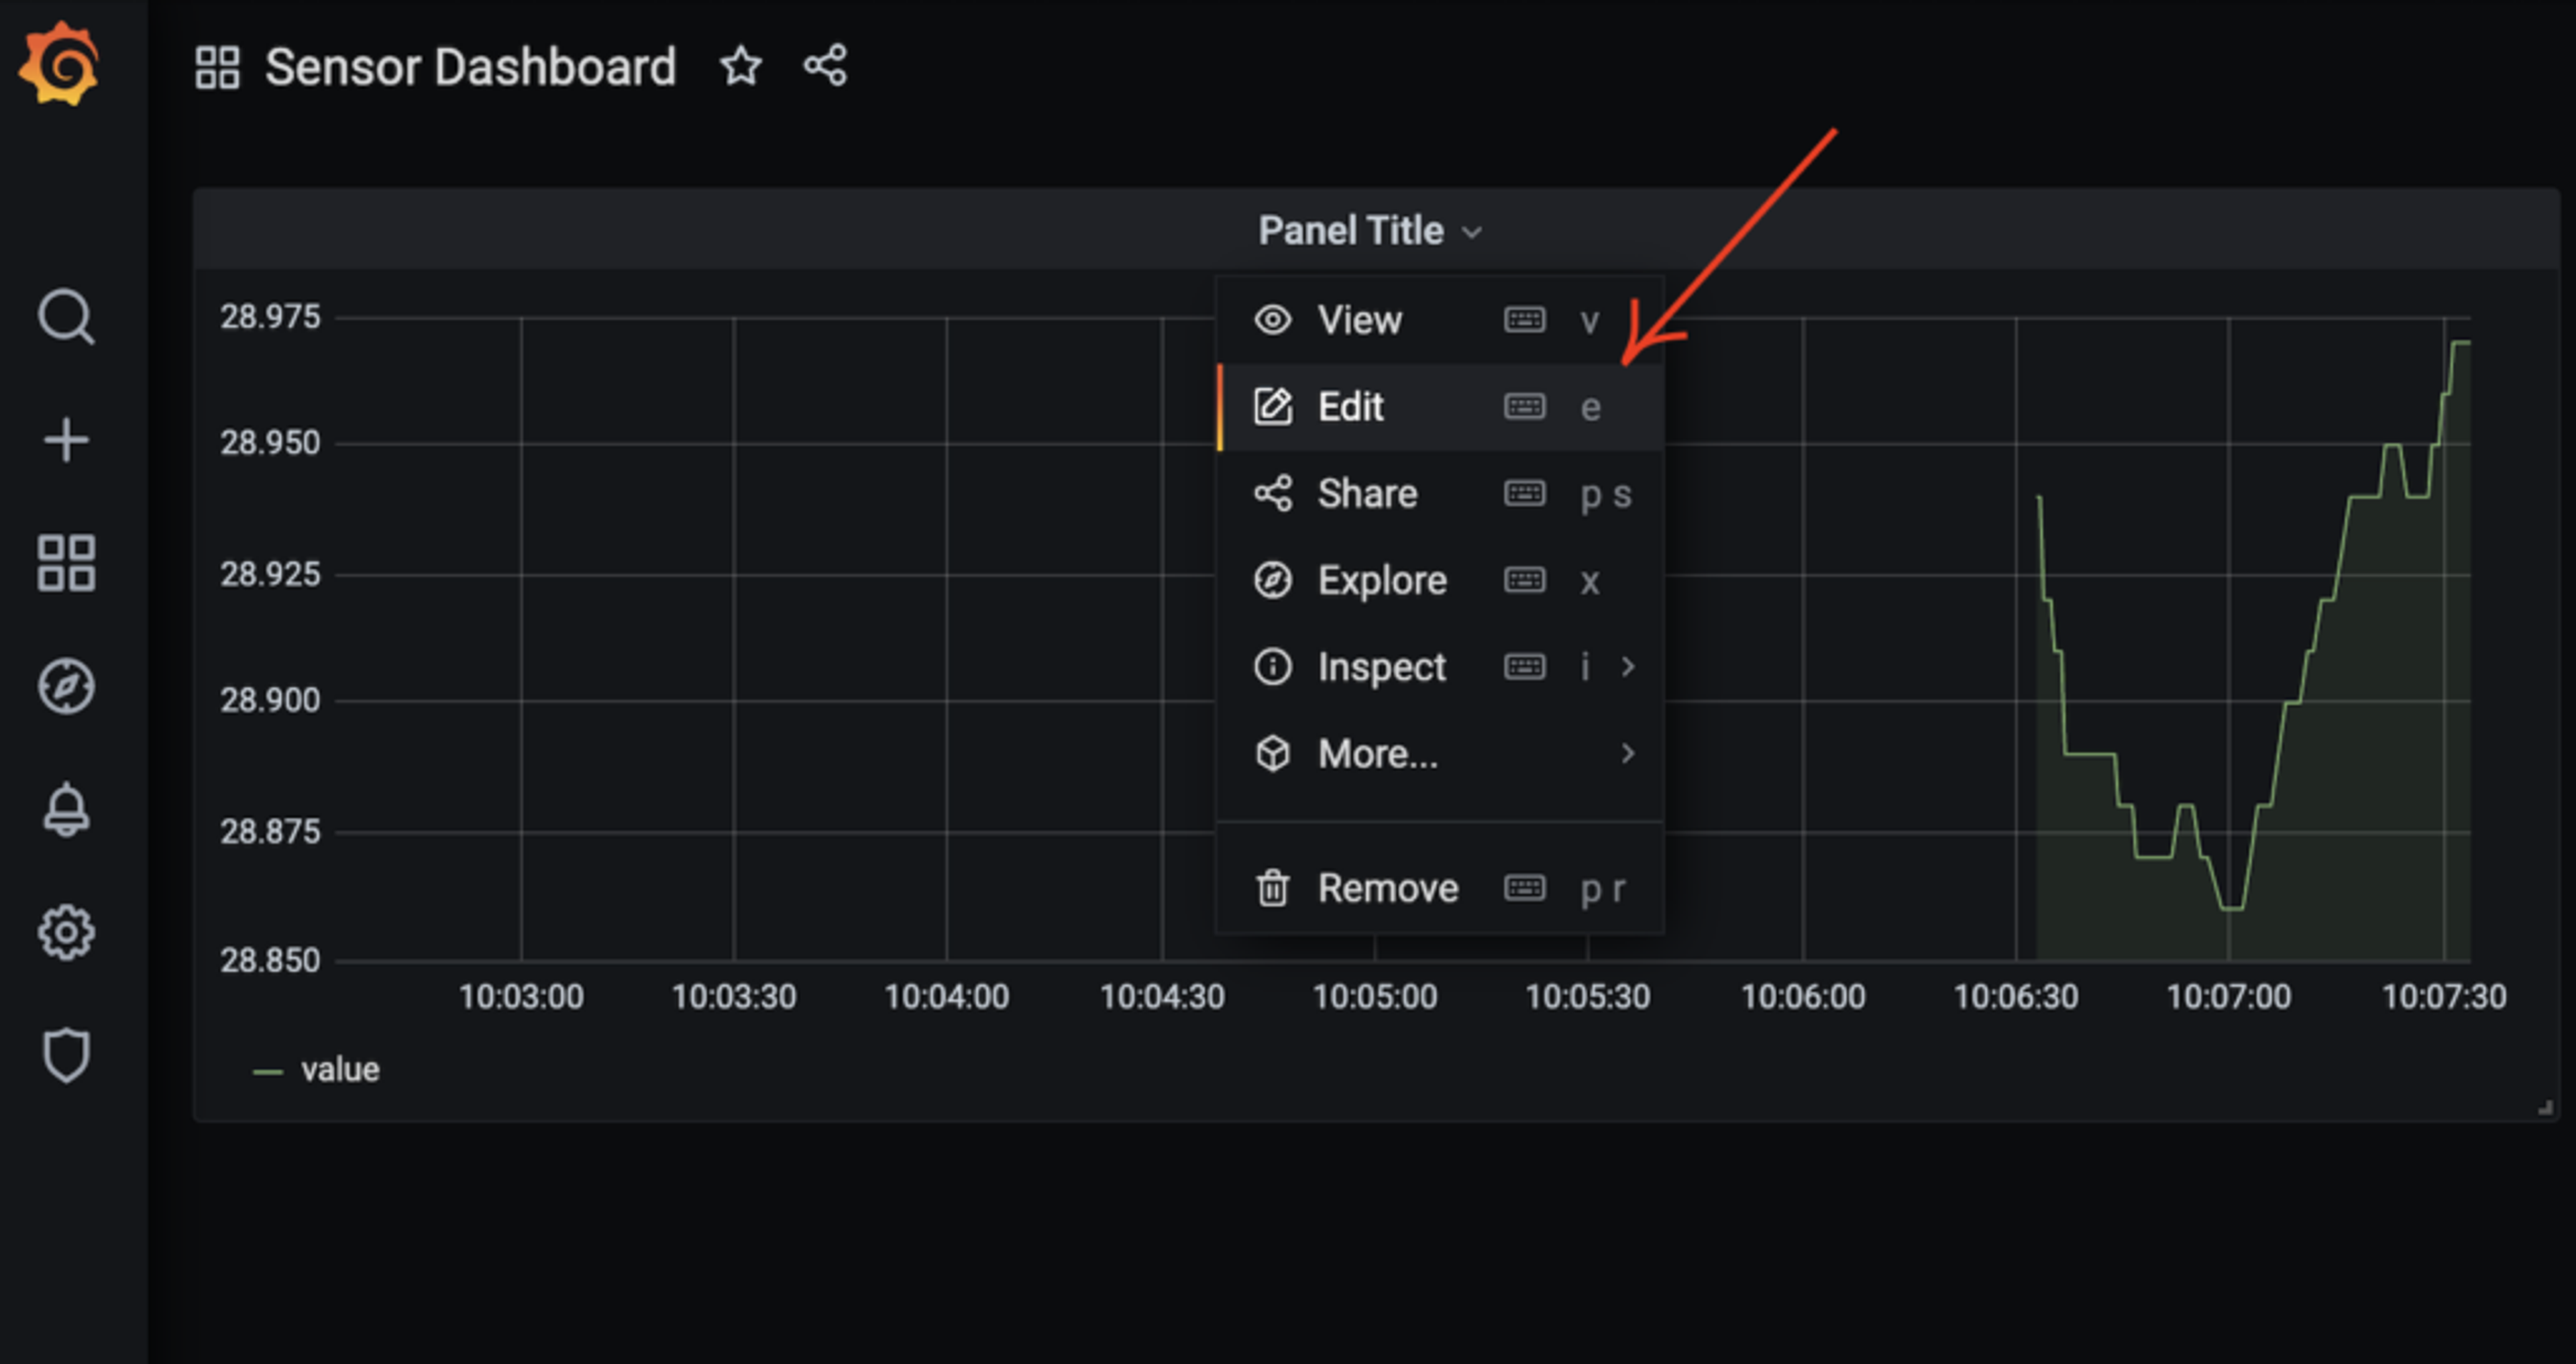
Click Save. This will open up a sensor dashboard. You can click on Panel Title and select Edit.
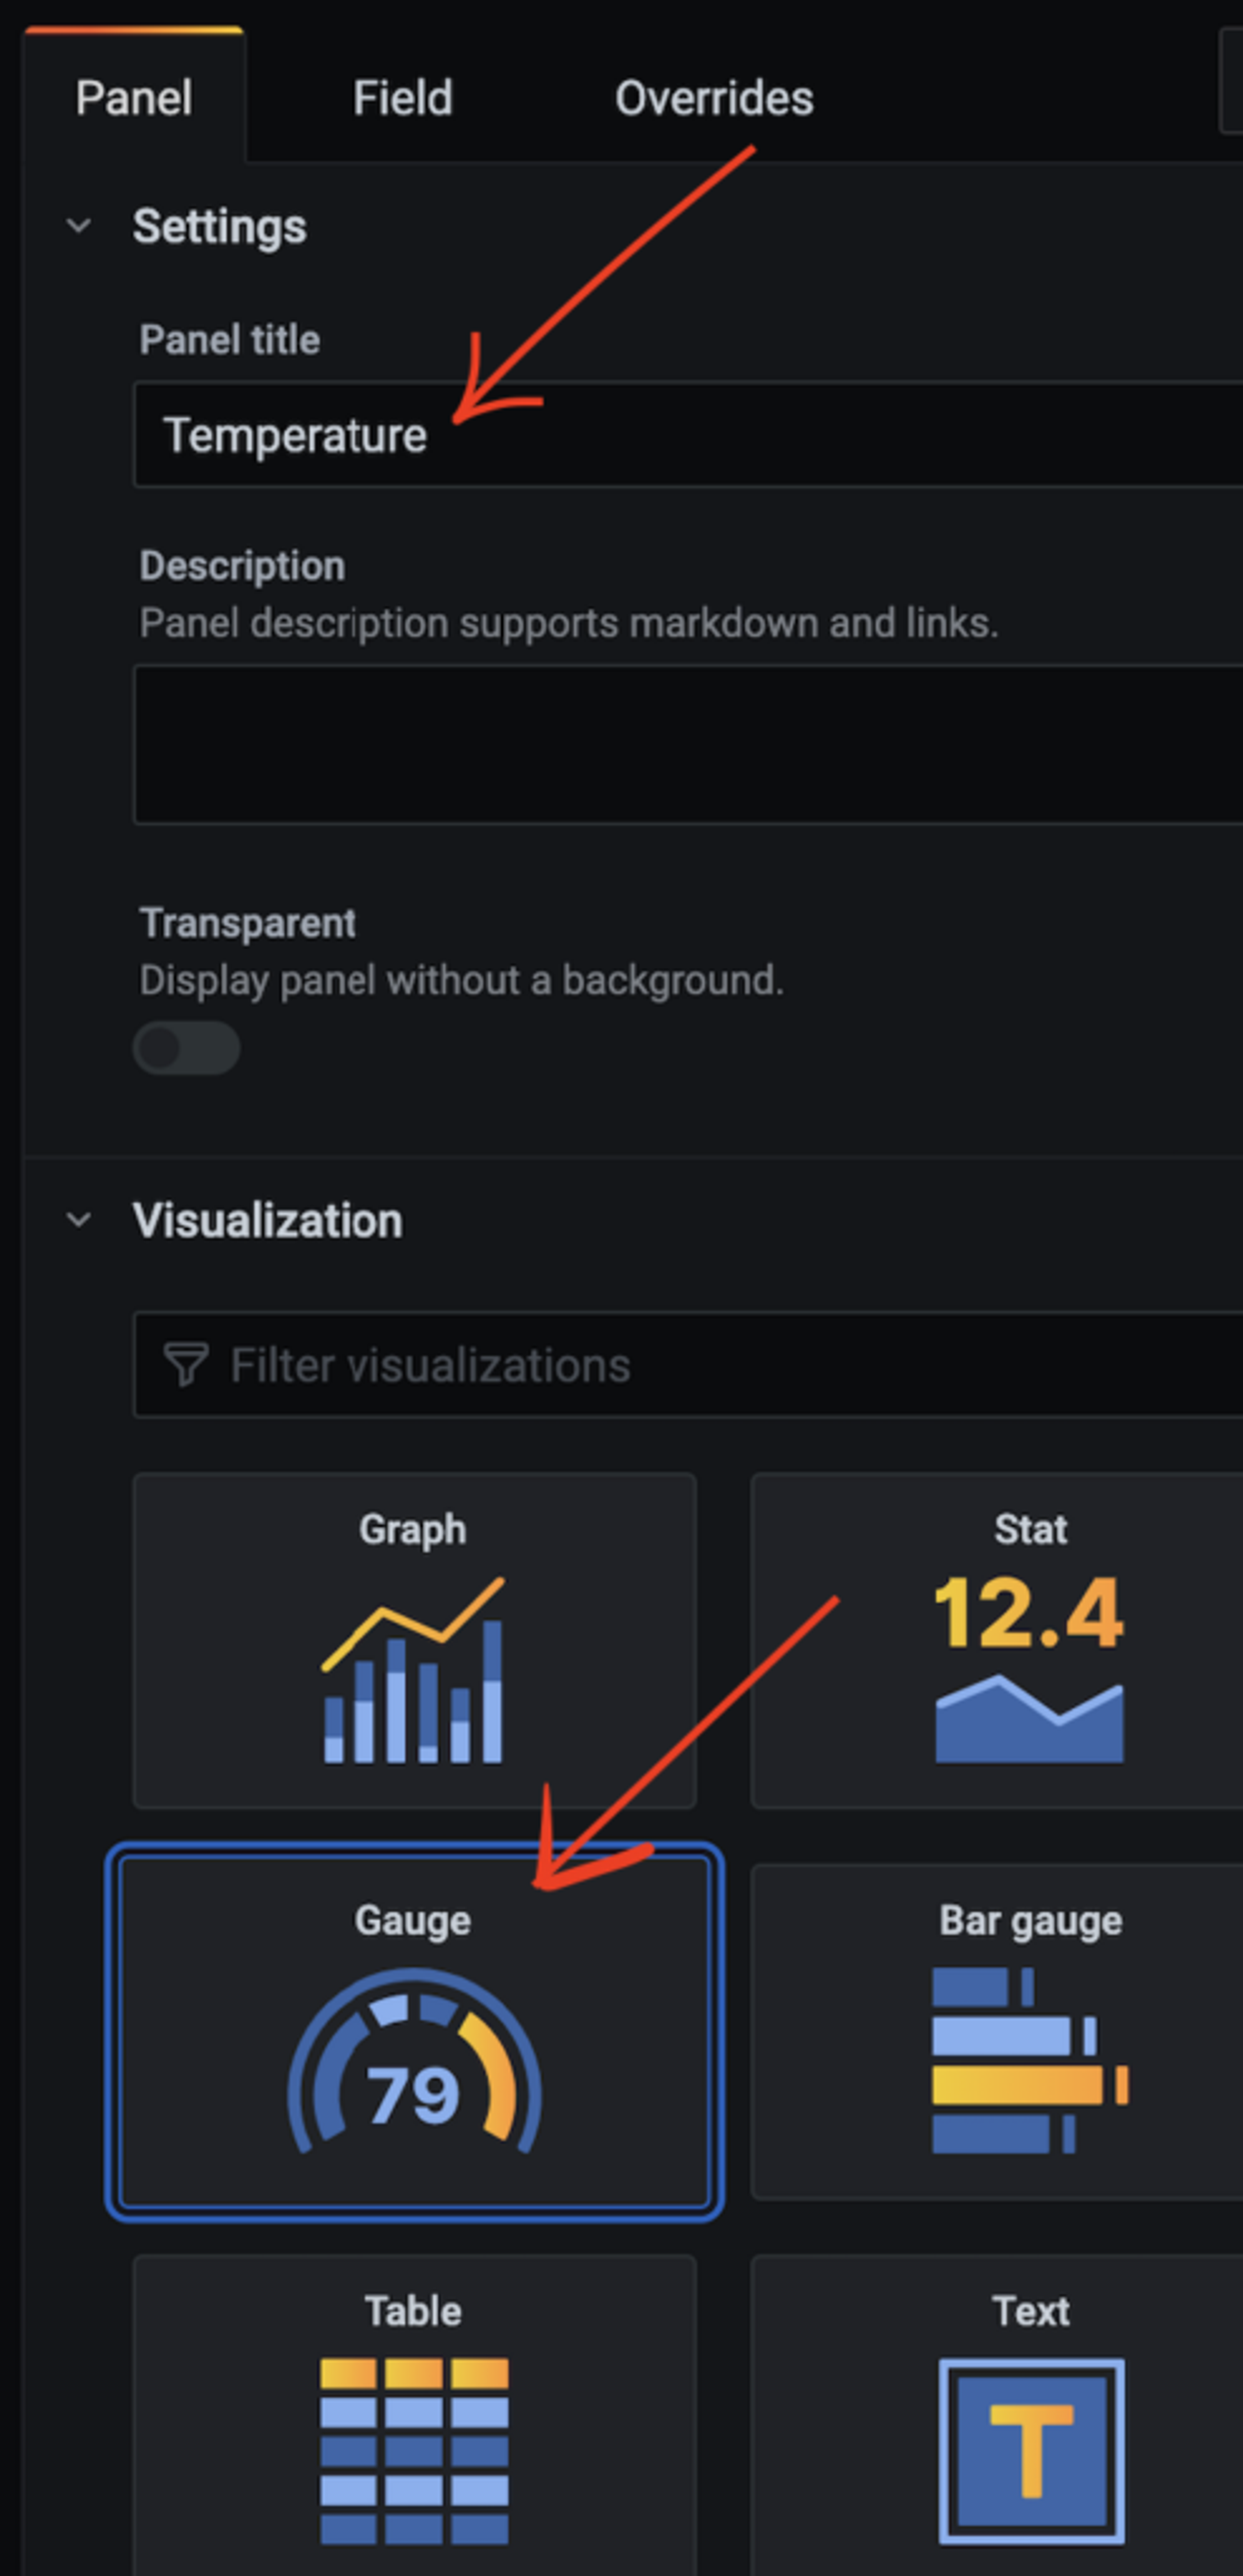
Type Temperature and choose Gauge under Visualization.
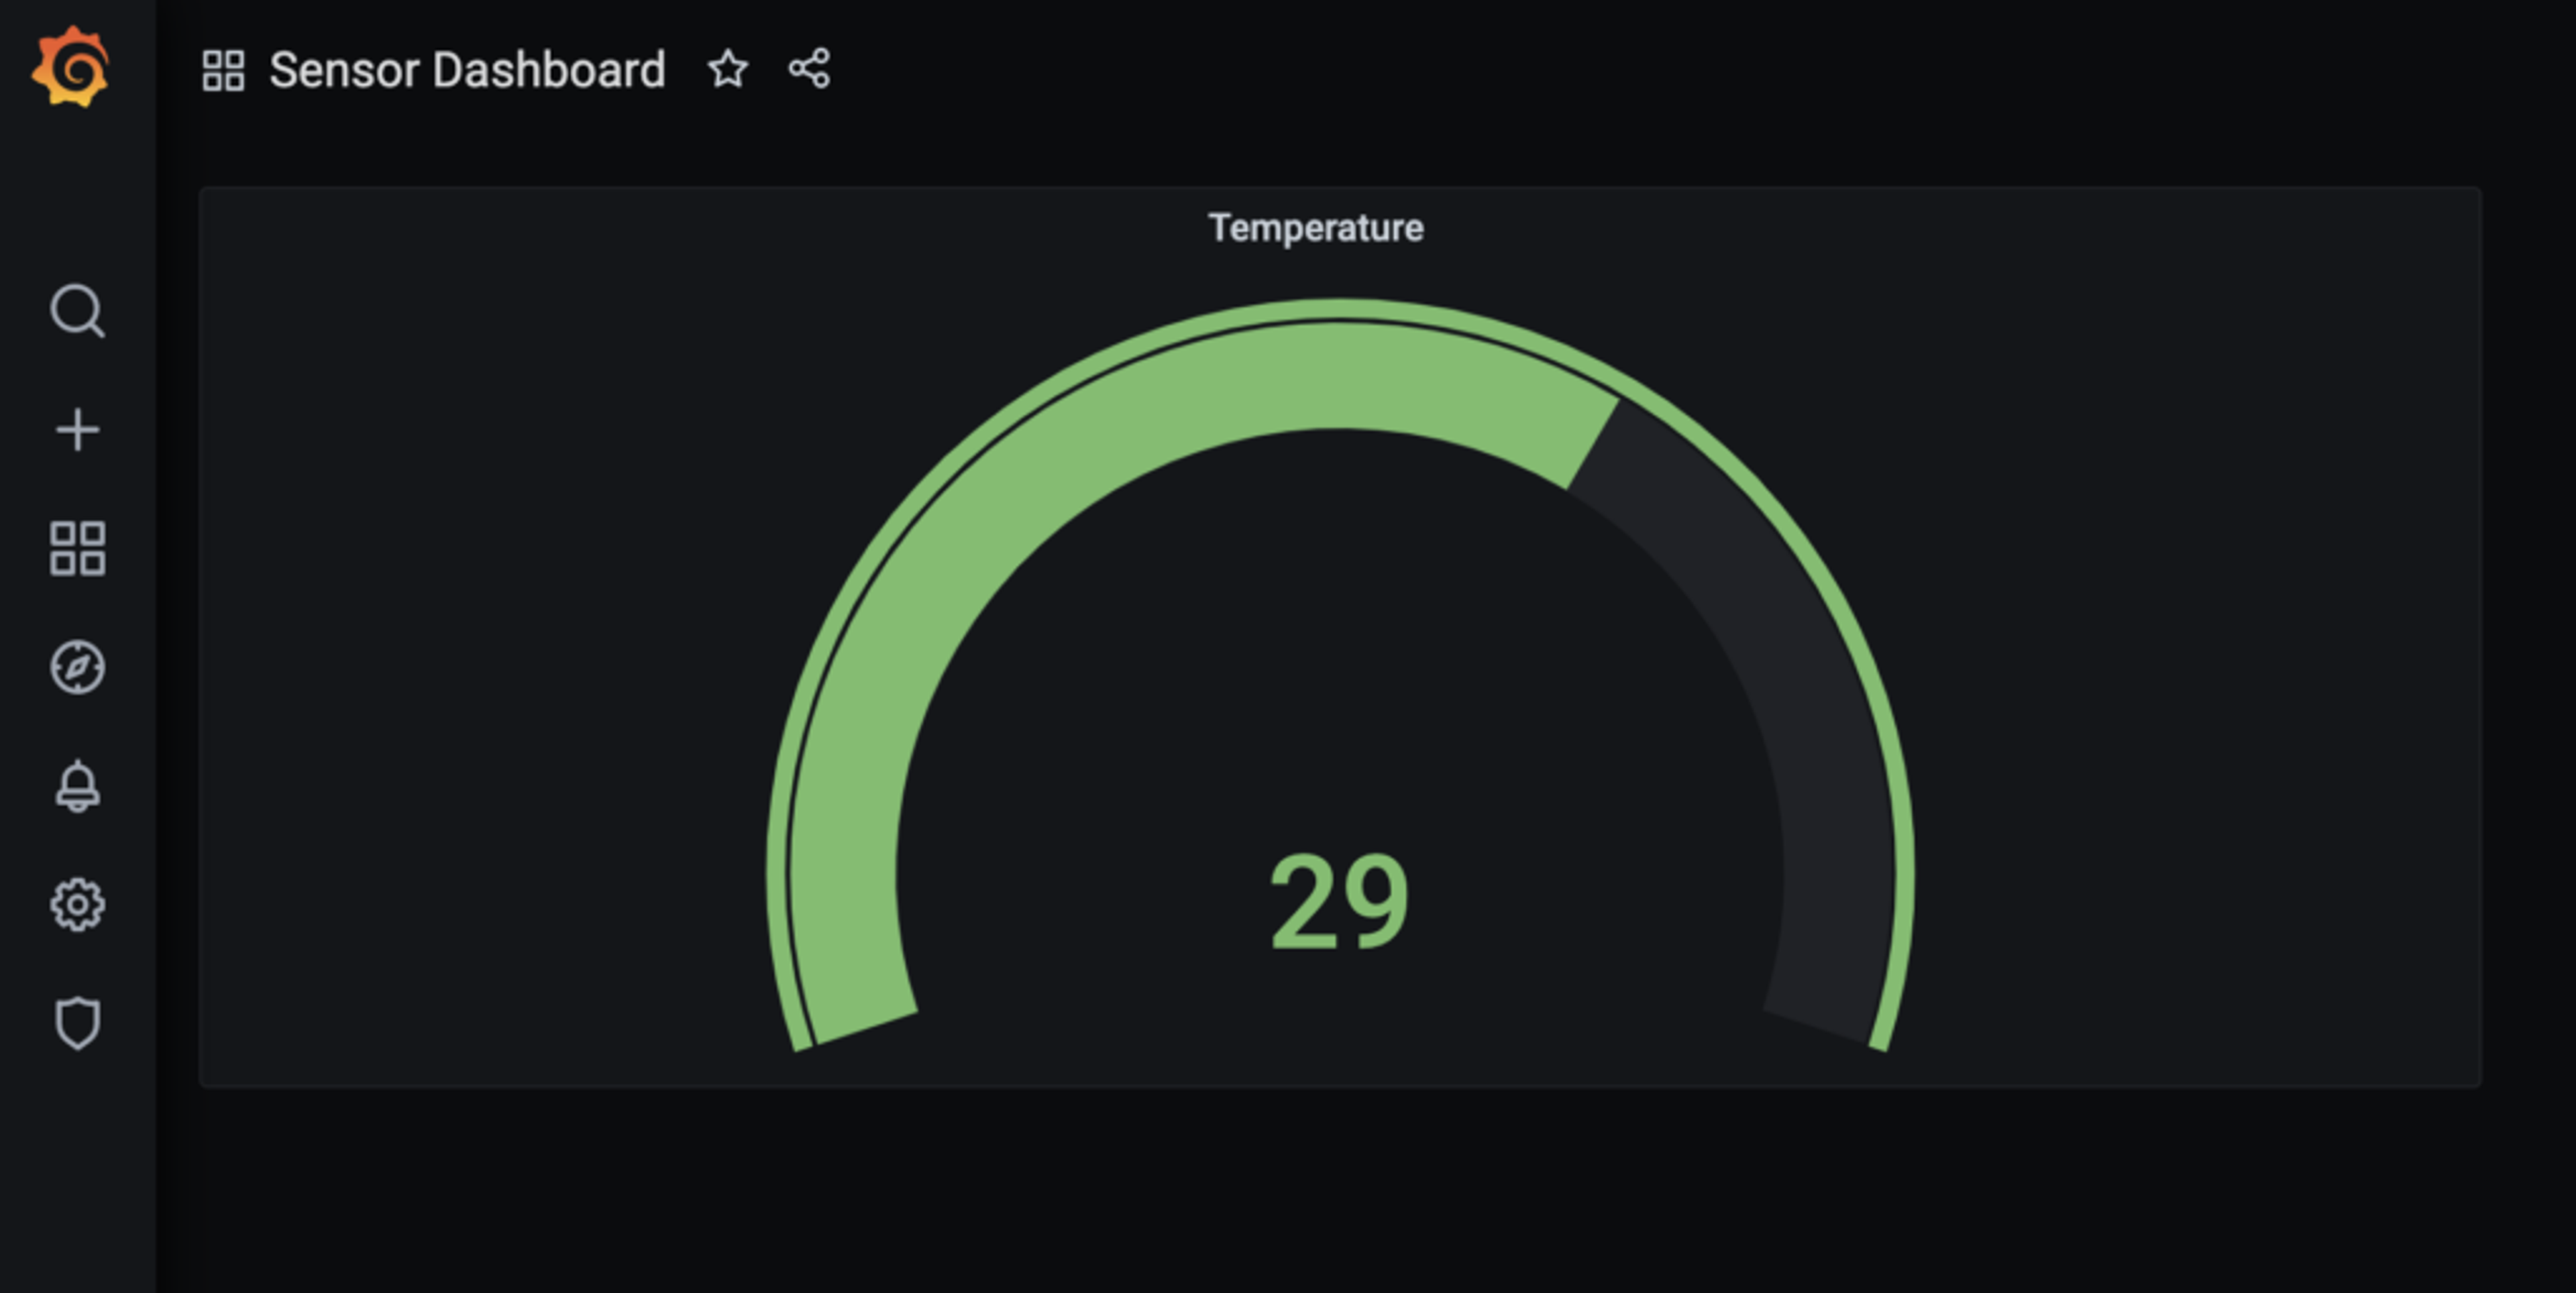
Click Apply and you should be able to see the temperature dashboard as shown here:
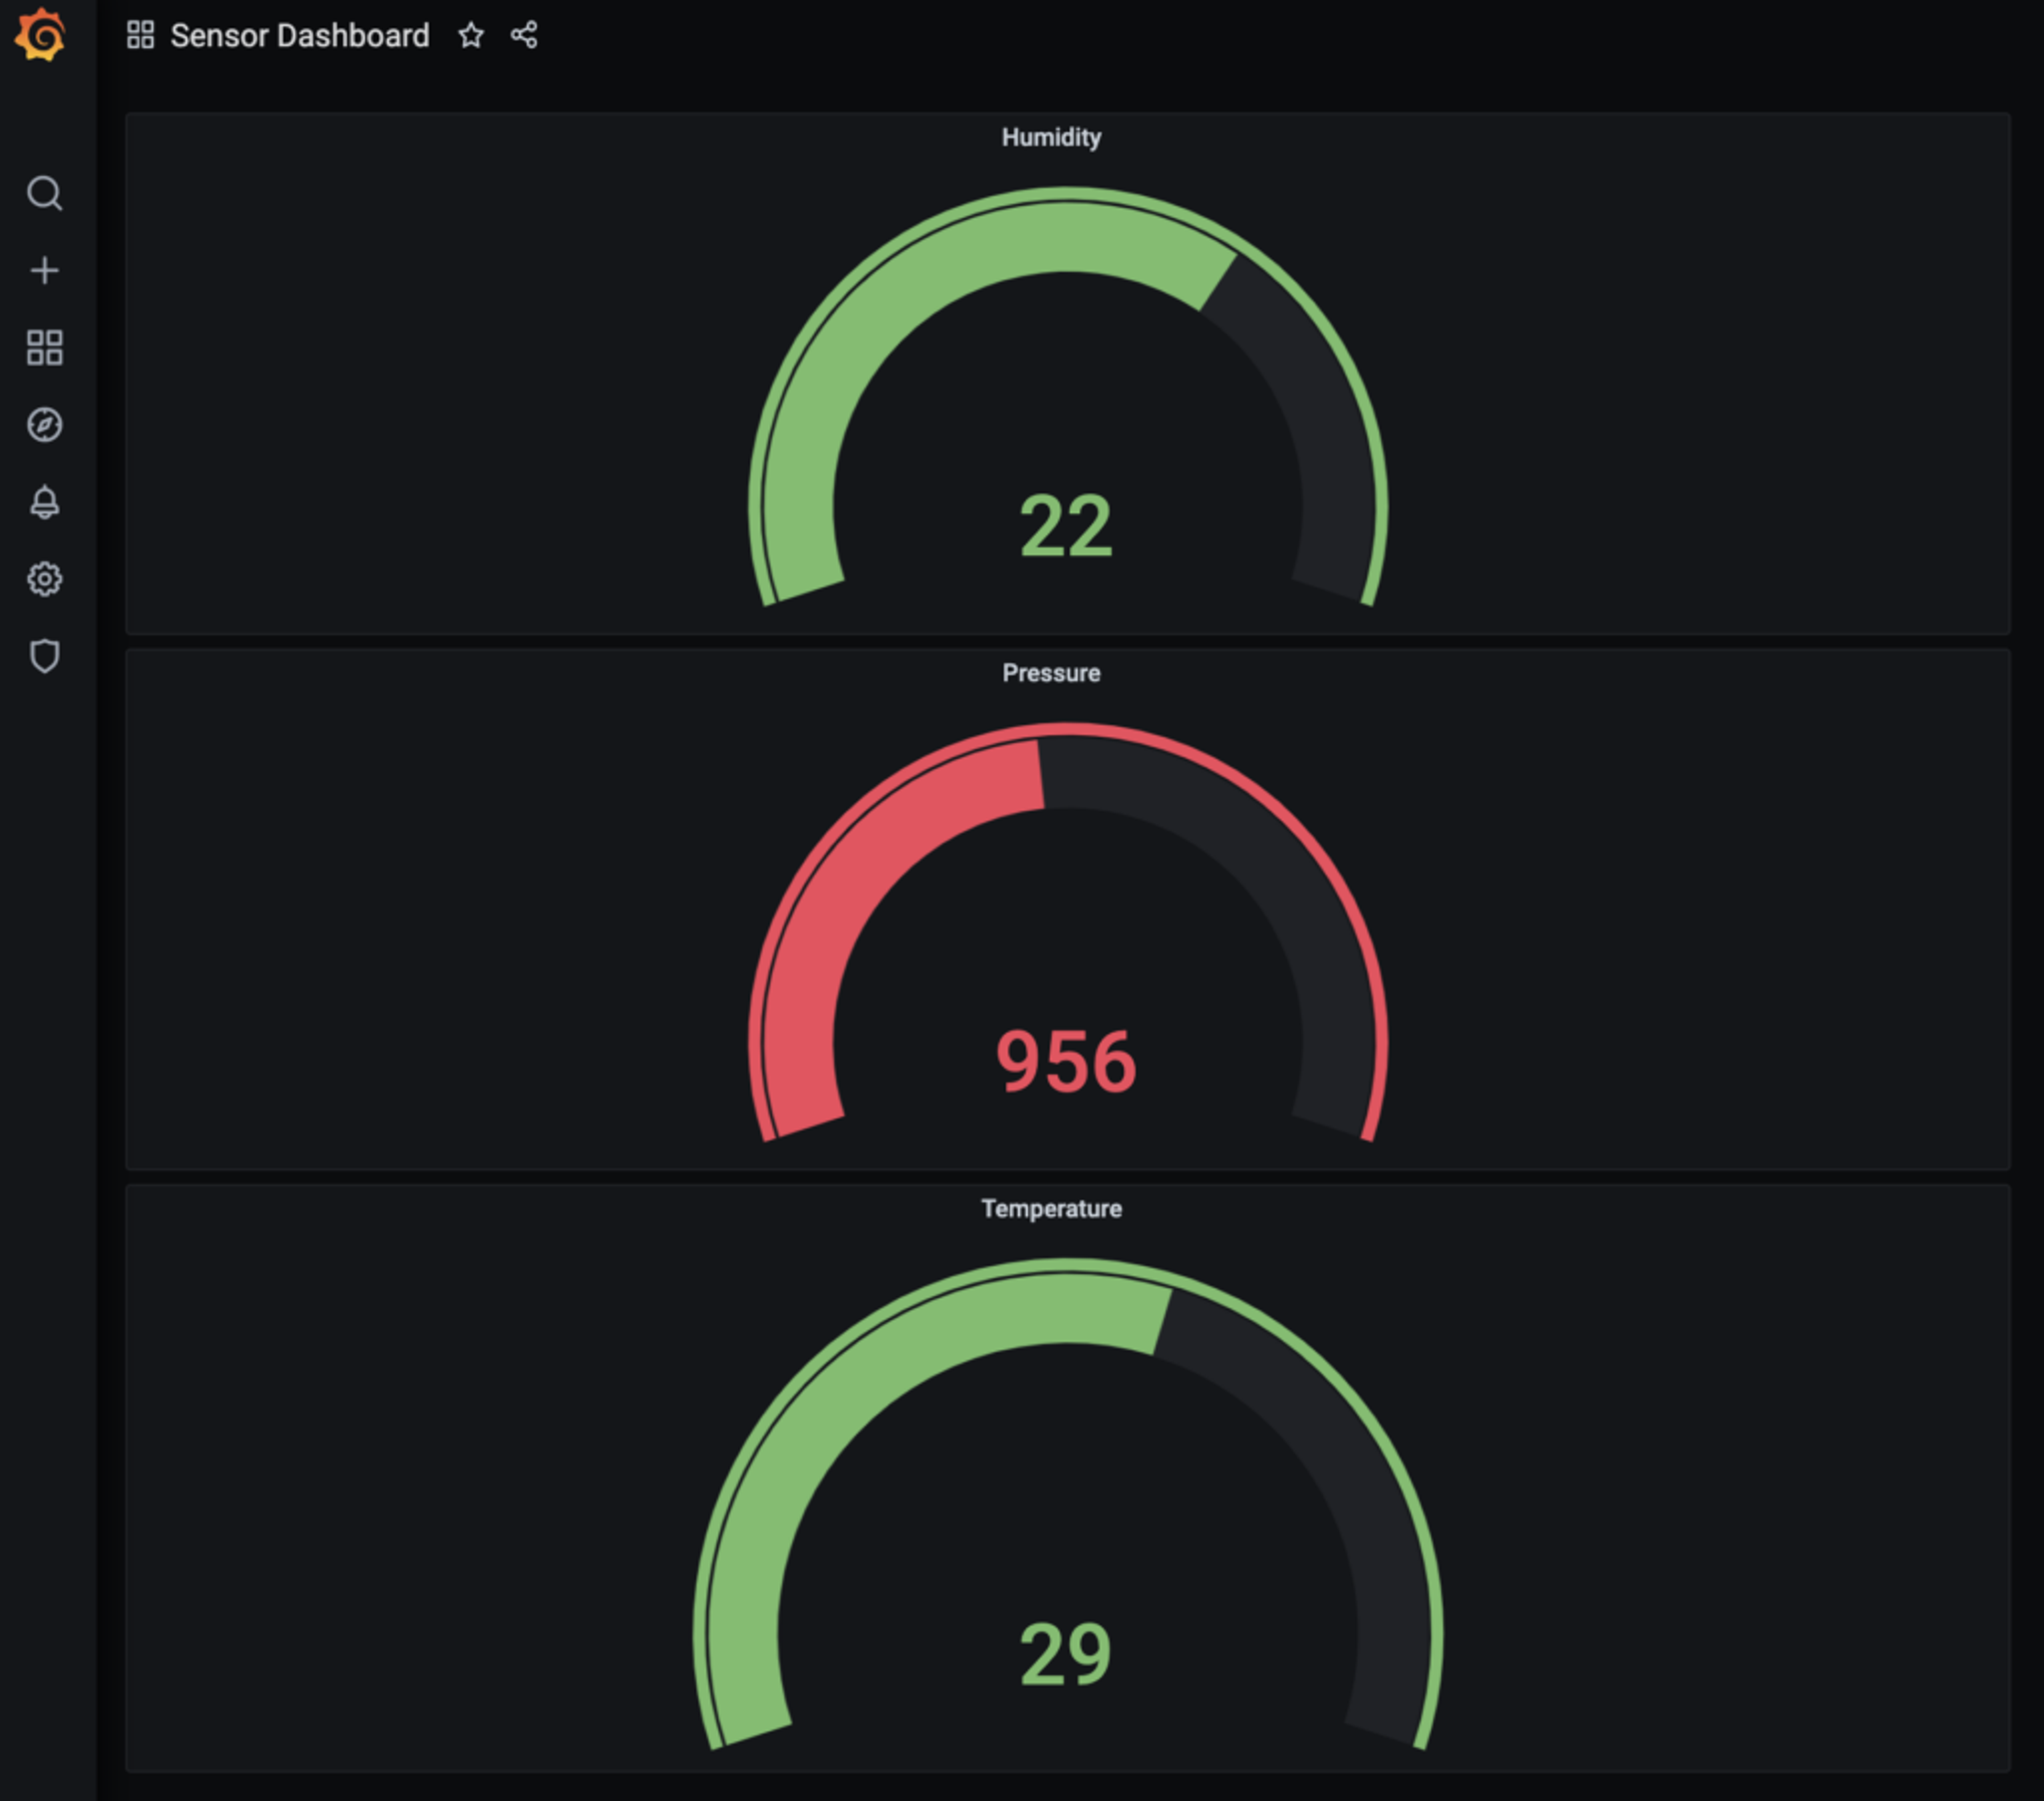
Follow the same process for pressure (ts:pressure) and humidity (ts:humidity), and add them to the dashboard. You should be able to see the complete dashboard readings for temperature, humidity, and pressure. Looks amazing. Isn’t it?
What’s next
This demo shows how RedisTimeSeries combines the benefits of Redis and a purpose-built time-series database. The combination allows you to easily track environmental factors by effectively storing and managing RedisTimeSeries data. Finally, by integrating Grafana with RedisTimeSeries, you can create a useful, informative dashboard that lets you zoom in and out on the charts in real time.
This sample application is just one example of the many cool things you can do with RedisTimeSeries. For more ideas, check out these interesting use cases:
Build Your Financial Application on RedisTimeSeries
Get started with Redis today
Speak to a Redis expert and learn more about enterprise-grade Redis today.
