Learn more

Today, we’re happy to announce the General Availability of RedisTimeSeries 1.6. This blog post details the major new features that are now available.
RedisTimeSeries is a high-performance, memory-first time-series data structure for Redis. RedisTimeSeries supports time series multi-tenancy (it can hold many time series simultaneously) and can serve multiple clients accessing these time series simultaneously. It is now available also as part of Redis Stack.
Before version 1.6, only one type of aggregation was possible:
Since version 1.6, two new aggregation types are possible:
Let’s demonstrate the first new aggregation type. First, let’s create two stocks, and add their prices at 3 different timestamps:
TS.CREATE stock:A LABELS type stock name A
TS.CREATE stock:B LABELS type stock name B
TS.MADD stock:A 1000 100 stock:A 1010 110 stock:A 1020 120
TS.MADD stock:B 1000 120 stock:B 1010 110 stock:B 1020 100
Now, we can retrieve the maximal stock price per timestamp:
redis:6379> TS.MRANGE - + WITHLABELS FILTER type=stock GROUPBY type
REDUCE max
| 1) 1) "type=stock" 2) 1) 1) "type" 2) "stock" 2) 1) "__reducer__" 2) "max" 3) 1) "__source__" 2) "stock:A,stock:B" 3) 1) 1) (integer) 1000 2) 120 2) 1) (integer) 1010 2) 110 3) 1) (integer) 1020 2) 120 |
The FILTER type=stock clause leaves us only with a single time series representing stock prices. The GROUPBY type REDUCE max clause splits the time series into groups with identical type values, and then, for each timestamp, aggregates all series that share the same type value using the max aggregator.
FILTER label=value is supported by TS.MRANGE and TS.MREVRANGE. Additional filtering clauses are supported as well (see documentation).
Next, we will demonstrate the second new aggregation type:
First, let’s create two stocks, and add their prices at 9 different timestamps.
TS.CREATE stock:A LABELS type stock name A
TS.CREATE stock:B LABELS type stock name B
TS.MADD stock:A 1000 100 stock:A 1010 110 stock:A 1020 120
TS.MADD stock:B 1000 120 stock:B 1010 110 stock:B 1020 100
TS.MADD stock:A 2000 200 stock:A 2010 210 stock:A 2020 220
TS.MADD stock:B 2000 220 stock:B 2010 210 stock:B 2020 200
TS.MADD stock:A 3000 300 stock:A 3010 310 stock:A 3020 320
TS.MADD stock:B 3000 320 stock:B 3010 310 stock:B 3020 300
Now, for each stock, we will calculate the average stock price per 1000 millisecond time frame, and then retrieve the stock with the
maximal average for that timeframe:
redis:6379> TS.MRANGE - + WITHLABELS AGGREGATION avg 1000 FILTER type=stock GROUPBY type REDUCE max
| 1) 1) "type=stock" 2) 1) 1) "type" 2) "stock" 2) 1) "__reducer__" 2) "max" 3) 1) "__source__" 2) "stock:A,stock:B" 3) 1) 1) (integer) 1000 2) 110 2) 1) (integer) 2000 2) 210 3) 1) (integer) 3000 2) 310 |
GROUPBY label REDUCE reducer is supported by TS.MRANGE and TS.MREVRANGE.
Reducer can be sum, min, or max.
When using TS.RANGE, TS.REVRANGE, TS.MRANGE, and TS.MREVRANGE, you don’t always want to retrieve or aggregate all the samples.
Using [FILTER_BY_TS ts...] you can filter the sample by a list of specific timestamps.
Using [FILTER_BY_VALUE min max] you can filter the sample by minimal and maximal values.
Consider, for example, a sampled metric where the normal values are between -100 and 100, but the value 9999 is used as an indication of bad measurement.
TS.CREATE temp:TLV LABELS type temp location TLV
TS.MADD temp:TLV 1000 30 temp:TLV 1010 35 temp:TLV 1020 9999
temp:TLV 1030 40
Now, let’s retrieve all values, ignore out-of-range values:
TS.RANGE temp:TLV - + FILTER_BY_VALUE -100 100
Let’s also retrieve the average value, ignore out-of-range values:
TS.RANGE temp:TLV - + FILTER_BY_VALUE -100 100 AGGREGATION avg 1000
When using TS.MRANGE, TS.MREVRANGE, and TS.MGET, we don’t always want the values of all the labels associated with the matching time series, but only the values of selected labels.
SELECTED_LABELS allows selecting which labels to retrieve. Given the following time series and data:
TS.CREATE temp:TLV LABELS type temp location TLV
TS.MADD temp:TLV 1000 30 temp:TLV 1010 35 temp:TLV 1020 9999
temp:TLV 1030 40
To get all the labels associated with matched time series we’ll use WITHLABELS:
redis:6379> TS.MGET WITHLABELS FILTER type=temp
| 1) 1) "temp:TLV" 2) 1) 1) "type" 2) "temp" 2) 1) "location" 2) "TLV" 3) 1) (integer) 1030 2) 40 |
But suppose we want only the location, we can use SELECTED_LABELS:
redis:6379> TS.MGET SELECTED_LABELS location FILTER type=temp
| 1) 1) "temp:TLV" 2) 1) 1) "location" 2) "TLV" 3) 1) (integer) 1030 2) 40 |
Suppose we want to receive the average daily temperature, but our ‘day’ starts at 06:00. In this case, we would like to ALIGN the intervals to 06:00 to 05:59, instead of to 00:00 to 23:59.
When using TS.RANGE, TS.REVRANGE, TS.MRANGE, and TS.MREVRANGE, it is now possible to align the aggregation buckets with the requested start, end, or specific timestamp – using ALIGN.
To demonstrate alignment, let’s add the following data:
TS.CREATE stock:A LABELS type stock name A
TS.MADD stock:A 1000 100 stock:A 1010 110 stock:A 1020 120
TS.MADD stock:A 1030 200 stock:A 1040 210 stock:A 1050 220
TS.MADD stock:A 1060 300 stock:A 1070 310 stock:A 1080 320
Next, we’ll aggregate without using ALIGN (which means default alignment: 0)
redis:6379> TS.RANGE stock:A - + AGGREGATION min 20
| 1) 1) (integer) 1000 2) 100 2) 1) (integer) 1020 2) 120 3) 1) (integer) 1040 2) 210 4) 1) (integer) 1060 2) 300 5) 1) (integer) 1080 2) 320 |
And now with ALIGN:
redis:6379> TS.RANGE stock:A – + ALIGN 10 AGGREGATION min 20
| 1) 1) (integer) 990 2) 100 2) 1) (integer) 1010 2) 110 3) 1) (integer) 1030 2) 200 4) 1) (integer) 1050 2) 220 5) 1) (integer) 1070 2) 310 |
Setting ALIGN to 10 means that a bucket should start at time 10, and all the buckets (each with a 20 milliseconds duration) are aligned accordingly.
When the start timestamp for the range query is explicitly stated (not ‘-‘), it is also possible to set ALIGN to that time by setting align to ‘-‘ or to ‘start‘.
redis:6379> TS.RANGE stock:A 5 + ALIGN – AGGREGATION min 20
| 1) 1) (integer) 985 2) 100 2) 1) (integer) 1005 2) 110 3) 1) (integer) 1025 2) 200 4) 1) (integer) 1045 2) 220 5) 1) (integer) 1065 2) 310 |
Similarly, when the end timestamp for the range query is explicitly stated (not ‘+’), it is also possible to set ALIGN to that time by setting align to ‘+’ or to ‘end’.
TS.DEL allows deleting samples in a given time series within two timestamps.
For example, TS.DEL stock:A 1020 1050 will delete all samples with timestamps between 1020 and 1050 (inclusive). The returned value is the number of samples deleted.
Many optimizations were implemented, and most queries would now execute much faster compared to RedisTimeSeries 1.4.
The following table details the number of queries per second achievable on a single node, for TSBS queries (which we described here). The table lists only the subset of the TSBS queries that were supported in version 1.4.
| Query type | 1.4 queries/sec | v1.6 queries/sec | % change (higher-better) |
| tsbs-scale100_cpu-max-all-1 | 1388 | 1500 | 8.07% |
| tsbs-scale100_double-groupby-1 | 100 | 108 | 8.00% |
| tsbs-scale100_groupby-orderby-limit | 793 | 1282 | 61.66% |
| tsbs-scale100_single-groupby-1-1-1 | 13448 | 21347 | 58.74% |
| tsbs-scale100_single-groupby-1-1-12 | 2383 | 3921 | 64.54% |
We can observe an improvement of 8% to 65% in the number of queries per second, compared to RedisTimeSeries 1.4.
Redis Keyspace notifications allow Redis clients to subscribe to Pub/Sub channels in order to receive events affecting the Redis data set in some way. You can, for example, use RedisGears to trigger a function with these notifications.
As an example, it is possible to implement a time series predictor or anomaly detector that listens to the stream of samples and generates real-time predictions and warnings.
Check, for example, this test which subscribes to various RedisTimeSeries commands and generates events.
Since version 1.6, RedisTimeSeries can run in a Redis on Flash, but it’s important to note that RoF is implemented on the key level. Namely, the value of the whole time series lives either on FLASH or RAM.
RedisTimeSeries is now part of Redis Stack. You can download the latest Redis Stack Server binaries for macOS, Ubuntu, or Redhat, or install them with Docker, Homebrew, or Linux.
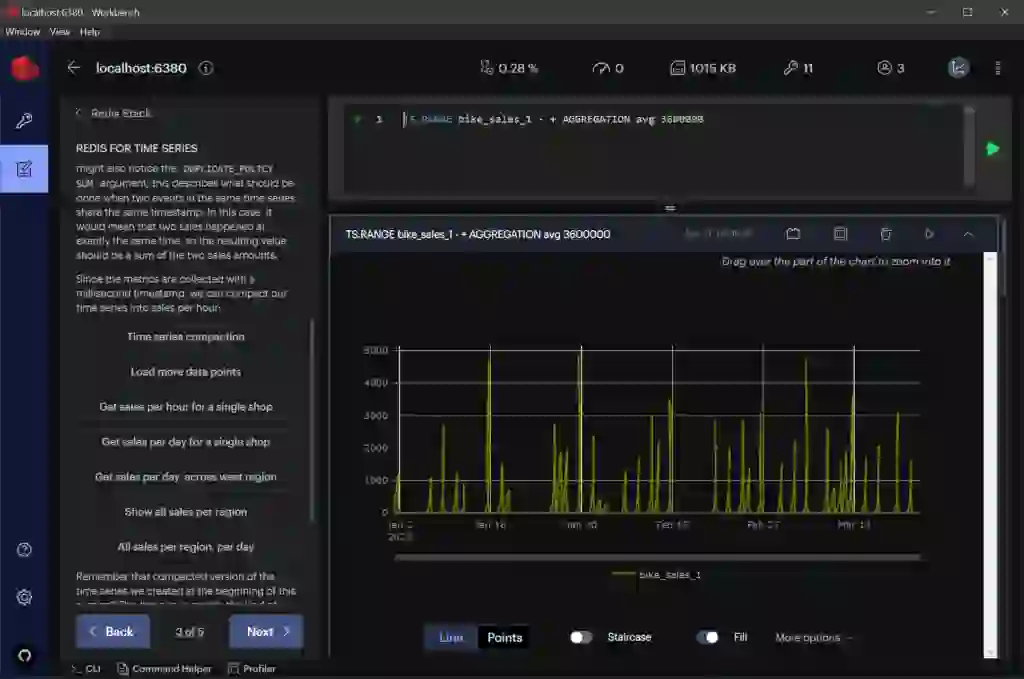
RedisInsight is a visual tool for developers that provides an excellent way to explore the data from RedisTimeSeries during development using Redis or Redis Stack.
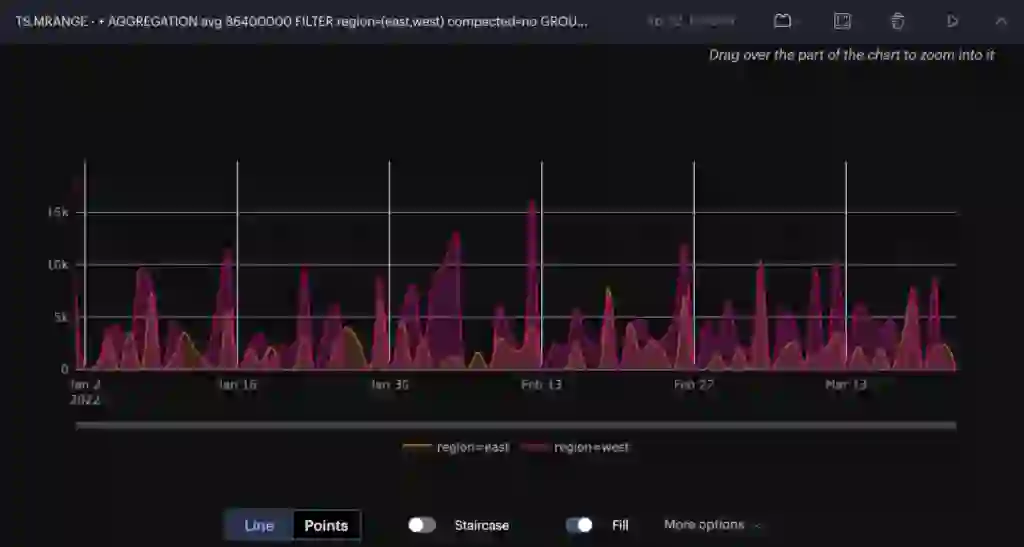
You can execute time series queries and observe the results directly from the graphical user interface. RedisInsight can now visualize RedisTimeSeries query results.

In addition, RedisInsight contains quick guides and tutorials for learning RedisTimeSeries interactively.

Learn more on RedisTimeSeries on redis.io and developer.redis.com.