Blog
Benchmarking Performance on Redis Enterprise and Google Cloud T2D Machines
Google and Redis are working together to ensure the best possible server performance across new CPU architectures. Case in point: Our benchmarks show that T2D has up to 75% better price performance than older-generation Rome Google Cloud machines.
Google Cloud’s virtual machine (VM) family, T2D Tau VMs, is based on third-generation AMD EPYCTM processors. It provides customers with impressive price performance on scale-out workloads without the need to port x86-based applications to new processor architectures.
Benchmarking system performance helps us deliver the best value and experiences. How else can we measure what we aim to achieve? In this blog post, we explore how T2D Tau VMs bring the best price performance to Redis Enterprise software workloads.
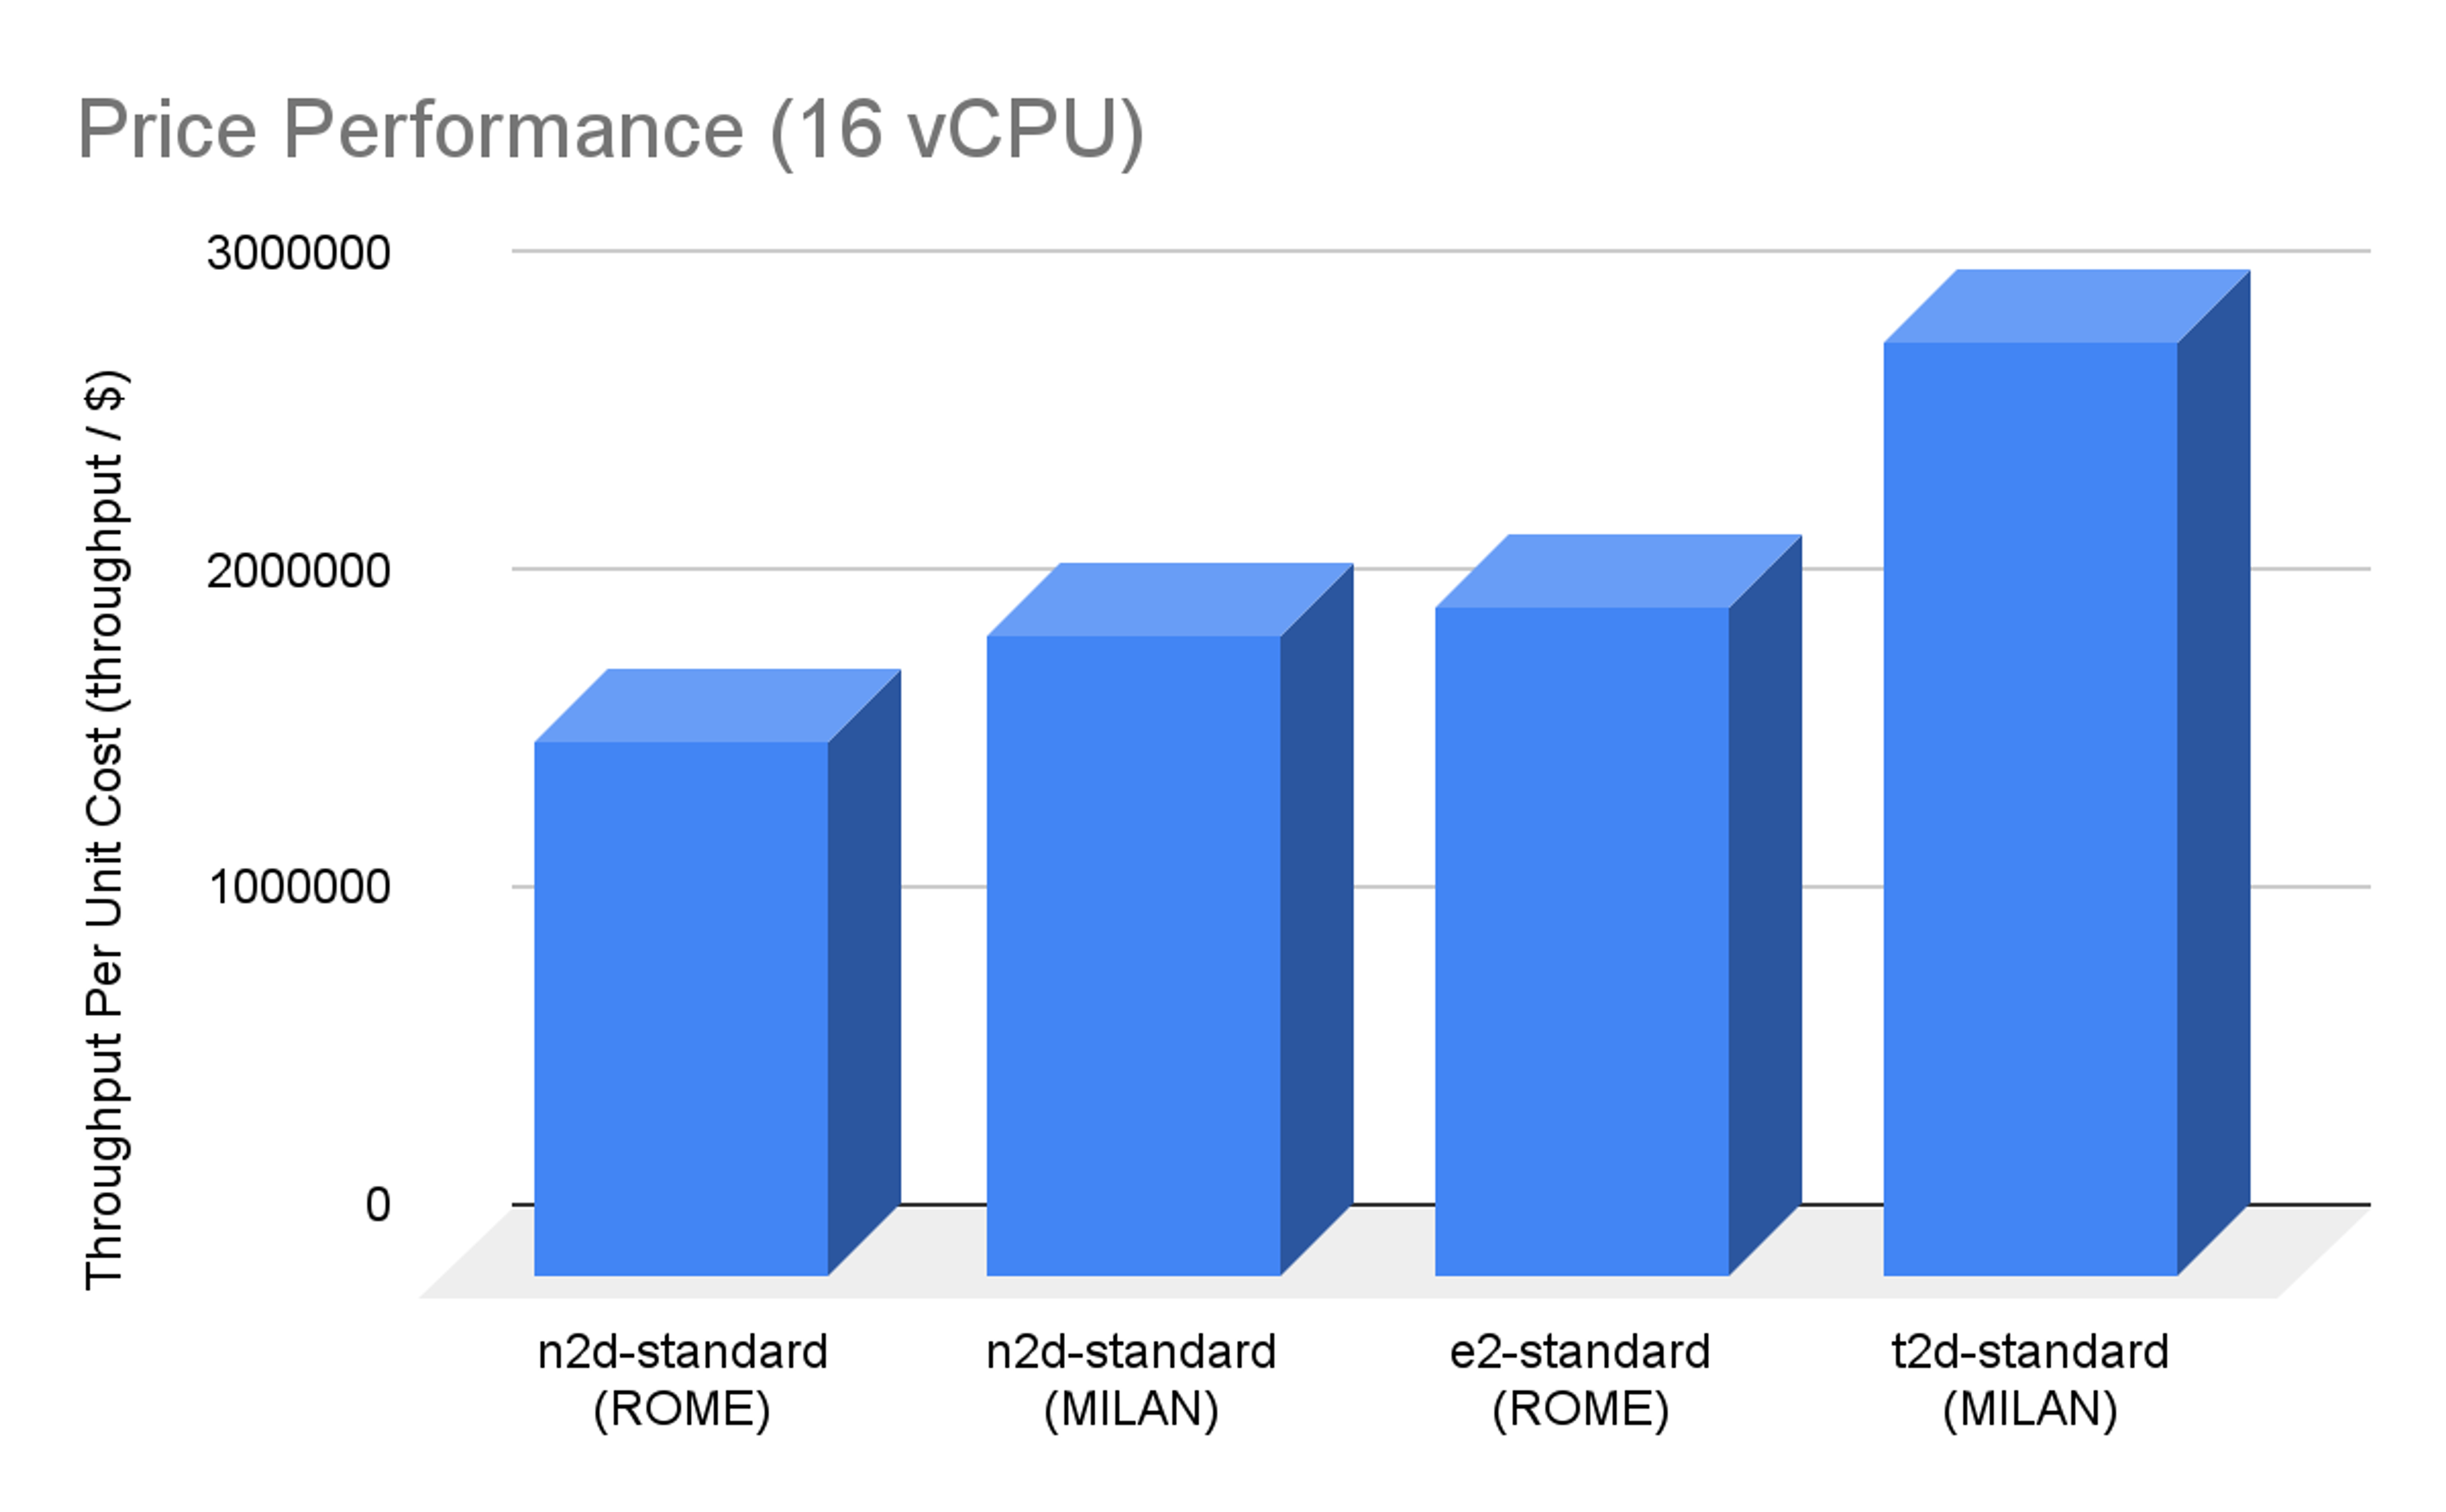
On both workloads, T2D has up to 75% better price performance (throughput per dollar) compared to older-generation Rome Google Cloud machines. The benchmarks also show up to 40% better price performance compared to same-generation Milan Google Cloud machines.
Benchmarking methodology
To accurately benchmark performance on this workload, we used the open-source PerfKit Benchmarker (PKB) tool, which provides data that helps to compare cloud offerings. PKB wraps hundreds of industry-standard benchmarking tools in an easy-to-use and extensible package. This includes Redis’s own memtier benchmark, which is what we use for workload generation for Redis Enterprise. PKB handles all of the provisionings of cloud resources, package installation, workload execution, and cleanup for the benchmark.
The overall benchmark flow is as follows:
- Provision the server and client VMs
- On servers: Install Redis Enterprise, create a cluster, create databases
- On clients: Install memtier benchmark
- Clients run memtier to preload the databases
- Clients run load tests
- Parse and report the throughput and latency results from the cluster
The metrics collected include:
- Latency-capped Throughput (ops/sec): measured as the maximum throughput under 1ms average latency
- Price-Performance (throughput/dollar): the Latency-capped throughput divided by the cost of the virtual machine (dollars per hour)
We performed the testing using two configurations:
Configuration 1: Single VM (Scale up)
The first setup is single-VM performance. To get good coverage of performance across a variety of NUMA configurations, we use the following vCPU counts: 2, 4, 8, 16, 30/32.
Configuration 2: Cluster (Scale out)
The second setup is similar to what an average Redis Enterprise customer would use. The difference in the configuration is that it introduces multiple databases on a single cluster with replication. We focus specifically on clusters of three 16 vCPU servers for this setup.
| Node 1 (16 vCPU | 64GB RAM) | Node 2 (16 vCPU | 64GB RAM) | Node 3 (16 vCPU | 64GB RAM) |
|---|---|---|
| Proxy (All Master Shards Policy) | Proxy (All Master Shards Policy) | Proxy (All Master Shards Policy) |
| DB-1 Master Shard (7.5GB) | DB-3 Master Shard (7.5GB) | DB-5 Master Shard (7.5GB) |
| DB-2 Master Shard (7.5GB) | DB-4 Master Shard (7.5GB) | DB-6 Master Shard (7.5GB) |
| DB-3 Replication Shard (7.5GB) | DB-5 Replication Shard (7.5GB) | DB-1 Replication Shard (7.5GB) |
| DB-4 Replication Shard (7.5GB) | DB-6 Replication Shard (7.5GB) | DB-2 Replication Shard (7.5GB) |
| 30/64GB Utilized (47% Utilization) | 30/64GB Utilized (47% Utilization) | 30/64GB Utilized (47% Utilization) |
Benchmarking principles
This benchmark is non-trivial. There are a lot of knobs to tune regarding server configuration and workload configuration. Our goal is to ensure that the end results are stable and consistent and that we report the best achievable throughput for each machine type. This section lays out the benchmarking principles for this experiment.
Clients
Machine size
The goal is to not bottleneck on the client, so we choose clients that are significantly larger than the server. For example, for a single 16 vCPU server, we provision two 32 vCPU clients.
Servers
Machine type
We test on GCP AMD machines:T2D (Milan), N2D (Rome/Milan), E2 (Rome)
Operating system
The choice of Guest OS greatly affects server performance. For comparison purposes, these servers run CentOS 7, which is popular among Redis Enterprise users.
Redis Enterprise version
Servers install and run Redis Enterprise Software version 6.2.4-54 on CentOS 7 for all tests.
Transparent Hugepages
We don’t enable transparent hugepages for benchmarking, as Redis incurs a latency penalty when these are used.
Guest security mitigation
Performance can be affected by guest security mitigations to some degree. For comparison purposes, however, we keep all GCP machines with the default mitigations. Turning them on and off did not have a noticeable effect on results.
Placement groups
Placement groups affect how closely VMs are physically placed; they affect latency depending on configuration settings. For these experiments, we run with a clustered placement group policy.
We present optimized configurations for servers based on a varying number of shards (in the single-VM case), proxy threads, and client threads. There is an optimal number of each of these which varies among machine types, which the benchmark optimizes to find the best throughput.
This example database creation command allows us to vary the number of Redis shards running on the server.
curl -v -k -u [email protected]:a9a204bb13 https://localhost:9443/v1/bdbs -H
'Content-type: application/json' -d
'{"name": "redisdb",
"memory_size": 10000000000,
"type": "redis",
"proxy_policy": "all-master-shards",
"port": 12006, "sharding": true,
"shards_count": {_SHARD_COUNT.value},
"shards_placement": "sparse",
"oss_cluster": true,
"shard_key_regex": [{"regex": ".*\\{(?<tag>.*)\\}.*"}, {"regex":
"(?<tag>.*)"}]}'}
Workload
Here’s how we go about the benchmark testing.
Load generation and benchmarking are done using the memtier benchmark (v1.2.15), which comes preinstalled with Redis Enterprise. This industry-standard benchmark is also used to benchmark managed/unmanaged Redis and Memcached.
We preload the cluster:
| memtier_benchmark -s localhost -a a9a204bb13 -p 12006 -t 1 -c 1 --ratio 1:0 --pipeline 100 -d 100 --key-pattern S:S --key-minimum 1 --key-maximum 1000000 -n allkeys --cluster-mode |
|---|
This preloads about 100MB of data onto the server to minimize the effects of cache before the test starts. In our experiments, raising the initial data size to a scale of about 8GB did not affect the results.
To run the benchmark, we increment the number of memtier threads until we get an average latency that is higher than the 1ms latency cap. After reaching this threshold, we record the maximum throughput (ops/sec) that the server could sustain. This metric can be thought of as an indication of practical throughput.
| memtier_benchmark -s 10.240.6.184 -a a9a204bb13 -p 12006 -t 4 --ratio 1:1 --pipeline 9 -c 24 -d 100 --key-minimum 1 --key-maximum 1000000 -n 1000000 --cluster-mode |
|---|
This command is run on each of the client VMs. The results are logged, measured, and aggregated.
Running the benchmark
For instructions on how to set up PKB, refer to the Getting Started page.
For the single-VM configuration, we run:
| ./pkb.py --cloud=GCP --benchmarks=redis_enterprise --config_override='redis_enterprise.vm_groups.clients.vm_spec.GCP.machine_type='"'"'n2-standard-32'"'"'' --config_override=redis_enterprise.vm_groups.clients.vm_count=2 --config_override='redis_enterprise.vm_groups.servers.vm_spec.GCP.machine_type='"'"'t2d-standard-16'"'"'' --config_override=redis_enterprise.vm_groups.servers.vm_count=1 --enterprise_redis_data_size_bytes=100 --enterprise_redis_load_records=1000000 --enterprise_redis_min_threads=4 --enterprise_redis_optimize_throughput=True --enterprise_redis_pin_workers=True --os_type=centos7 --project=<YOUR_PROJECT> --zone=us-central1-a --timeout_minutes=360 |
|---|
For the representative-cluster configuration, we run:
| ./pkb.py -cloud=GCP --benchmarks=redis_enterprise --config_override='redis_enterprise.vm_groups.clients.vm_spec.GCP.machine_type='"'"'n2-standard-32'"'"'' --config_override=redis_enterprise.vm_groups.clients.vm_count=6 --config_override='redis_enterprise.vm_groups.servers.vm_spec.GCP.machine_type='"'"'t2d-standard-16'"'"'' --config_override=redis_enterprise.vm_groups.servers.vm_count=3 --enterprise_redis_data_size_bytes=100 --enterprise_redis_db_count=6 --enterprise_redis_db_replication=True --enterprise_redis_load_records=50000000 --enterprise_redis_loadgen_clients=1 --enterprise_redis_min_threads=5 --enterprise_redis_optimize_throughput=True --enterprise_redis_pin_workers=True --enterprise_redis_shard_count=1 --enterprise_redis_thread_increment=1 --os_type=centos7 --project=<YOUR_PROJECT> --zone=us-central1-a --timeout_minutes=360 |
|---|
The benchmark results
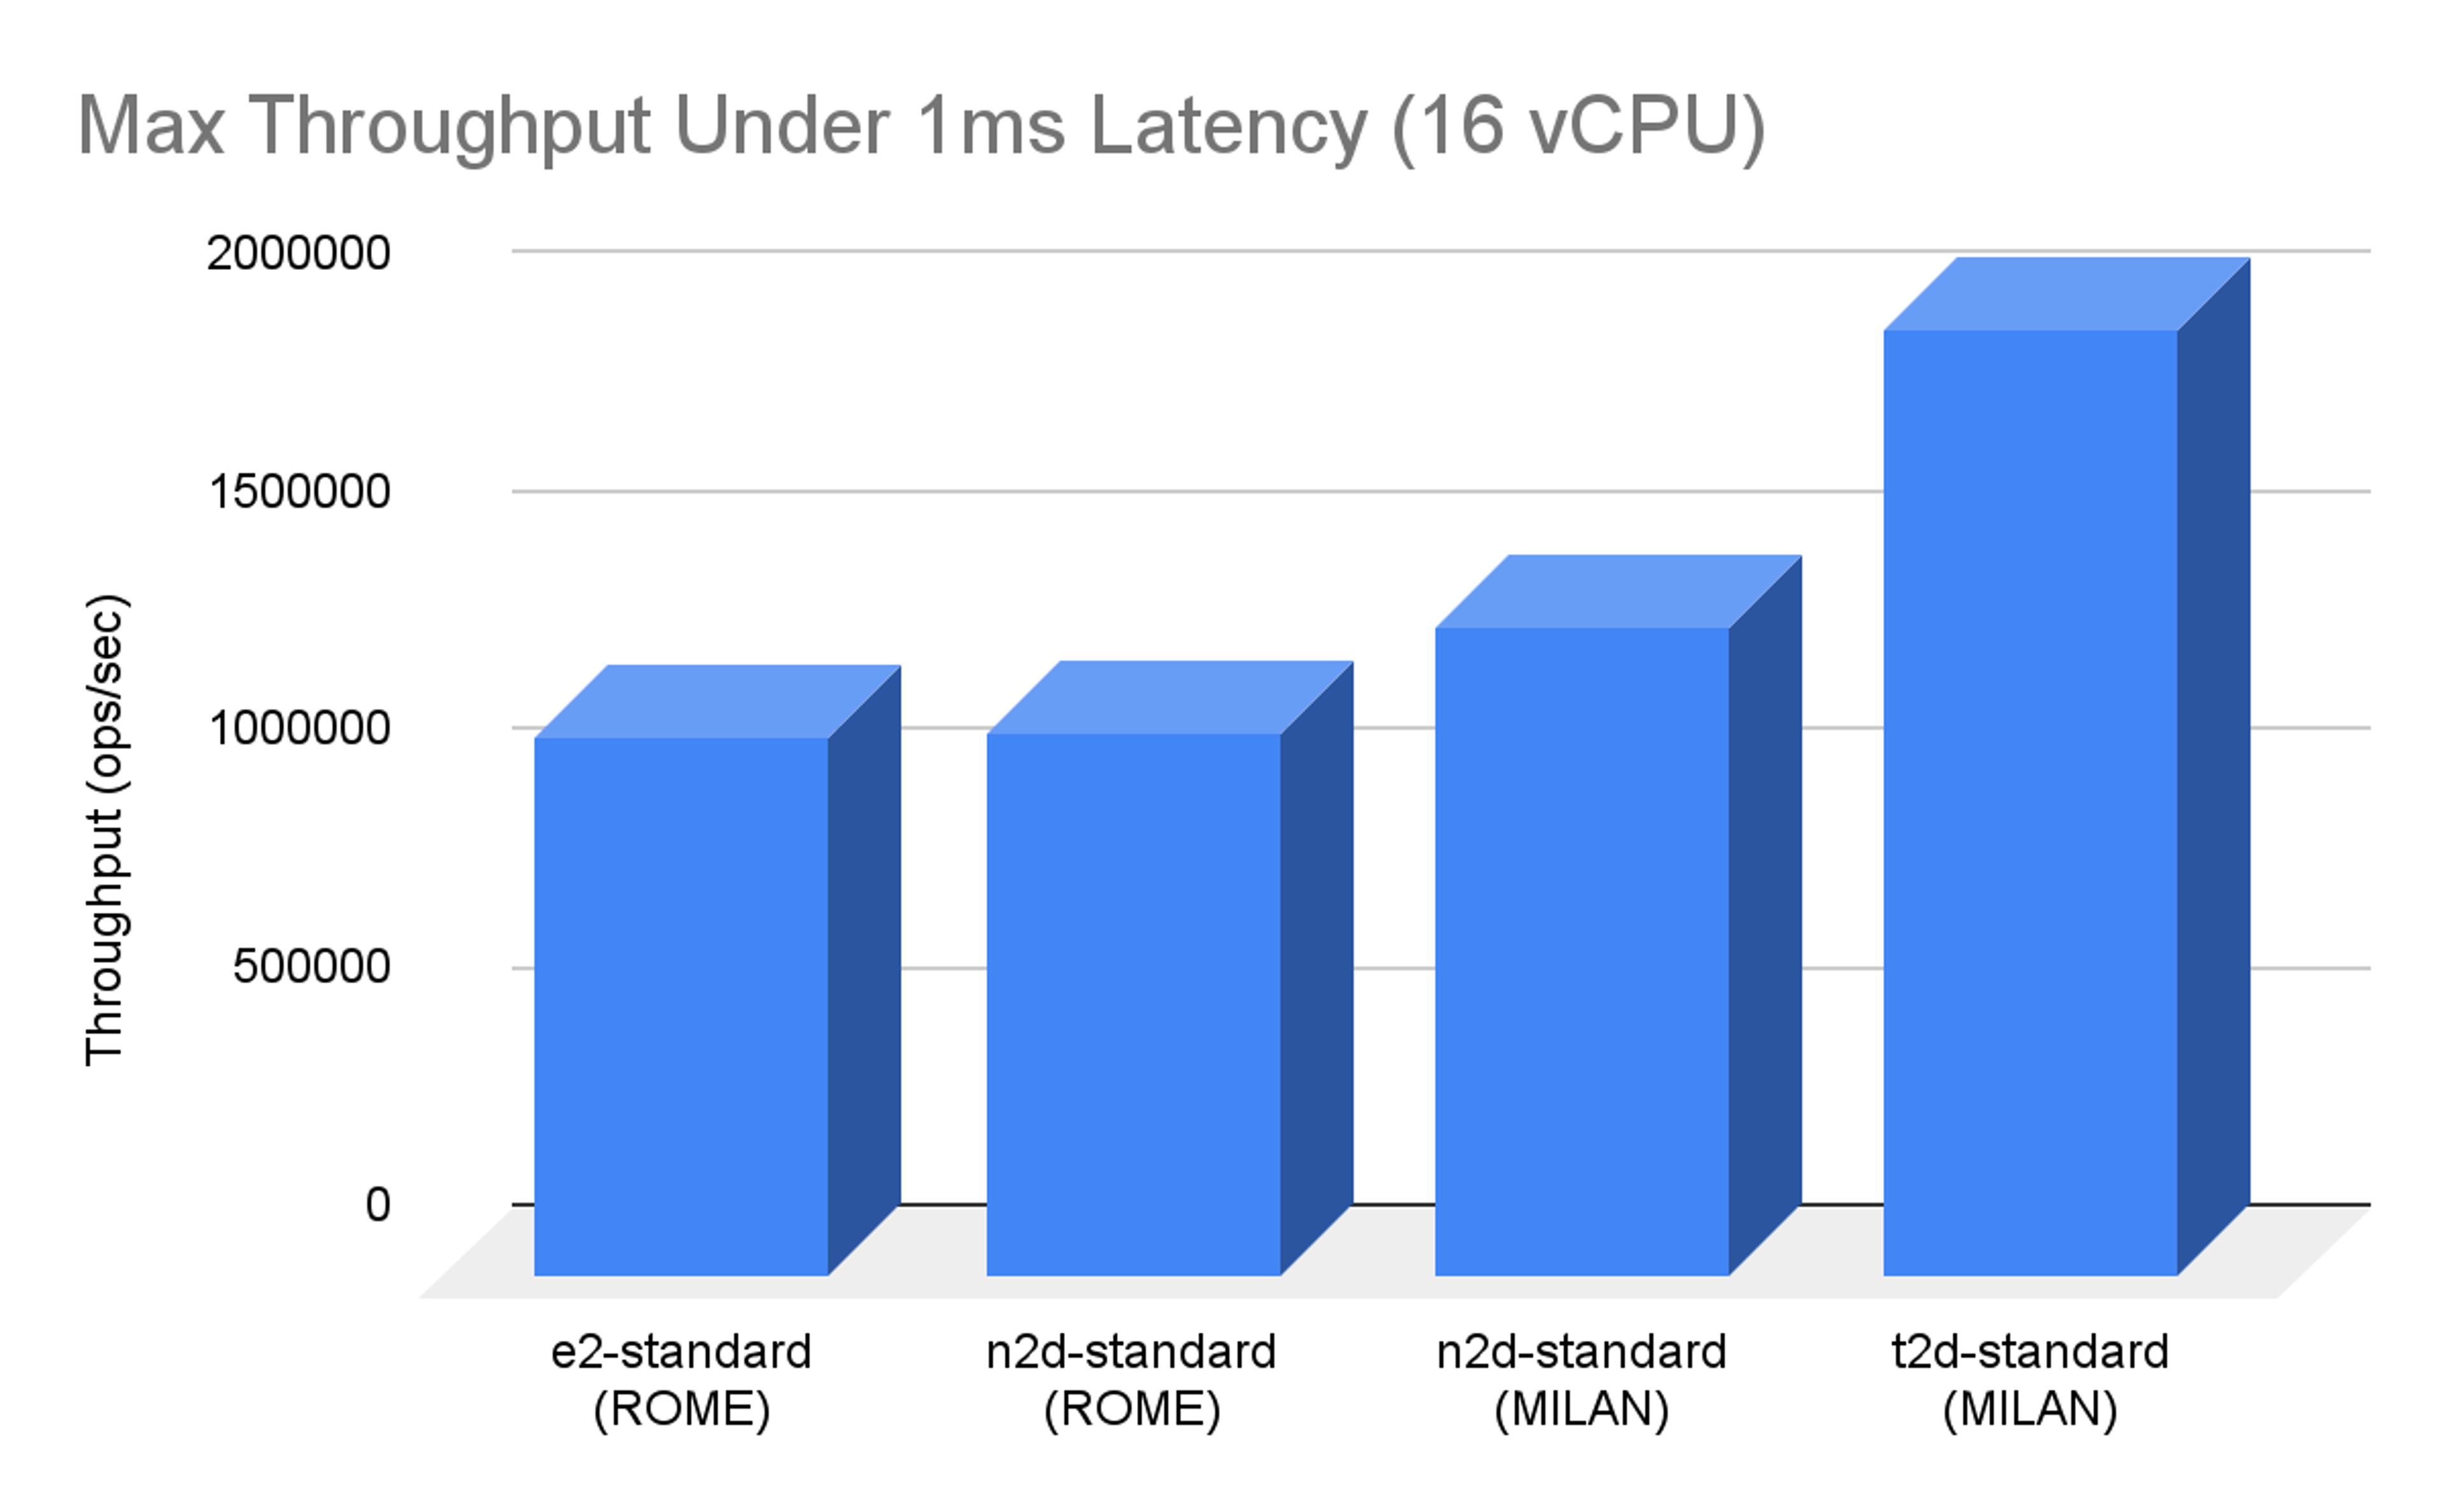
The following are optimized results for each machine type in terms of shard count, proxy threads, and client threads. T2D is generally close to the lead or leading in the single-VM per-vCPU comparisons in terms of throughput and price performance. T2D has exceptional price performance in the representative cluster configuration as well.
Single VM configuration (scale up)
In the single VM 16-vCPU throughput comparison, the T2D beats N2D Milan machines by about 50% and previous generation N2D Rome by about 75%.

In the single VM 16-vCPU price-performance comparison, the T2D beats previous generation E2 Rome machines by about 40% and N2D Rome/Milan by about 75%.

Cluster Configuration (scale out)
In the representative cluster configuration, we achieved over 3.9 million ops/sec throughput under 1ms latency on T2D-standard-16. That translates to about 5.8 million QPS/dollar (based on cost per hour) on T2D, which is over 40% improvement over other AMD machine types. It’s a price-performance winner.
The upshot
Google Cloud’s T2D has exceptional throughput and price performance on this workload and is the best-performing GCP AMD machine.
We’re excited about this collaboration between Google Cloud and Redis Inc. to track the performance of new CPU architectures. It enables us to deliver the most helpful changes and bring customers the best user experience. Benchmarking with PKB allows us to partner on important metrics and keep results reproducible for customers.
We look forward to continued collaboration. Redis will continue to challenge the status quo with the latest and greatest virtual machine types that Google Cloud brings to the market – and together, we can provide the most cost-efficient real-time database solution.
Get started with Redis today
Speak to a Redis expert and learn more about enterprise-grade Redis today.
