New Relic with Redis Cloud
To collect, view, and monitor metrics data from your databases and other cluster components, you can connect New Relic to your Redis Cloud cluster using the Redis New Relic Integration.
New Relic is used by organizations of all sizes and across a wide range of industries to enable digital transformation and cloud migration, drive collaboration among development, operations, security and business teams, accelerate time to market for applications, reduce time to problem resolution, secure applications and infrastructure, understand user behavior, and track key business metrics.
The New Relic Integration for Redis Cloud uses Prometheus remote write functionality to connect Prometheus data sources to New Relic. This integration enables Redis Cloud users to export metrics to New Relic for analysis, and includes Redis-designed dashboards for use in monitoring Redis Cloud clusters.
This integration makes it possible to:
- Collect and display metrics not available in the admin console
- Set up automatic alerts for node or cluster events
- Display these metrics alongside data from other systems
Install Redis' New Relic Integration for Redis Cloud
The New Relic Integration for Redis is based on a feature of the Prometheus data source. Prometheus can forward metrics on to another destination using remote writes. This will require a Prometheus installation inside the same datacenter as the Redis Cloud deployment.
If you have not already created a VPC between the Redis Cloud cluster and the network in which the machine hosting Prometheus lives you should do so now. Please visit VPC Peering and follow the instructions for the cloud platform of your choice.
Finally, the Prometheus installation must be configured to pull metrics from Redis Cloud and write them to New Relic. There are two sections, first the pull from Redis and second the write to New Relic.
Get metrics from Redis Cloud:
  - job_name: "redis-cloud"
    scrape_interval: 30s
    scrape_timeout: 30s
    metrics_path: /
    scheme: https
    tls_config:
      insecure_skip_verify: true
    static_configs:
      # The default Redis Cloud Prometheus port is 8070.
      # Replace REDIS_CLOUD_HOST with your cluster's hostname.
      - targets: ["REDIS_CLOUD_HOST:8070"]
Replace REDIS_CLOUD_HOST with the Prometheus endpoint for your database, which you can get from the Redis Cloud console.
In the Metrics tab of your database, select Connect to Prometheus > Copy Prometheus endpoint to save your Prometheus endpoint to the clipboard.
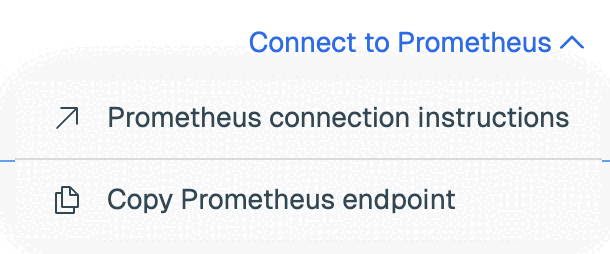
You can also get the Prometheus endpoint by calling GET /subscriptions/{subscriptionId} and getting the prometheusEndpoint from the response.
Write them to New Relic:
# Remote write configuration for New Relic.
# - Replace REDIS_CLOUD_SERVICE NAME with any name you'd like to use to refer to this data source.
# - Replace NEW_RELIC_BEARER_TOKEN with the token you generated on the New Relic Administration -> API Keys page.
remote_write:
- url: https://metric-api.newrelic.com/prometheus/v1/write?prometheus_server=REDIS_CLOUD_SERVICE_NAME
  authorization:
    credentials: NEW_RELIC_BEARER_TOKEN
View metrics
The Redis Cloud Integration for New Relic contains pre-defined dashboards to aid in monitoring your Redis Software deployment.
The following dashboards are currently available:
- Cluster: top-level statistics indicating the general health of the cluster
- Database: performance metrics at the database level
- Node
- Shard: low-level details of an individual shard
- Active-Active: replication and performance for geo-replicated clusters
- Proxy: network and command information regarding the proxy
- Proxy Threads: processor usage information regarding the proxy's component threads
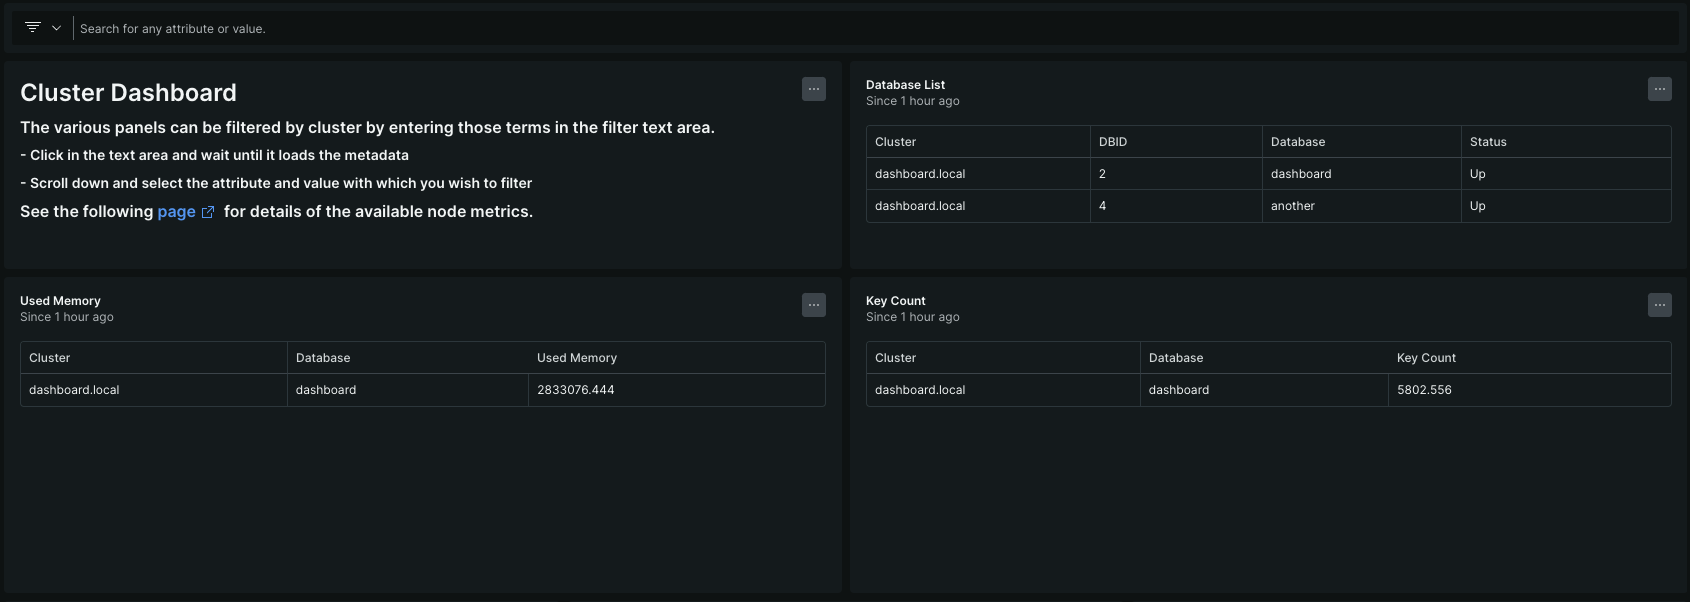
Monitor metrics
New Relic dashboards can be filtered using the text area. For example, when viewing a cluster dashboard it is possible to filter the display to show data for only one cluster by typing 'cluster' in the text area and waiting for the system to retrieve the relevant data before choosing one of the options in the 'cluster' section.
Certain types of data do not know the name of the database from which they were drawn. The dashboard should have a list of database names and ids; use the id value when filtering input to the dashboard.