Uptrace with Redis Software
To collect, view, and monitor metrics data from your databases and other cluster components, you can connect Uptrace to your Redis Software cluster using OpenTelemetry Collector.
Uptrace is an open source APM tool that supports distributed tracing, metrics, and logs. You can use it to monitor applications and set up automatic alerts to receive notifications.
Uptrace uses OpenTelemetry to collect and export telemetry data from software applications such as Redis. OpenTelemetry is an open source observability framework that aims to provide a single standard for all types of observability signals such as traces, metrics, and logs.
With OpenTelemetry Collector, you can receive, process, and export telemetry data to any OpenTelemetry backend. You can also use Collector to scrape Prometheus metrics provided by Redis and then export those metrics to Uptrace.
You can use Uptrace to:
- Collect and display data metrics not available in the admin console.
- Use prebuilt dashboard templates maintained by the Uptrace community.
- Set up automatic alerts and receive notifications via email, Slack, Telegram, and others.
- Monitor your app performance and logs using OpenTelemetry tracing.

Install Collector and Uptrace
Because installing OpenTelemetry Collector and Uptrace can take some time, you can use the docker-compose example that also comes with Redis Software cluster.
After you download the Docker example, you can edit the following configuration files in the uptrace/example/redis-enterprise directory before you start the Docker containers:
otel-collector.yaml- Configures/etc/otelcol-contrib/config.yamlin the OpenTelemetry Collector container.uptrace.yml- Configures/etc/uptrace/uptrace.ymlin the Uptrace container.
You can also install OpenTelemetry and Uptrace from scratch using the following guides:
After you install Uptrace, you can access the Uptrace UI at http://localhost:14318/.
Scrape Prometheus metrics
Redis Software cluster exposes a Prometheus scraping endpoint on http://localhost:8070/. You can scrape that endpoint by adding the following lines to the OpenTelemetry Collector config:
# /etc/otelcol-contrib/config.yaml

prometheus_simple/cluster1:
  collection_interval: 10s
  endpoint: "localhost:8070" # Redis Cluster endpoint
  metrics_path: "/"
  tls:
    insecure: false
    insecure_skip_verify: true
    min_version: "1.0"
Next, you can export the collected metrics to Uptrace using OpenTelemetry protocol (OTLP):
# /etc/otelcol-contrib/config.yaml

receivers:
  otlp:
    protocols:
      grpc:
      http:

exporters:
  otlp/uptrace:
    # Uptrace is accepting metrics on this port
    endpoint: localhost:14317
    headers: { "uptrace-dsn": "http://project1_secret_token@localhost:14317/1" }
    tls: { insecure: true }

service:
  pipelines:
    traces:
      receivers: [otlp]
      processors: [batch]
      exporters: [otlp/uptrace]
    metrics:
      receivers: [otlp, prometheus_simple/cluster1]
      processors: [batch]
      exporters: [otlp/uptrace]
    logs:
      receivers: [otlp]
      processors: [batch]
      exporters: [otlp/uptrace]
Don't forget to restart the Collector and then check logs for any errors:
docker-compose logs otel-collector

# or

sudo journalctl -u otelcol-contrib -f
You can also check the full OpenTelemetry Collector config here.
View metrics
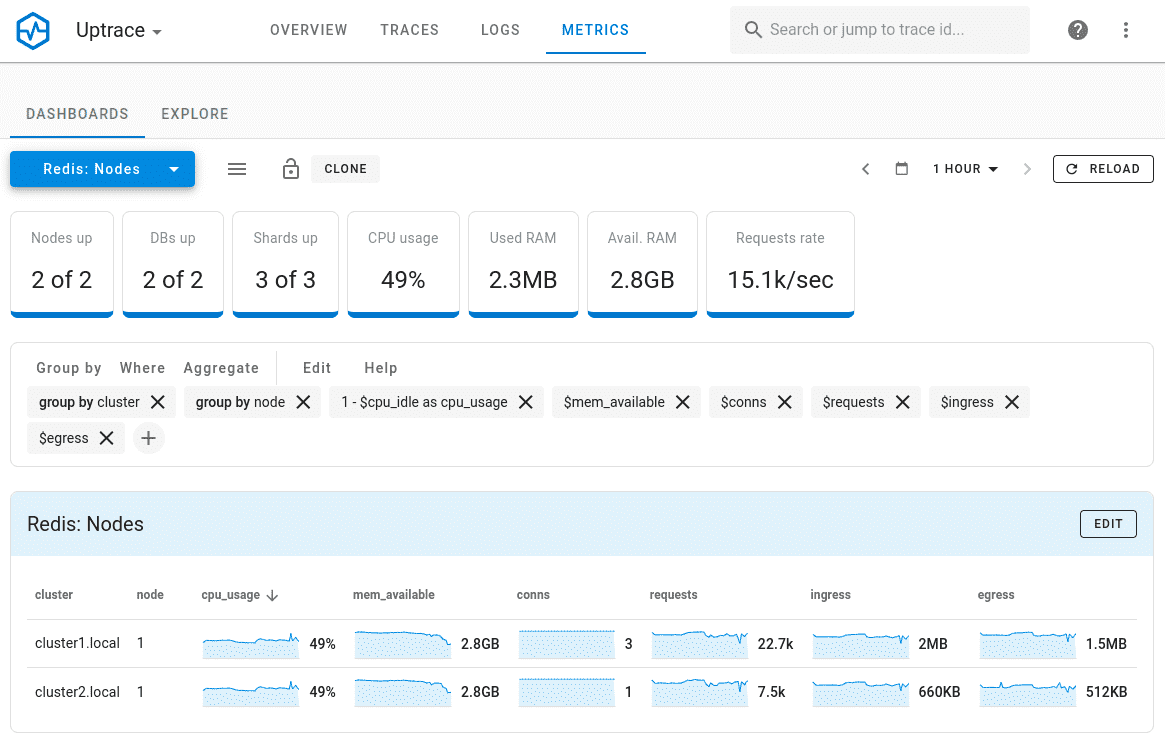
When metrics start arriving to Uptrace, you should see a couple of dashboards in the Metrics tab. In total, Uptrace should create 3 dashboards for Redis Software metrics:
-
"Redis: Nodes" dashboard displays a list of cluster nodes. You can select a node to view its metrics.
-
"Redis: Databases" displays a list of Redis databases in all cluster nodes. To find a specific database, you can use filters or sort the table by columns.
-
"Redis: Shards" contains a list of shards that you have in all cluster nodes. You can filter or sort shards and select a shard for more details.
Monitor metrics
To start monitoring metrics, you need to create metrics monitors using Uptrace UI:
- Open "Alerts" -> "Monitors".
- Click "Create monitor" -> "Create metrics monitor".
For example, the following monitor uses the group by node expression to create an alert whenever an individual Redis shard is down:
monitors:
  - name: Redis shard is down
    metrics:
      - redis_up as $redis_up
    query:
      - group by cluster # monitor each cluster,
      - group by bdb # each database,
      - group by node # and each shard
      - $redis_up
    min_allowed_value: 1
    # shard should be down for 5 minutes to trigger an alert
    for_duration: 5m
You can also create queries with more complex expressions.
For example, the following monitors create an alert when the keyspace hit rate is lower than 75% or memory fragmentation is too high:
monitors:
  - name: Redis read hit rate < 75%
    metrics:
      - redis_keyspace_read_hits as $hits
      - redis_keyspace_read_misses as $misses
    query:
      - group by cluster
      - group by bdb
      - group by node
      - $hits / ($hits + $misses) as hit_rate
    min_allowed_value: 0.75
    for_duration: 5m

  - name: Memory fragmentation is too high
    metrics:
      - redis_used_memory as $mem_used
      - redis_mem_fragmentation_ratio as $fragmentation
    query:
      - group by cluster
      - group by bdb
      - group by node
      - where $mem_used > 32mb
      - $fragmentation
    max_allowed_value: 3
    for_duration: 5m
You can learn more about the query language here.