Blog
ZeroBrane Studio Plugin for Redis Lua Scripts
Just before Christmas, Salvatore Sanfilippo published the first release candidate for Redis v3.2. The upcoming v3.2 delivers new features (such as geo spatial indexes and cluster rebalancing) and many great improvements (including Matt Stancliff’s Quick Lists and Oran Agra’s SDS and Jemalloc optimizations). For this post, I’ll focus on just one of these – the Redis Lua Debugger (LDB) – and also share a New Year’s present from Redis (spoiler).
LDB is a mode for executing Redis Lua scripts that allows you to step through your Lua script, set conditional and line breakpoints, inspect variables, trace the stack, print debug output, evaluate Lua expressions, and run Redis commands. It comes in both asynchronous and synchronous sub-modes, the former of which is non-blocking and discards updates to the dataset, while the latter blocks and retains data changes. LDB is implemented in the Redis server, and the command line interface (redis-cli) provides the respective console when running scripts in debug mode. You can learn more on the documentation page or in this short video introduction (33:40m) by Salvatore Sanfilippo.
The ability to execute embedded Lua scripts in Redis is the best feature in the history of humankind, and one of Redis’ top-k. The language’s simple syntax, convenient data constructs and base libraries easily allow you to perform complex operations on your data right where it is managed. Besides extending Redis in any imaginable direction, you usually also save on latency and bandwidth. For me, the new Lua debugger is a dream come true – I’ve always been enamored with Redis’ scripts and equally frustrated by the inability to debug them.
Being the uber-developer that I am, I rarely code bugs, perhaps as little as three or four in each LoC… To hunt these down I’ve tried different methods for tracing, and even resorted to writing a Redis Lua debugger as Redis Lua script (that debugger is incompatible with v3+, so regrettably, it’s no longer maintained). But these were never quite enough.
At the Redis Developers Day in October, I gave a short session that was essentially a Lua smorgasbord (and also secondary indexes – see redimension and lua-redimension for that). It was definitely not the first time a Redis user had asked for a Lua debugger, but I do believe I was the last one to make the request… A couple of weeks later, the collective wish for a debugger was fulfilled as LDB made its debut to unstable (and I got to test it, so if you find any issues, you can blame my sloppiness ;)).
Once LDB was ready, I knew there was one other step that must be taken, so I reached out to Paul Kulchenko and asked him to make us a Redis plugin for ZeroBrane Studio (which I also tested, so again, any issues – mea culpa). ZeroBrane Studio is THE Lua IDE. It is open source, lightweight, cross-platform, portable, rock stable, passionately maintained and covers any possible need I have for Lua development. It also boasts a very handy integrated debugger that now, thanks to Paul’s work and Redis’ sponsorship, plays very nicely with Redis’ LDB. Check out the screencast (10:26) for an introduction, or follow these steps to get to Lua debugging heaven:
- Download, install and start an LDB-enabled Redis server (right now, that’s the release candidate for v3.2).
- Download and install ZeroBrane Studio v1.20 or above – the project is entirely free but if you benefit from using it, please consider supporting Paul’s project.
- Get yourself the ZeroBrane Studio interpreter plugin for Redis from the ZeroBranePackage repository, aptly named redis.lua.
- To install the plugin for all users, drop it in the packages directory of your ZeroBrane Studio installation (e.g. /opt/zbstudio/packages/), or put it in your ~/.zbstudio/packages directory to savor it alone.
That’s all there is to it – fire up ZBS and you’re all ready to go! It is as intuitive as any IDE, but ZBS also has tutorials and ample documentation if you’re looking for extra resources.
To get you up to speed with using ZBS and Redis, some quick pointers… Once the IDE loads (deliciously fast BTW), you’ll want to switch from the default Lua interpreter to Redis – you can do that from the Project->Lua Interpreter menu or by clicking the window’s lower right corner and selecting it from the pop up menu.
With the Redis interpreter selected, Lua scripts that you execute or debug will be sent to a Redis server. Every time you start a new IDE session, the plugin will prompt you for the server’s URI, and store it for the next session (for security purposes the password isn’t saved). Even if you don’t provide a password and connect to a password-protected Redis server, the plugin will prompt you for one.
Specify your script’s KEYS and ARGS via the Project->Command Line Parameters dialog. In it, use the syntax that redis-cli --eval expects: a) a space-delimited list of key names that’s followed by b) a space, a comma (‘,’) and another space, which is in turn followed by c) a space-delimited list of arguments. This example shows how to pass the script two key names (foo and bar) and a single argument (42)…

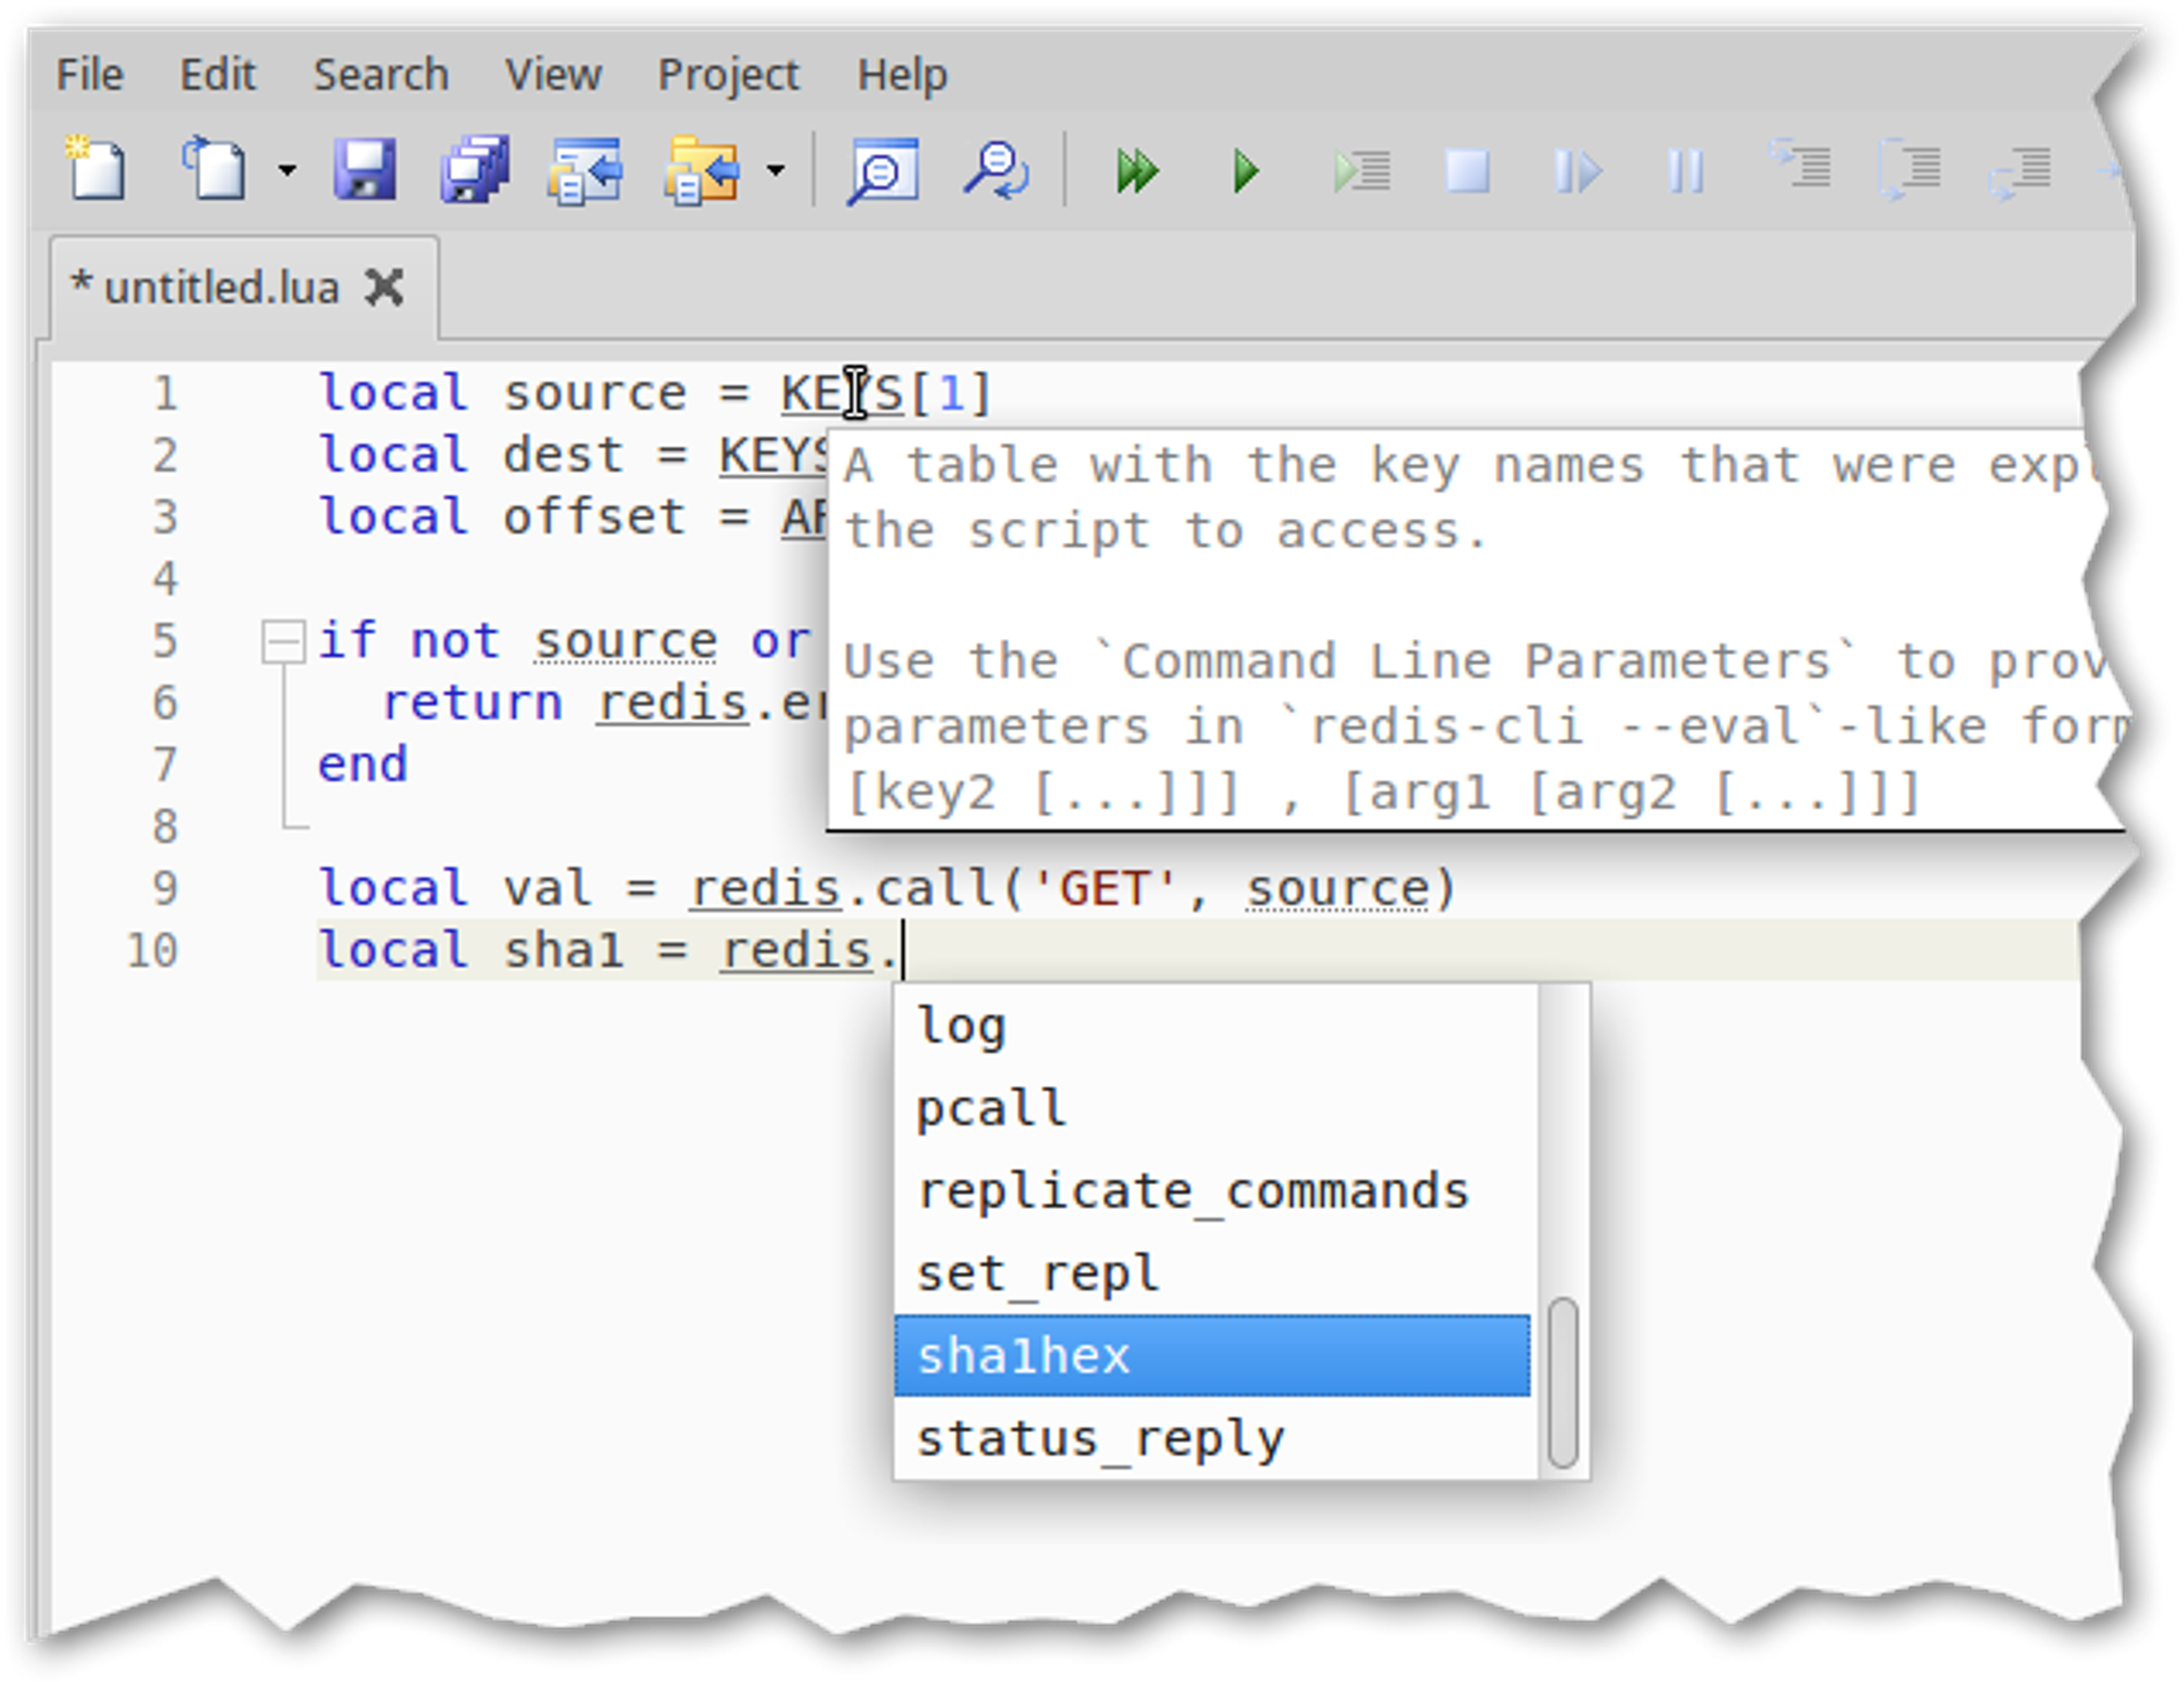
The editor is simple but packs a lot of punch on top of syntax highlighting, helpful tooltips and autocompletion for everything including the Redis Lua API. You can do regular expression searches, rename variables, jump to definitions, comment/fold/ident code and, my personal favorite, use Shift-Alt-Arrows to edit multiple lines at once.
The real magic happens when you hit that little green triangle and start debuggin’. You can step through your script, toggle breakpoints, define watches and view the stack trace – everything just works as you’d expect (which is what makes this so damn cool IMO).
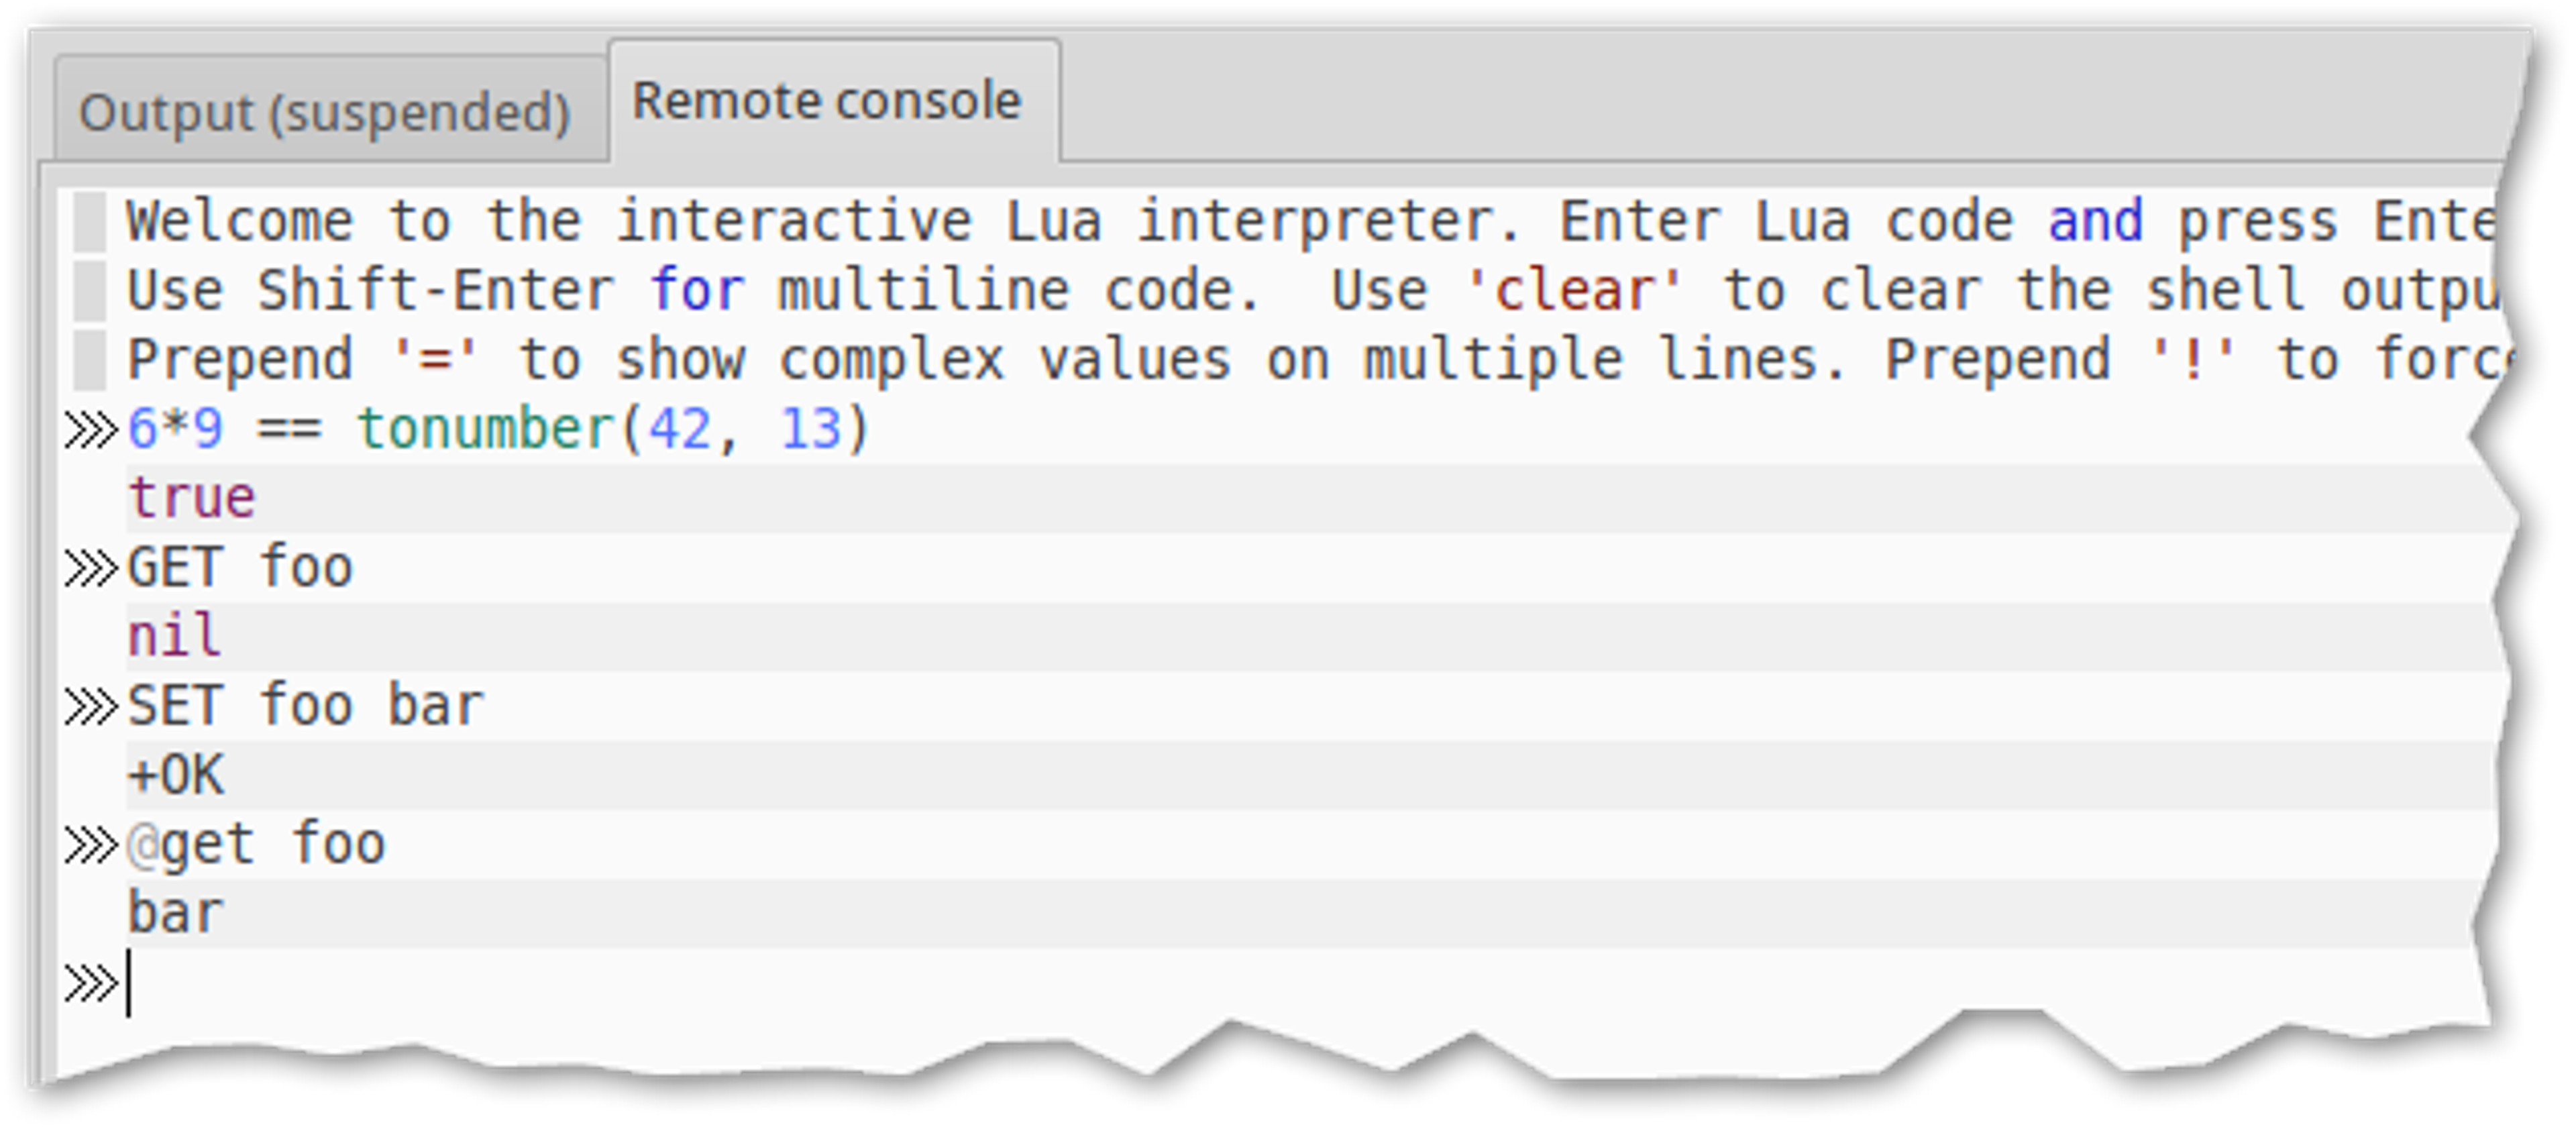
But before you run off to try all this yourself (and you really should!), the last feature you need to know about is the Remote console. When in a debug session, the remote console allows you to type in Lua statements that are evaluated by the Redis server. You can also use your script’s variables, but because the statements are executed in a different frame, you won’t be able to modify the variables themselves.
Even more handy is the ability to call any Redis API command (that’s allowed from the scripts) in the remote console by either prefixing the command with a ‘@’ or just by CAPITALIZING it. This allows you to change the database’s contents during the script’s execution (though remember that changes will be discarded or retained depending on LDB’s mode):

The full Redis Lua API and libraries (e.g. cjson and cmsgpack) are supported, including the new debugger commands, so you can call redis.debug to print messages to the output console and trigger conditional breakpoints with redis.breakpoint. Quick jumping to a problematic line of code by double-clicking on the error in the console and infinite loop detection are included as well. The plugin’s configuration is documented at the end of its file.
A couple of additional points to note:
- Step Into is supported. Step Over, Step Out and Break on the next line of code all perform Step Into.
- No upvalues or outer scope variables are shown in the Stack window, as the Redis debugger’s trace command does not output these.
This being only the initial release for the plugin, you can expect improvements down the road. For that, we’re depending on your feedback – issues and pull requests can be opened directly at the repository, and for everything else there’s always Twitter and email.
Get started with Redis today
Speak to a Redis expert and learn more about enterprise-grade Redis today.
