Tutorial
Mobile Banking Account Dashboard Using Redis
February 26, 202611 minute read


TL;DR:Build a mobile banking account dashboard with Redis by caching account balances as JSON documents, tracking balance history with Time Series, ranking biggest spenders with sorted sets, and searching transactions with Search and Query. Redis delivers sub-millisecond reads so customers see real-time financial data the moment they open the app.
GITHUB CODEBelow is a command to the clone the source code for the application used in this tutorialgit clone --branch v1.2.0 https://github.com/redis-developer/mobile-banking-solutions
#What you'll learn
- How to cache account balances and transaction data as Redis JSON documents
- How to track balance over time using Redis Time Series
- How to rank biggest spenders with Redis sorted sets
- How to search and filter transactions using Redis Search and Query
- How to seed realistic banking data with a cron-based transaction generator
#What is a mobile banking account dashboard?
An account dashboard is a page in a mobile banking app that instantly renders account highlights to users. A customer can click on any of the accounts on the dashboard to see the real-time account details, such as latest transactions, mortgage amount they have left to pay, checking and savings, etc.
An account dashboard makes a customer's finances easily visible in one place. It reduces financial complexity for the customer and fosters customer loyalty.
The following diagram is an example data architecture for an account dashboard:
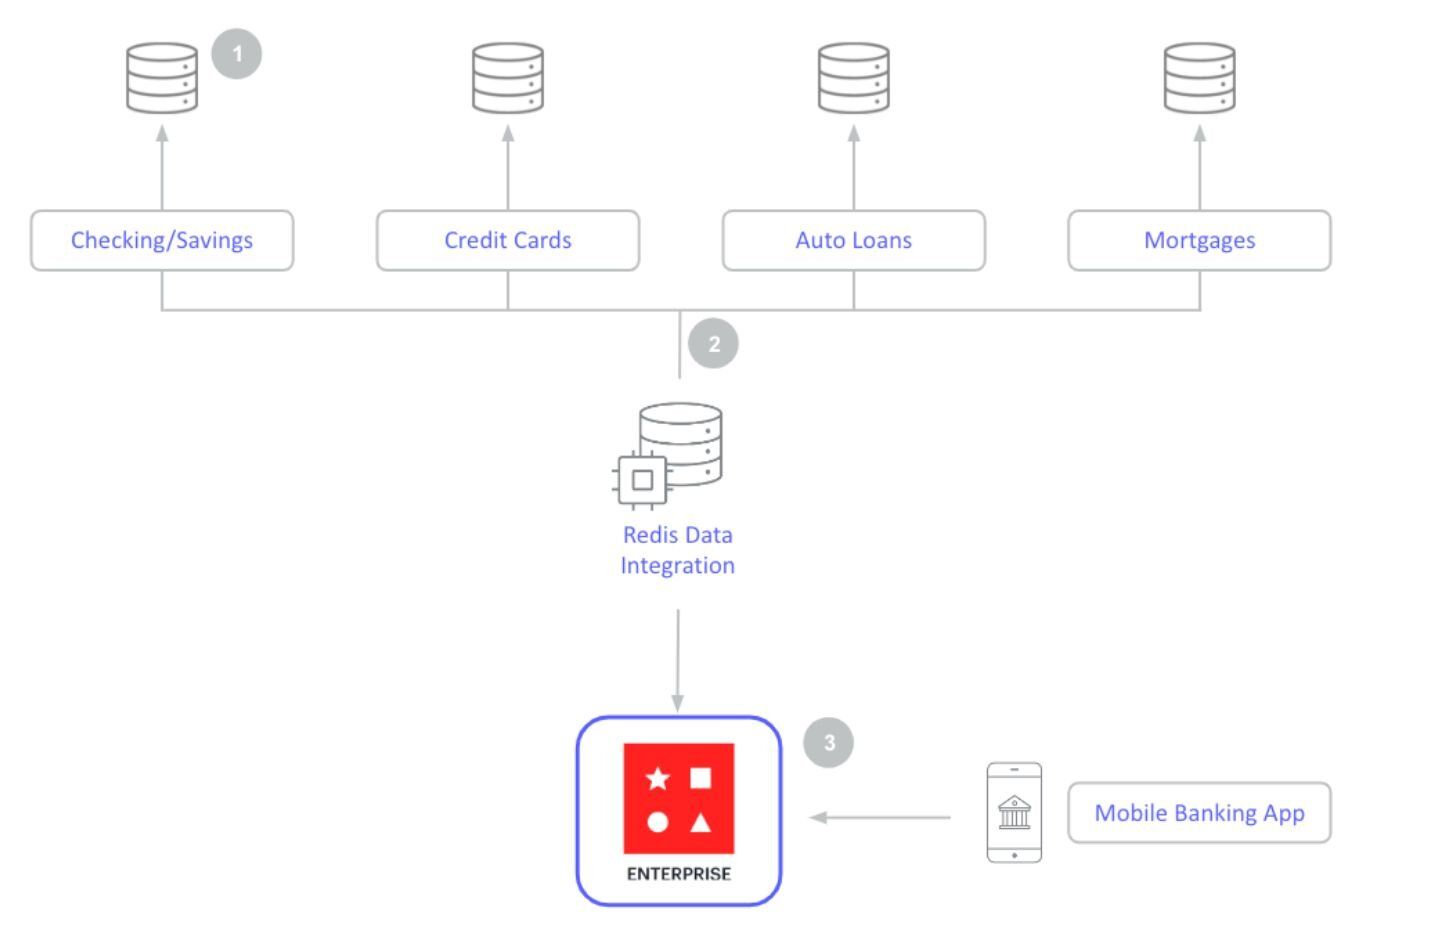
- Banks store information in a number of separate databases that support individual banking products
- Key customer account details (balances, recent transactions) across the banks product portfolio are prefetched into Redis Cloud using Redis Data Integration (RDI)
- Redis Cloud powers customer's account dashboards, enabling mobile banking users to view balances and other high-priority information immediately upon login
#Why should you use Redis for account dashboards in mobile banking?
- Resilience: Redis Cloud provides resilience with 99.999% uptime and Active-Active Geo Distribution to prevent loss of critical user profile data
- Scalability: Redis Cloud provides < 1ms performance at incredibly high scale to ensure apps perform under peak loads
- JSON Support: Provides the ability to create and store account information as JSON documents with the < 1ms speed of Redis
- Querying and Indexing: Redis Cloud can quickly identify and store data from multiple different databases and index data to make it readily searchable
#How do you build an account dashboard with Redis?
NOTEBelow is a command to the clone the source code for the application used in this tutorialgit clone --branch v1.2.0 https://github.com/redis-developer/mobile-banking-solutions
Download the above source code and run following command to start the demo application
After docker up & running, open http://localhost:8080/ url in browser to view application
#How is the banking data seeded?
This application leverages Redis core data structures, JSON, TimeSeries, Search and Query features. The data seeded is later used to show a searchable transaction overview with realtime updates as well as a personal finance management overview with realtime balance and biggest spenders updates.
On application startup in
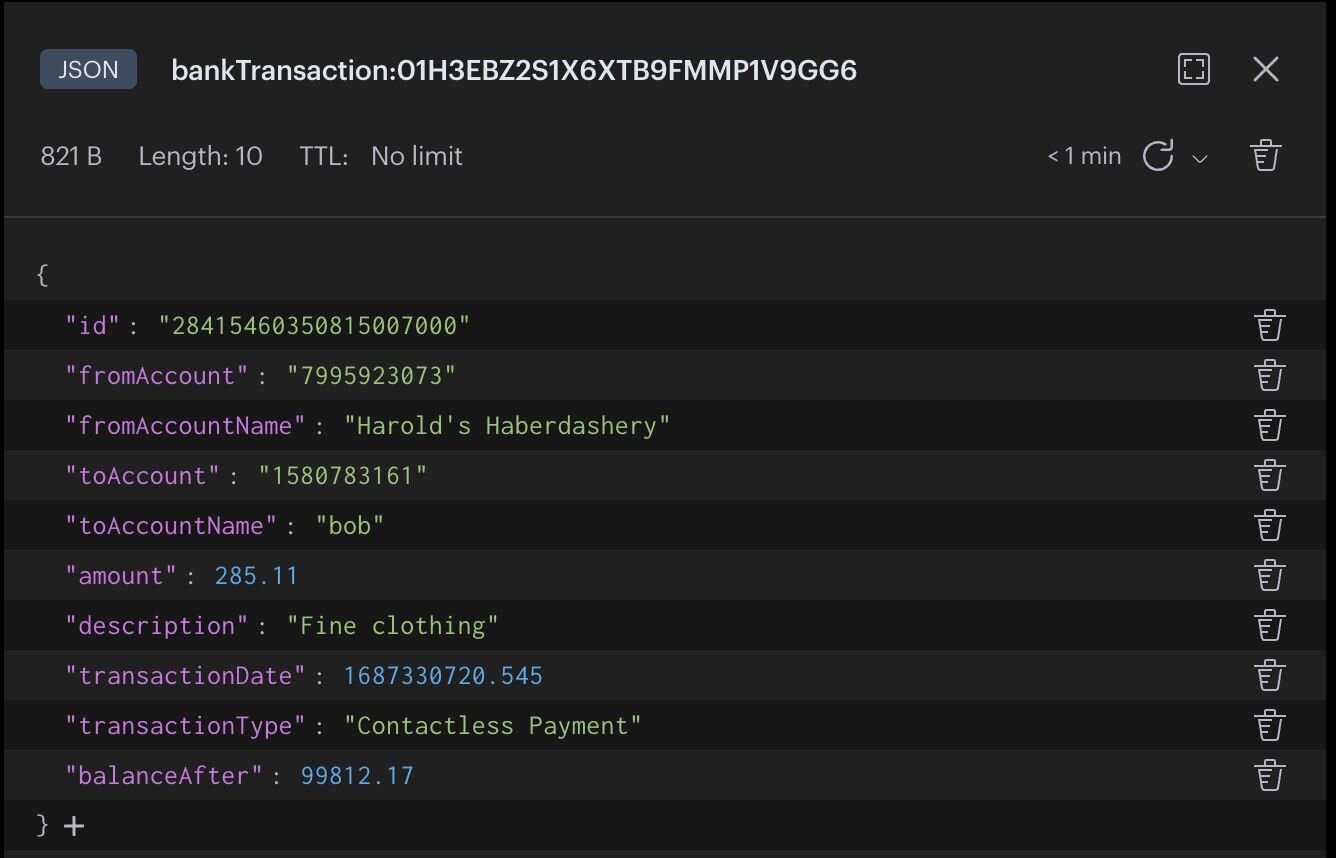
app/server.js, a cron is scheduled to create random bank transactions at regular intervals and seed those transactions in to Redis.- The transaction generator creates a randomized banking debit or credit which will reflect on a (default) starting user balance of $100,000.00
- The transaction data is saved as a JSON document within Redis.
- To capture balance over time, the
balanceAftervalue is recorded in a TimeSeries with the keybalance_tsfor every transaction. - To track biggest spenders, an associated
**fromAccountName**member within the sorted setbigspendersis incremented by the transaction amount. Note that this amount can be positive or negative.
Sample bankTransaction data view using Redis Insight
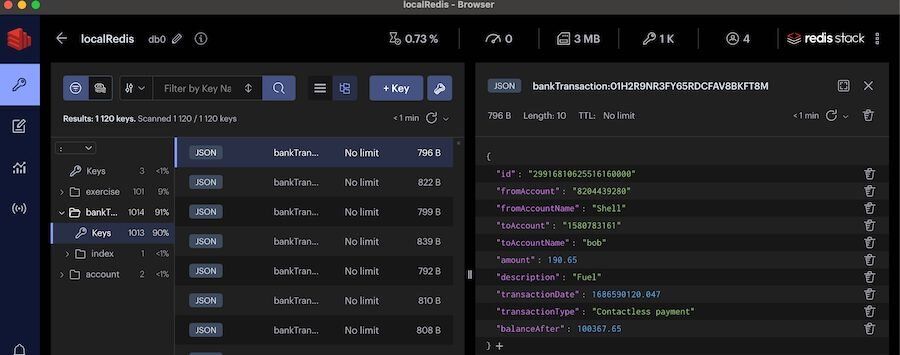
TIPDownload Redis Insight to view your Redis data or to play with raw Redis commands in the workbench.
#How do you track balance over time with Redis Time Series?
Dashboard widget:
| Endpoint | /transaction/balance |
| Code location | /routers/transaction-router.js |
| Parameters | none |
| Return value | [{x: timestamp, y: value}, ...] |
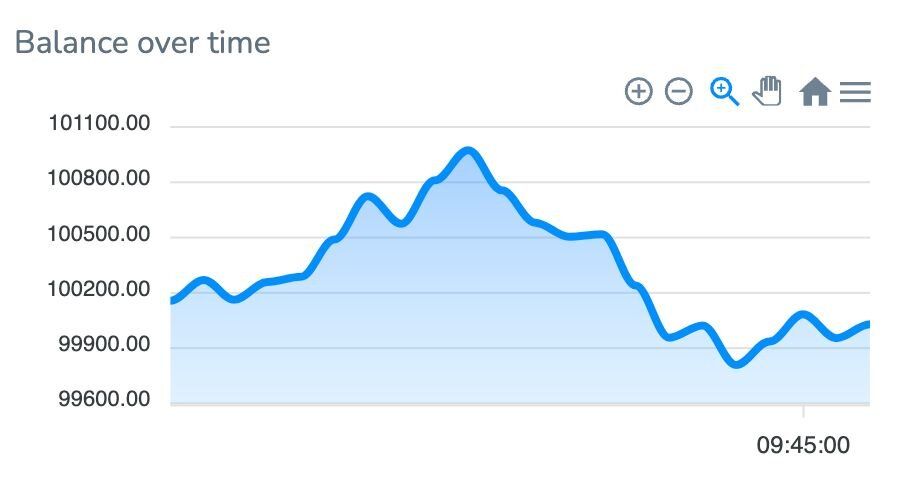
The balance endpoint leverages Time Series, It returns the range of all values from the time series object
balance_ts. The resulting range is converted to an array of objects with each object containing an x property containing the timestamp and a y property containing the associated value. This endpoint supplies the time series chart with coordinates to plot a visualization of the balance over time.#How do you identify the biggest spenders with Redis sorted sets?
Dashboard widget:
| Endpoint | /transaction//biggestspenders |
| Code Location | /routers/transaction-router.js |
| Parameters | none |
| Return value | {labels:[...], series:[...]} |
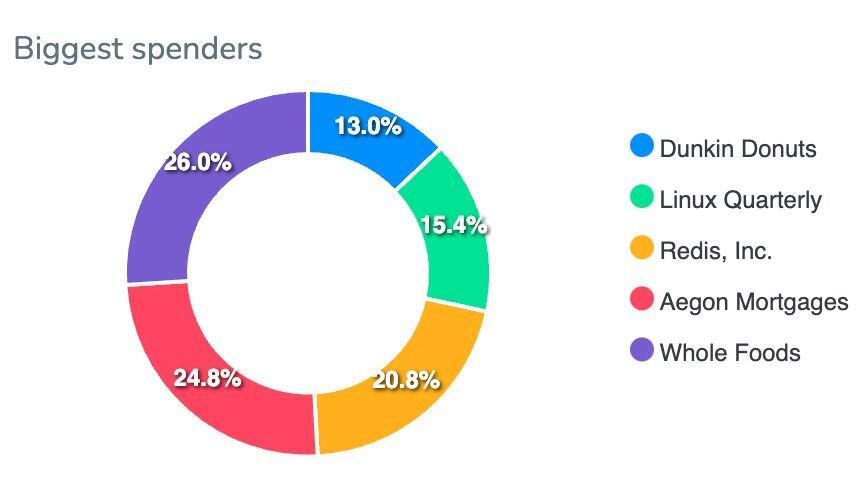
The biggest spenders endpoint leverages sorted sets as a secondary index, It retrieves all members of the sorted set
bigspenders that have scores greater than zero. The top five or fewer are returned to provide the UI pie chart with data. The labels array contains the names of the biggest spenders and the series array contains the numeric values associated with each member name.#How do you search existing transactions with Redis?
Dashboard widget:
| Endpoint | /transaction/search |
| Code Location | /routers/transaction-router.js |
| Query Parameters | term |
| Return value | array of results matching term |
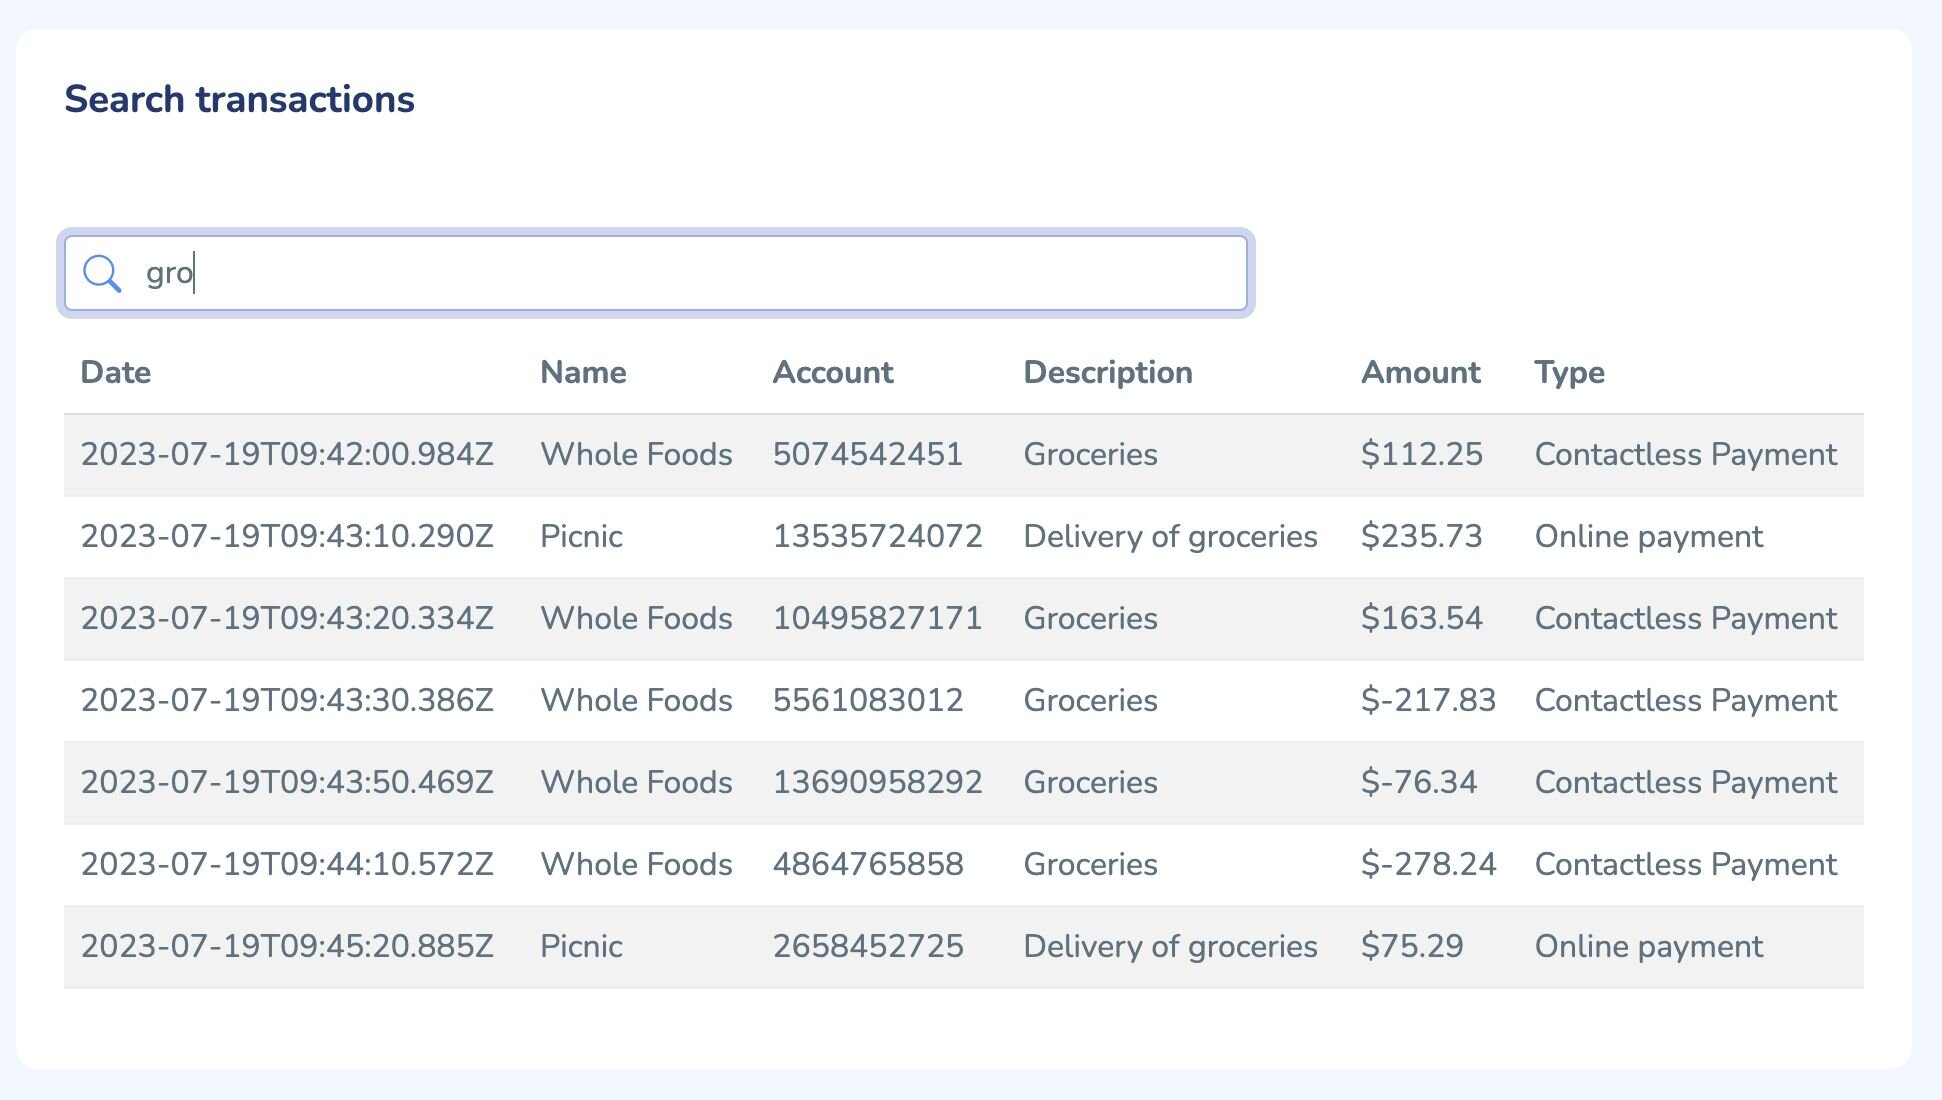
The search endpoint leverages Search and Query, It receives a
term query parameter from the UI. A Redis om Node query for the fields description, fromAccountName, and accountType will trigger and return results.#How do you fetch recent transactions?
Dashboard widget:
| Endpoint | /transaction/transactions |
| Code Location | /routers/transaction-router.js |
| Parameters | none |
| Return value | array of results |
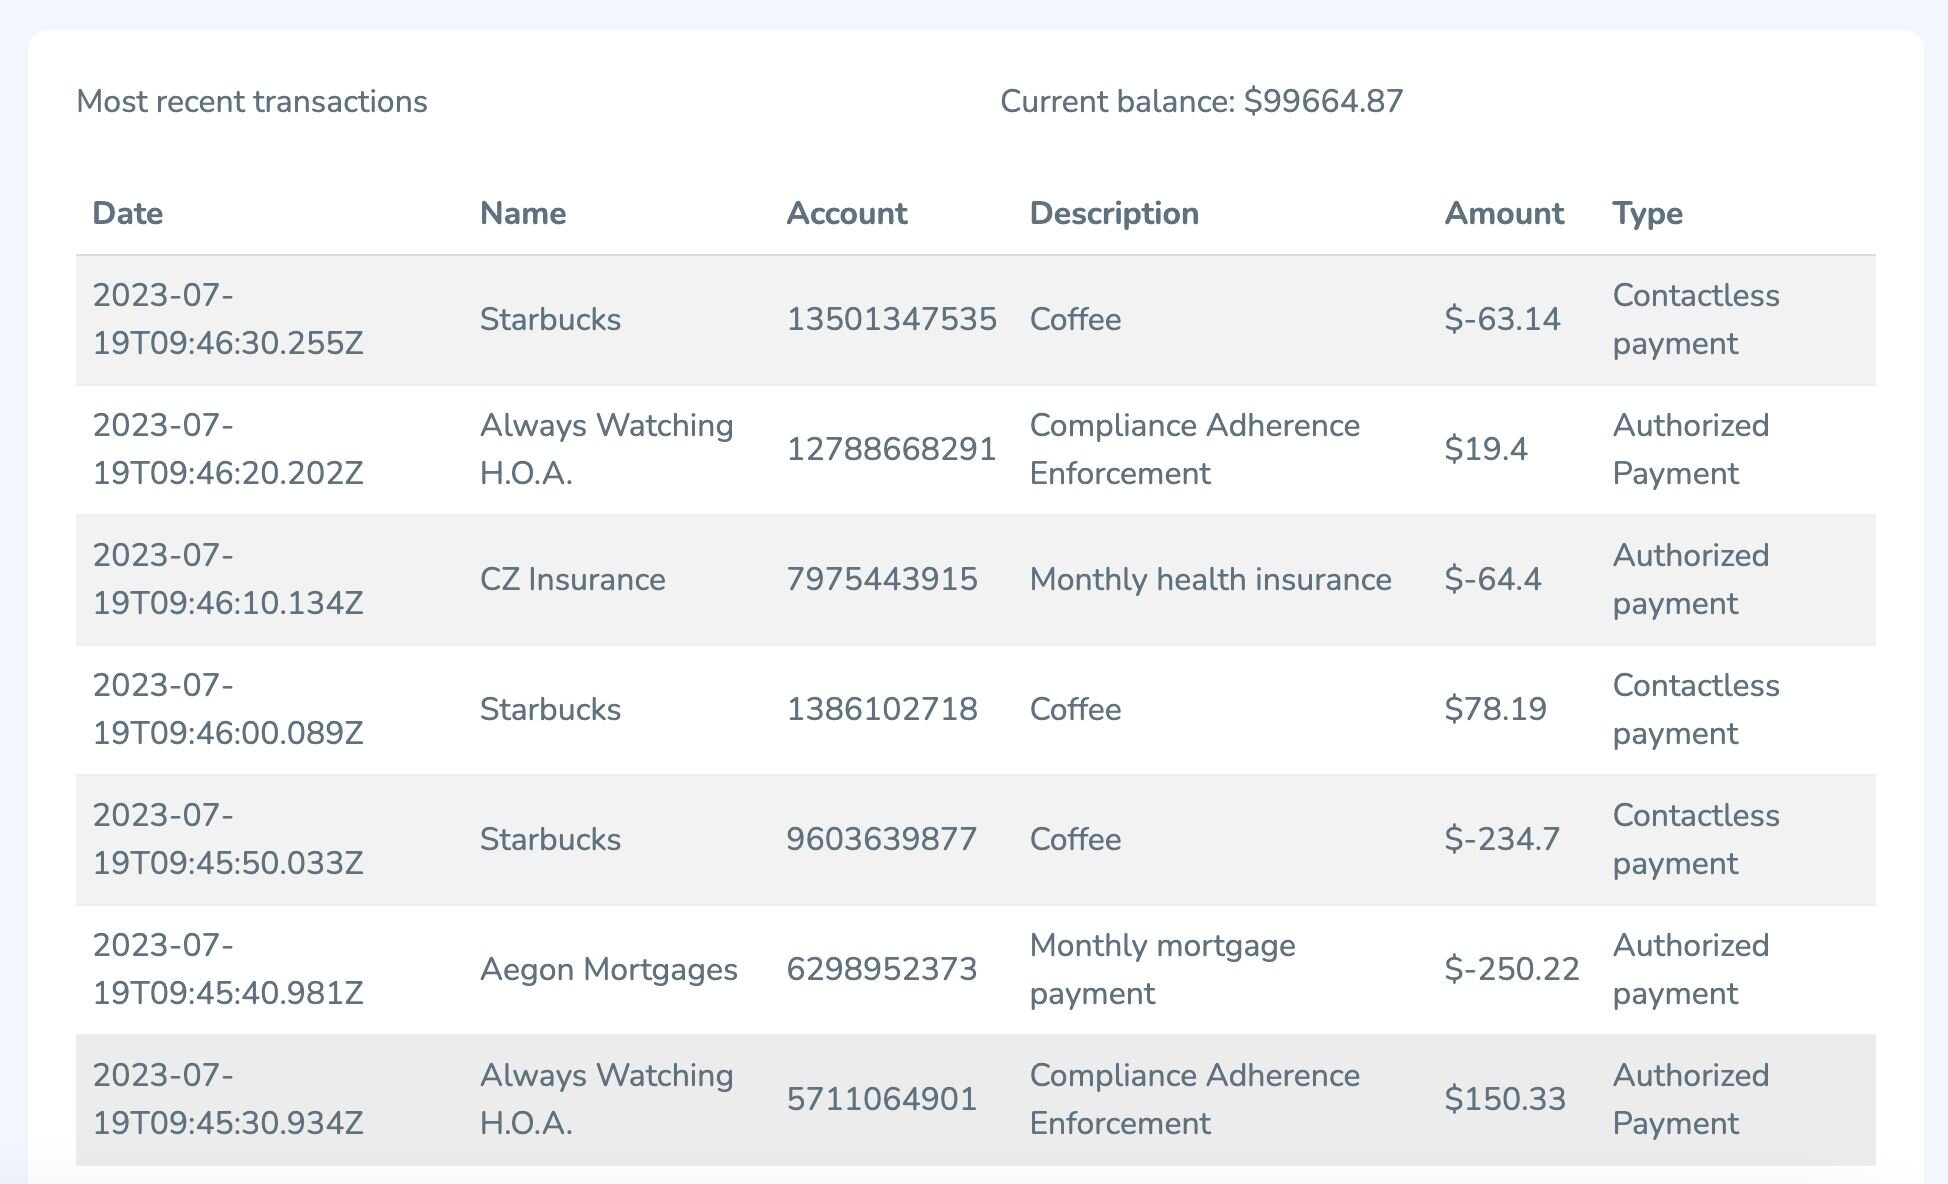
Even the transactions endpoint leverages Search and Query. A Redis om Node query will trigger and return ten most recent transactions.
#What are the next steps?
Now that you've built a mobile banking account dashboard with Redis, consider exploring these related tutorials and resources:
- Mobile Banking Session Management: Learn how to manage user sessions in your mobile banking app with Redis for secure, low-latency authentication
- Fraud Detection with Transaction Risk Scoring: Add real-time fraud scoring to your banking transactions using Redis
- Redis YouTube channel: Video walkthroughs and deep dives on Redis features
- Clients like Node Redis and Redis OM Node help you to use Redis in Node.js apps
- Redis Insight: Visualize your Redis data and experiment with commands in the workbench
- Try Redis Cloud for free: Get started with a free Redis Cloud instance