
TL;DR:Install the Datadog Redis Software integration, point it at your cluster's API endpoint, and you get out-of-the-box dashboards for latency, memory usage, cache hit rate, throughput, and connection count. Set alerts on these metrics to catch performance issues before they affect users.
#What you'll learn
- Which Redis performance metrics to monitor and why they matter
- How to install and configure the Datadog Redis Software integration
- How to choose between External Monitor Mode and Localhost Mode
- How to read the built-in Datadog dashboards for Redis
- How to troubleshoot common Redis performance issues using Datadog metrics
#Prerequisites
- A running Redis Software cluster and database
- A Datadog account with an API key
- A read-only user on your Redis Software cluster (see Getting started below)
- Basic familiarity with Linux command-line tools
#Why do SLOs matter for Redis monitoring?
DevOps and SRE practitioners are already keenly aware of the importance of system reliability, as it's one of the shared goals in every high performing organization. Defining clear reliability targets based on solid data is crucial for productive collaboration between devs and SREs. This need spans the entire infrastructure from application to backend database services.
Service Level Objectives (SLOs) provide a powerful interface for all teams to set clear performance and reliability goals based on Service Level Indicators (SLIs) or data points. A good model is to think of the SLIs as the data and the SLO as the information one uses to make critical decisions.
#What Redis metrics should you track?
Redis is a popular multi-model NoSQL database server that provides in-memory data access speeds for search, messaging, streaming, caching, and graph, amongst other capabilities. Highly performant sites such as Twitter, Snapchat, Freshworks, GitHub, Docker, Pinterest, and Stack Overflow all look to Redis to move data fast.
Redis SLOs can be broken down into three main categories:
| Category | Definition | Example SLO | Example SLI |
| Throughput | Number of operations being pushed through the service in a given time period | System should be capable of performing 200M operations per second | redisenterprise.total_req |
| Latency | Elapsed time it takes for an operation | Average write latency should not exceed 1 millisecond | redis_enterprise.avg_latency |
| Capacity | Memory/storage/network limits of the underlying data source | Database should have 20% memory overhead available to handle bursts | redisenterprise.used_memory_percent |
#Why use Datadog for Redis monitoring?
Running your own performance data platform is time consuming and difficult. Datadog provides an excellent platform with an open source agent to collect metrics and allows them to be displayed easily and alerted upon when necessary.
Datadog allows you to:
- Collect metrics from various infrastructure components out of the box
- Display that data in easy to read dashboards
- Monitor performance metrics and alert accordingly
- Correlate log entries with metrics to quickly drill down to root causes
#What are the key Redis performance indicators?
#1. How do you monitor Redis latency?
#redisenterprise.avg_latency (unit: microseconds)
This is the average amount of time that a request takes to return from the time that it first hits the Redis Software proxy until the response is returned. It does not include the full time from the remote client's perspective.
#What causes high Redis latency?
Since Redis is popular due to being fast, generally you would expect most operations to return in single digit milliseconds. Tune any alerts to match your SLA. It's generally recommended that you also measure Redis operation latency at the client side to make it easier to determine if a server slow down or an increase in network latency is the culprit in any performance issues.
| Cause | Factors |
| Spike in requests | Check both the Network Traffic and Operations Per Second metrics to determine if there is a corresponding increase |
| Slow-running queries | Check the slow log in the Redis Software UI for the database |
| Insufficient compute resources | Check to see if the CPU Usage, Memory Usage Percentage, or Evictions are increasing |
#How do you fix Redis latency issues?
| Action | Method |
| Increase resources | The database can be scaled up online by going to the web UI and enabling clustering on the database. In extreme cases, more nodes can be added to the cluster and resources rebalanced |
| Inefficient queries | Redis allows you to view a slow log with a tunable threshold. It can be viewed either in the Redis Software UI or by running: redis-cli -h HOST -p PORT -a PASSWORD SLOWLOG GET 100 |
#2. How do you track Redis memory usage?
#redisenterprise.memory_usage_percent (unit: percentage)
This is the percentage of used memory over the memory limit set for the database.
#What affects Redis memory usage?
In Redis Software, all databases have a maximum memory limit set to ensure isolation in a multi-tenant environment. This is also highly recommended when running open source Redis. Be aware that Redis does not immediately free memory upon key deletion. Depending on the size of the database, generally between 80-95% is a safe threshold.
| Cause | Factors |
| Possible spike in activity | Check both the Network Traffic and Operations Per Second metrics to determine if there is a corresponding increase |
| Database sized incorrectly |
View the Memory Usage raw bytes over time to see if a usage pattern has changed |
| Incorrect retention policies | Check to see if keys are being Evicted or Expired |
#How do you reduce Redis memory pressure?
| Action | Method |
| Increase resources | The database memory limit can be raised online with no downtime through either the Redis Software UI or the API |
| Retention Policy | In a caching use case, setting a TTL for unused data to expire is often helpful. In addition, Eviction policies can be set, however, these may often not be able to keep up in extremely high throughput environments with very tight resource constraints |
#3. What is Redis cache hit rate and why does it matter?
#redisenterprise.cache_hit_rate (unit: percent)
This is the percentage of time that Redis is accessing a key that already exists.
#When should you monitor cache hit rate?
This metric is useful only in the caching use case and should be ignored for all other use cases. There are tradeoffs between the freshness of the data in the cache and efficacy of the cache mitigating traffic to any backend data service. These tradeoffs should be considered carefully when determining the threshold for alerting.
#What causes a low cache hit rate?
This is highly specific to the application caching with no general rules that are applicable in the majority of cases.
Note that Redis commands return information on whether a key or field already exists. For example, the HSET command returns the number of fields in the hash that were added.
#4. What do Redis evictions mean?
#redisenterprise.evicted_objects (unit: count)
This is the count of items that have been evicted from the database.
#When do Redis evictions occur?
Eviction occurs when the database is close to capacity. In this condition, the eviction policy starts to take effect. While Expiration is fairly common in the caching use case, Eviction from the cache should generally be a matter of concern. At very high throughput and very restricted resource use cases, sometimes the eviction sweeps cannot keep up with memory pressure. Relying on Eviction as a memory management technique should be considered carefully.
#What causes evictions and how do you fix them?
See How do you track Redis memory usage? for possible causes and remediation steps.
#What secondary indicators should you watch?
#1. Network traffic
#redisenterprise.ingress_bytes/redisenterprise.egress_bytes (unit: bytes)
Counters for the network traffic coming into the database and out from the database.
While these two metrics will not help you pinpoint a root cause, network traffic is an excellent leading indicator of trouble. Changes in network traffic patterns indicate corresponding changes in database behavior and further investigation is usually warranted.
#2. Connection count
#redisenterprise.conns (unit: count)
The number of current client connections to the database.
#Why does connection count matter?
This metric should be monitored with both a minimum and maximum number of connections. The minimum number of connections not being met is an excellent indicator of either networking or application configuration errors. The maximum number of connections being exceeded may indicate a need to tune the database.
| Cause | Factors |
| Minimum clients not met | Incorrect client configuration, network firewall, or network issues |
| Maximum connections exceeded | Client library is not releasing connections or an increase in the number of clients |
#How do you fix connection count issues?
| Action | Method |
| Clients Misconfigured | Confirm client configurations |
| Networking issue | Issue the PING command from a client node TELNET to the endpoint |
| Too many connections | Be sure that you are using pooling on your client library and that your pools are sized accordingly |
| Too many connections | Using rladmin, run: tune proxy PROXY_NUMBER threads VALUE threads VALUE |
For more information, see the complete list of metrics.
#How do you set up the Datadog agent for Redis?
Follow the steps below to set up the Datadog agent to monitor your Redis Software cluster, as well as database metrics:
#Step 1. Create a read-only user
- Set up your Redis Software cluster and database if you haven't already
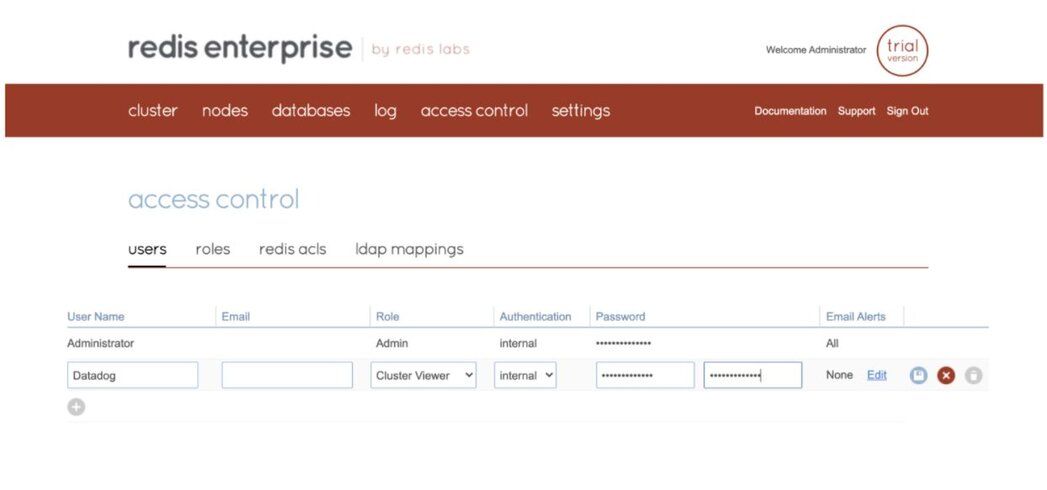
- Create a read-only user account by logging into your Redis Software instance and visiting the "Access Control" section
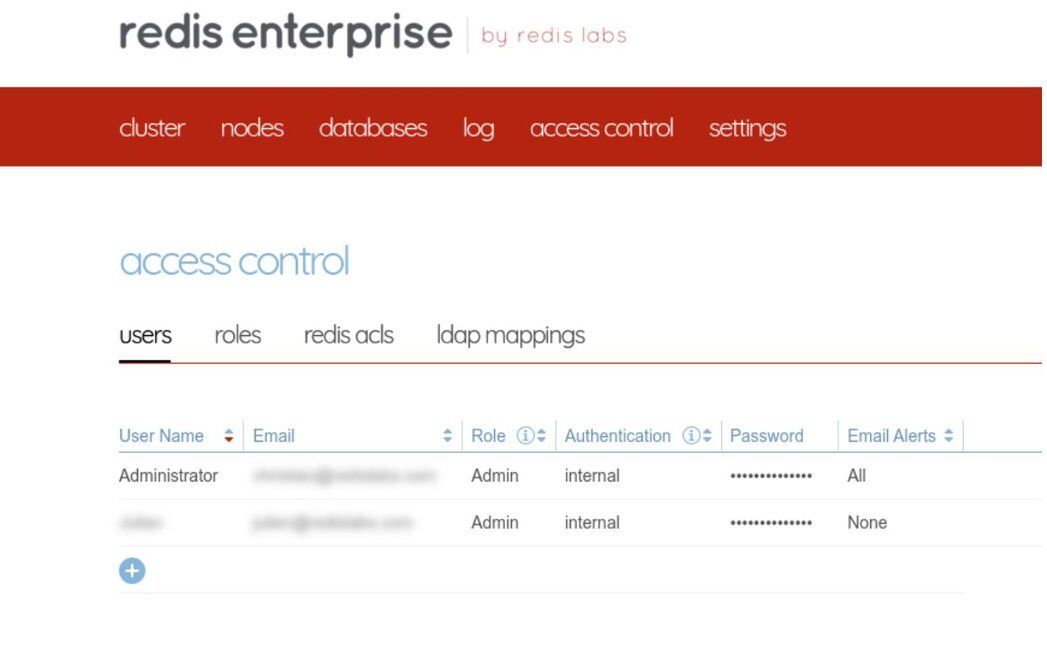
- Add a new user account with Cluster View Permissions.
#Step 2. Choose a monitoring mode
Before we jump into the installation, let's look at the various modes that you can run the Datadog agent in:
- External Monitor Mode
- Localhost Mode
#What is External Monitor Mode?
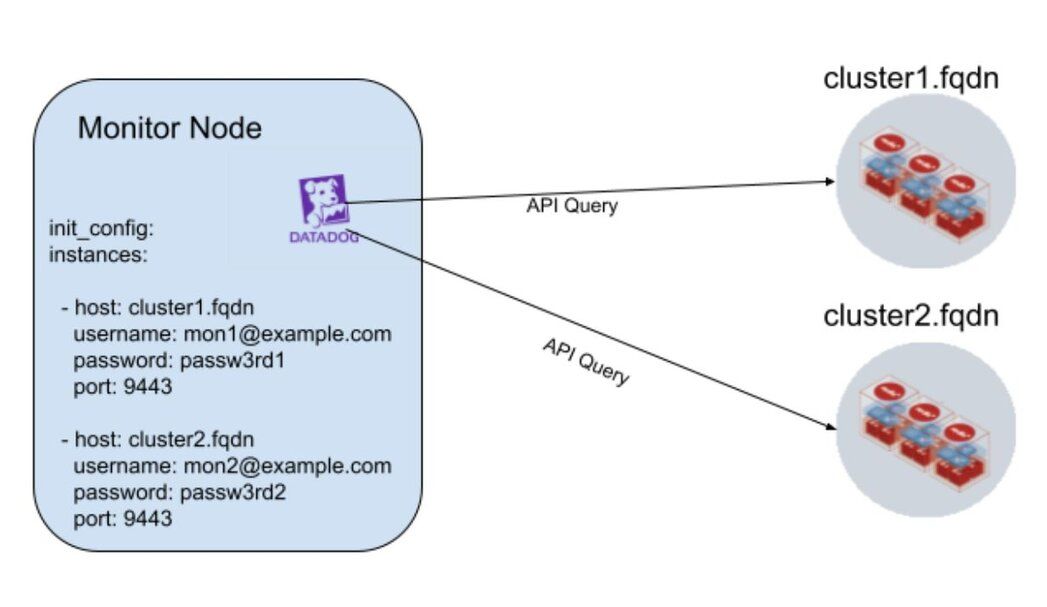
In external monitor mode, a Datadog agent running outside of the cluster can monitor multiple Redis Software clusters, as shown in the diagram above.
#What is Localhost Mode?
Using localhost mode, the integration can be installed on every node of a Redis Software cluster. This allows the user to correlate OS level metrics with Redis-specific metrics for faster root cause analysis. Only the Redis Software cluster leader will submit metrics and events to Datadog. In the event of a migration of the cluster leader, the new cluster leader will begin to submit data to Datadog.
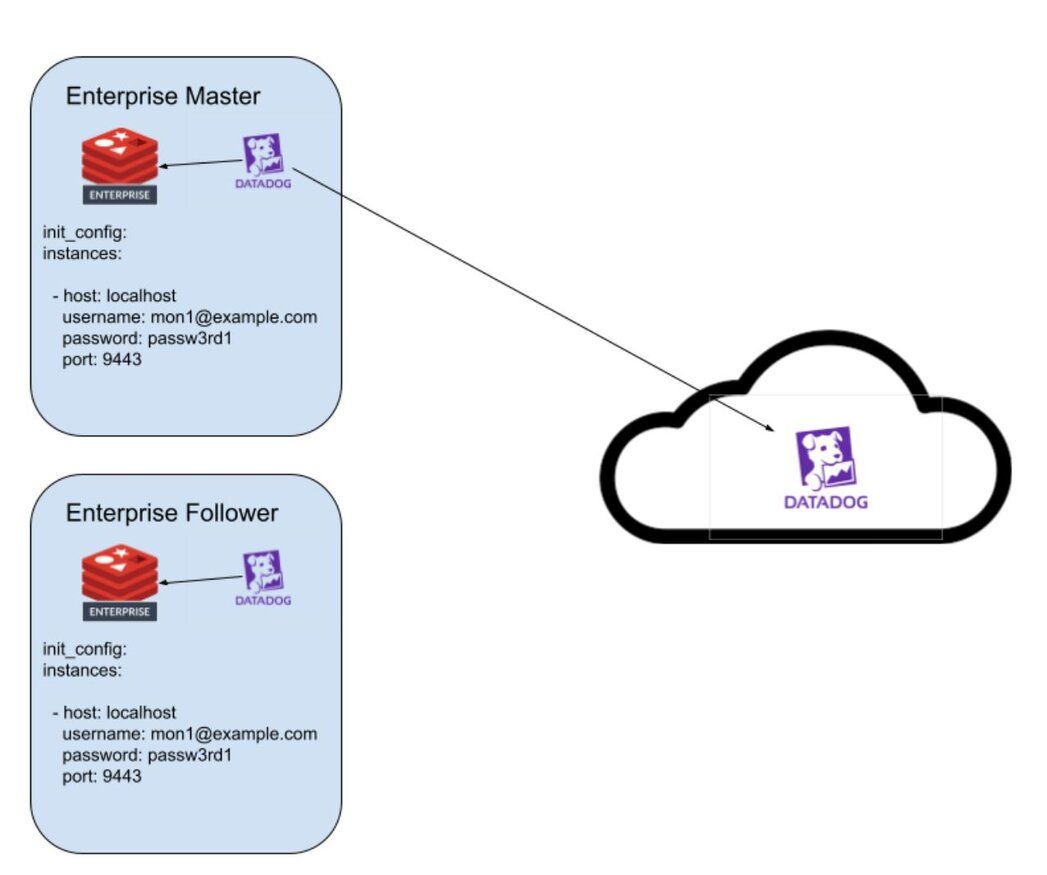
For this demo, we will be leveraging localhost mode as we just have two nodes to configure.
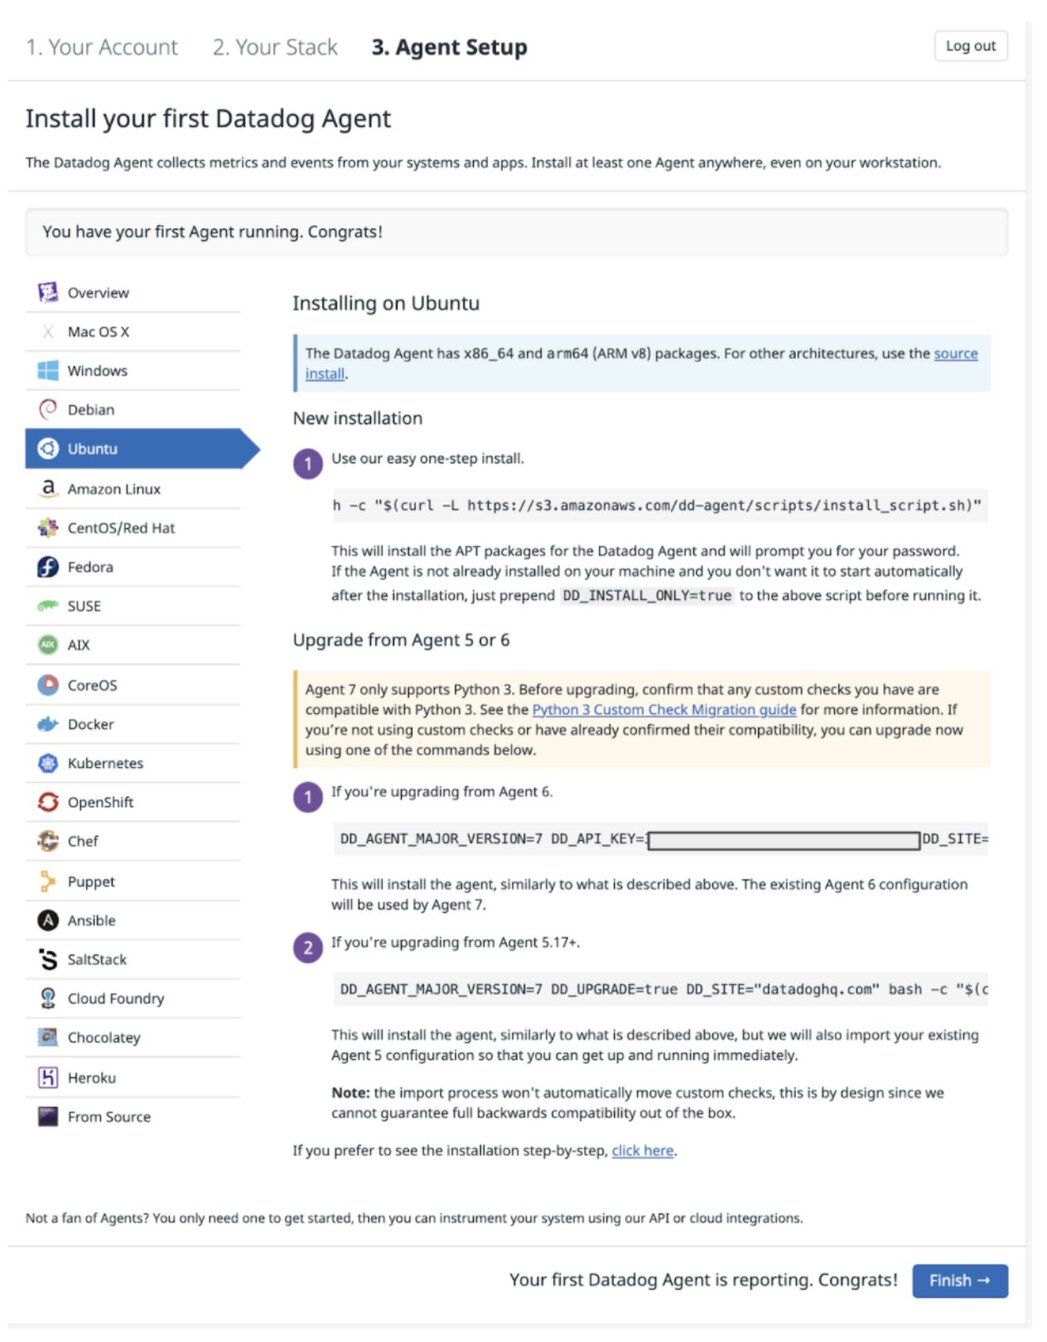
#Step 3. Install the Datadog Agent
Pick up your preferred OS distribution and install the Datadog agent
Run the following command to install the integration wheel with the Agent. Replace the integration version with 1.0.1.
#Step 4. Configure the Datadog integration
Copy the sample configuration and update the required sections to collect data from your Redis Software cluster:
#Localhost Mode configuration
The following minimal configuration should be added to the Enterprise Master node.
Similarly, you need to add the edit the configuration file for the Enterprise Follower to add the following:
#External Monitor Mode configuration
The following configuration should be added to the Monitor node
#Step 5. Restart the Datadog Agent service
#Step 6. View the Datadog dashboard
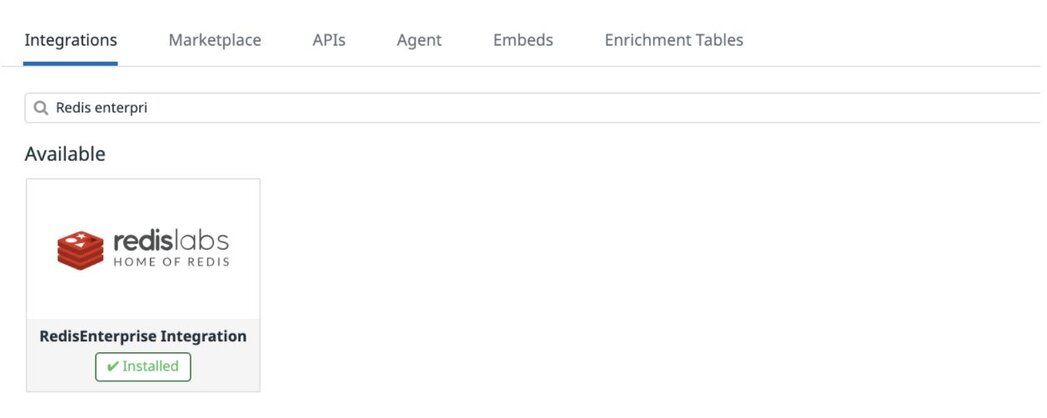
Find the Redis Software Integration under the Integration Menu:
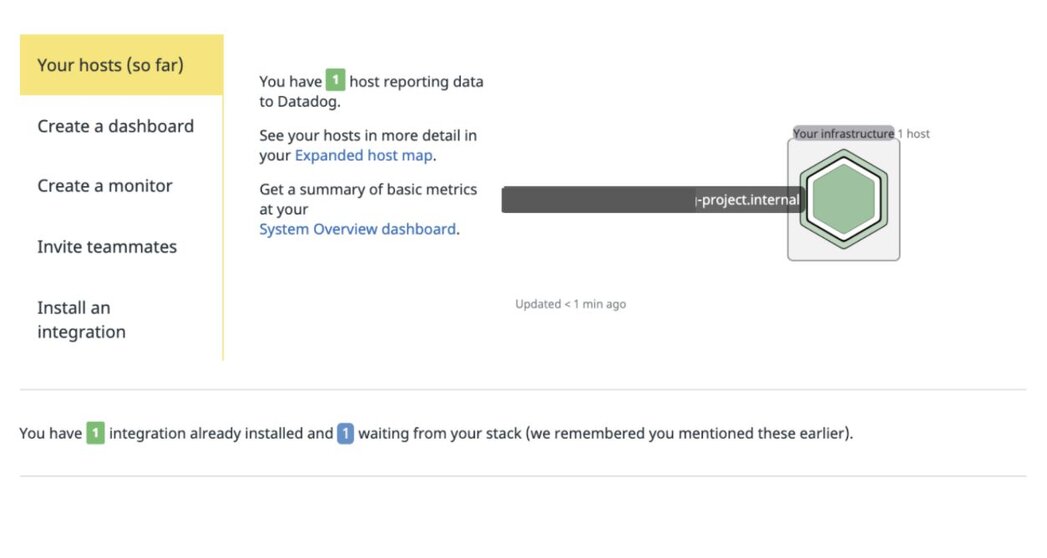
Displaying the host reporting data to Datadog:
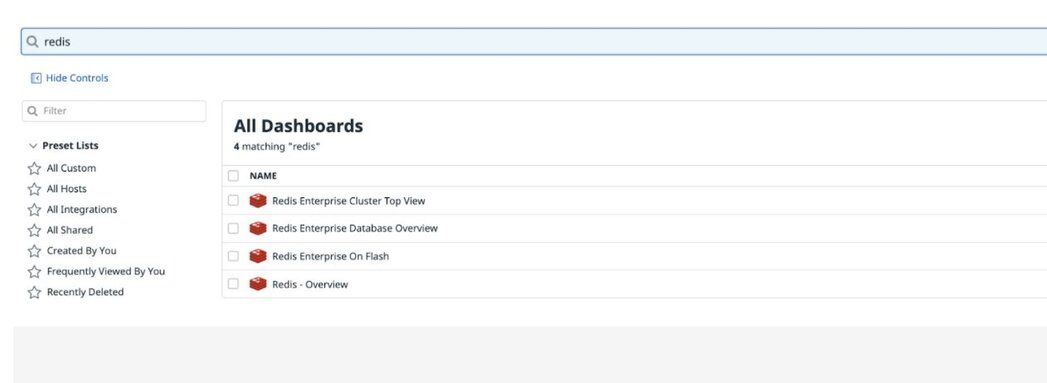
Listing the Redis Software dashboards:
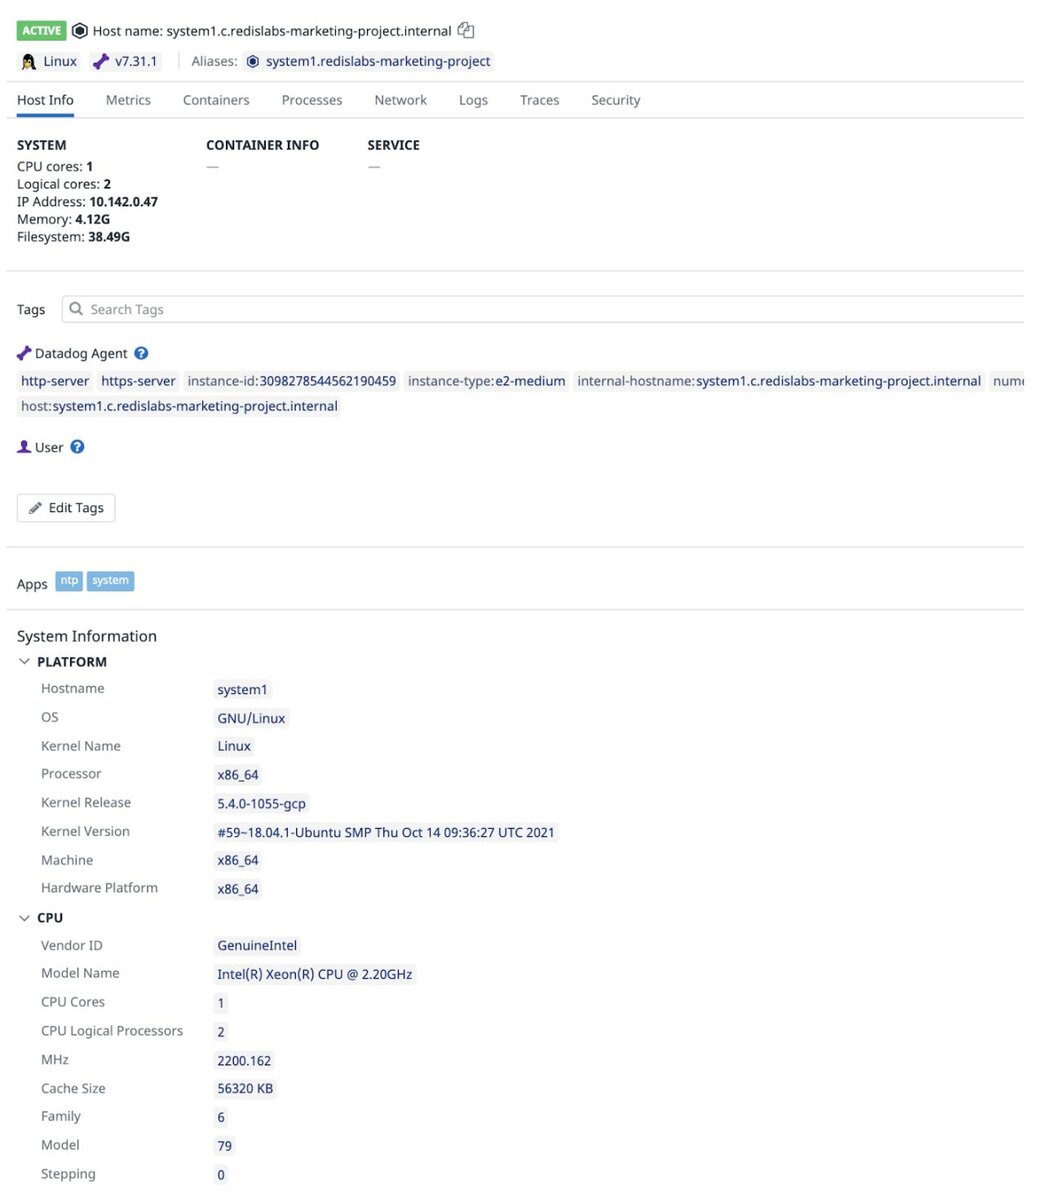
Host details under Datadog Infrastructure list:
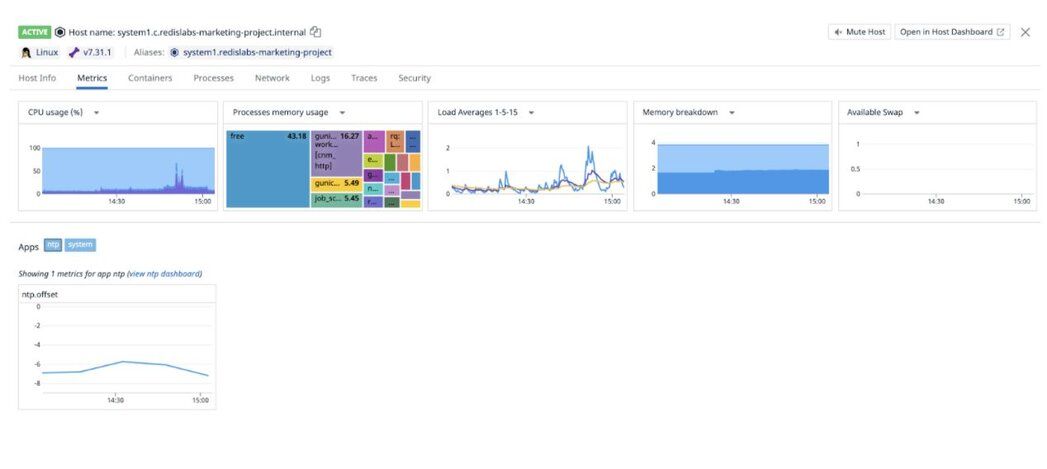
Datadog dashboard displaying host metrics of the 1st host (CPU, Memory Usage, Load Average etc):
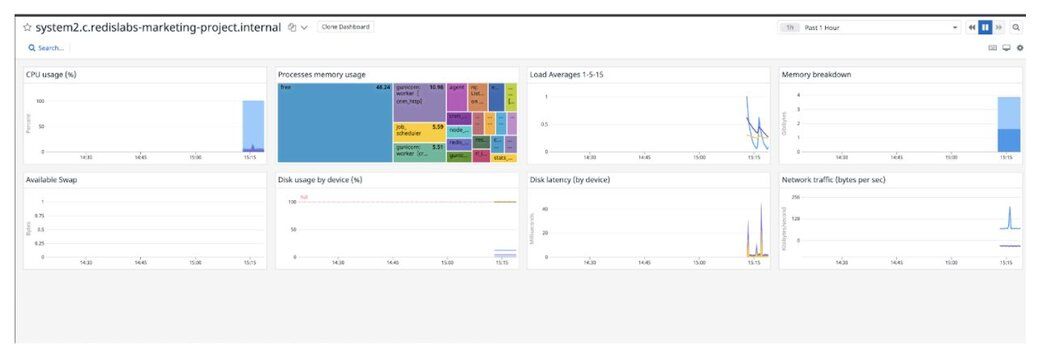
Datadog dashboard displaying host metrics of the 2nd host:
#Step 7. Verify the Datadog Agent status
Running the
datadog-agent command shows that the Redis Software integration is working correctly.#Redis Software cluster top view
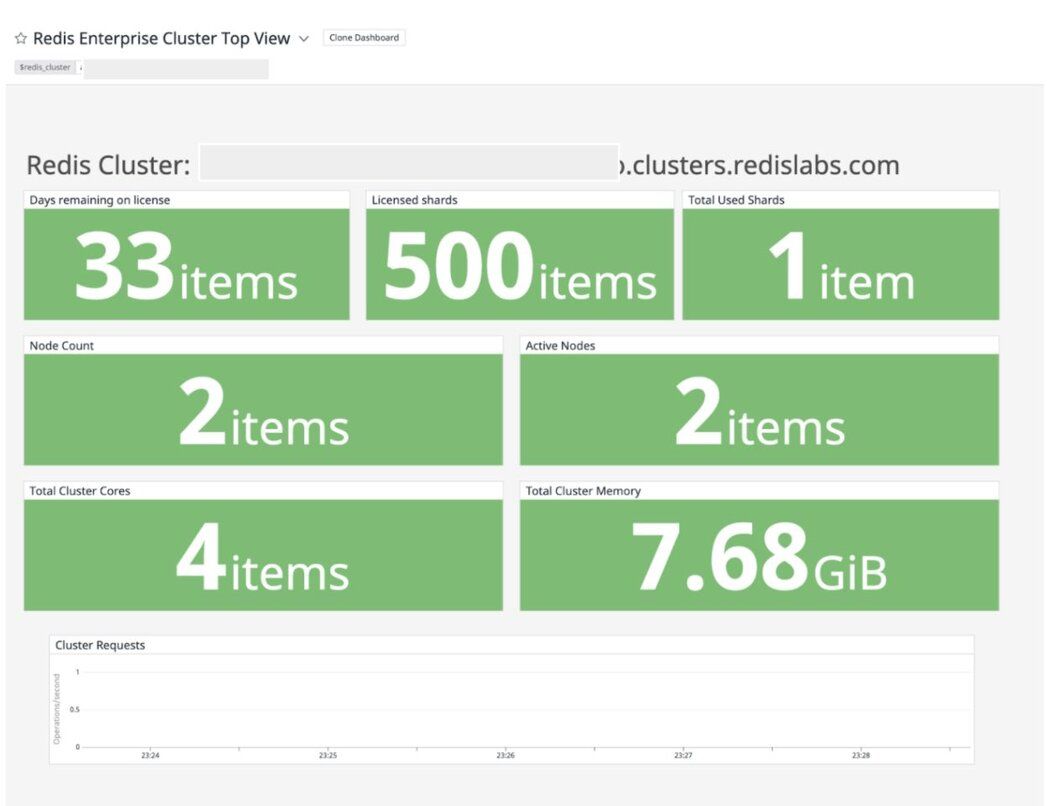
Let's run a memory benchmark tool called redis-benchmark to simulate an arbitrary number of clients connecting at the same time and performing actions on the server, measuring how long it takes for the requests to be completed.
This command instructs memtier_benchmark to connect to your Redis Software database and generates a load doing the following:
- Write objects only, no reads.
- Each object is 500 bytes.
- Each object has random data in the value.
- Each key has a random pattern, then a colon, followed by a random pattern.
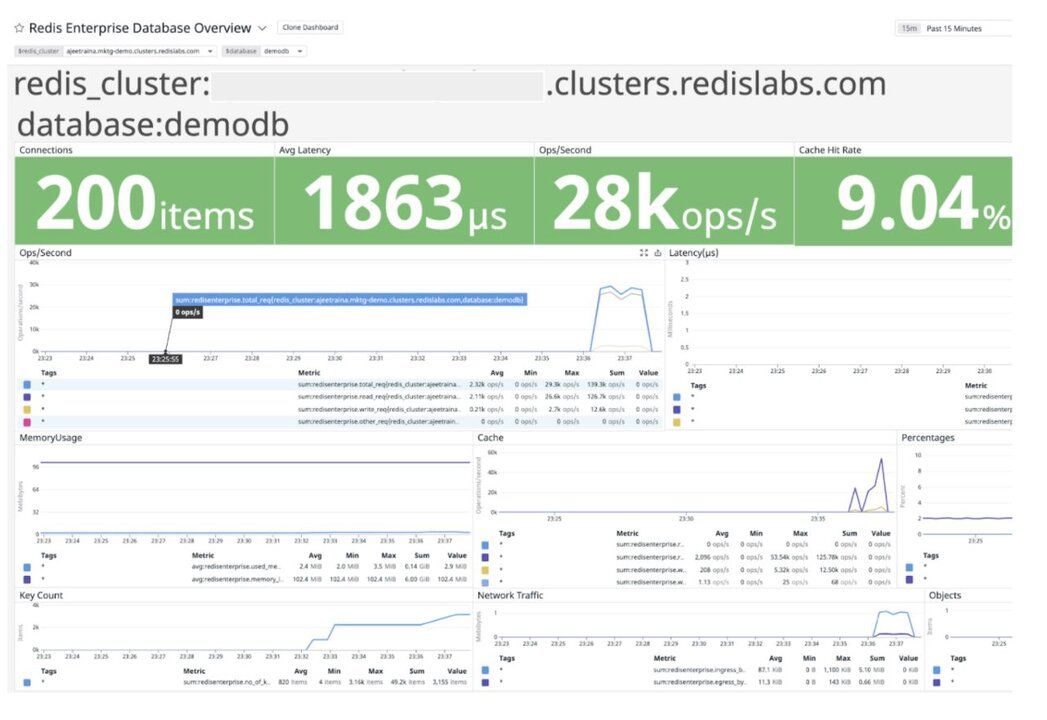
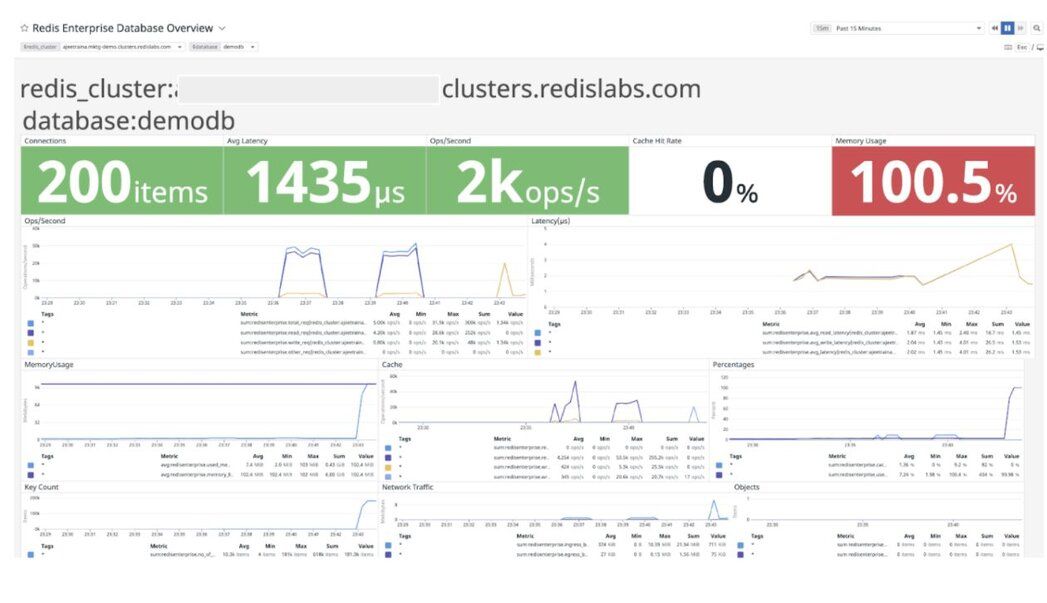
Run this command until it fills up your database to where you want it for testing. The easiest way to check is on the database metrics page.
The Datadog Events Stream shows an instant view of your infrastructure and services events to help you troubleshoot issues happening now or in the past. The event stream displays the most recent events generated by your infrastructure and the associated monitors.
#Next steps
Now that you have Datadog monitoring your Redis deployment, explore these related tutorials:
- Redis Software Observability with Prometheus and Grafana to compare monitoring approaches or add Prometheus as a secondary data source
- Redis as a Grafana Datasource to build custom analytics dashboards directly from your Redis data