Tutorial
How to add Redis as a datasource in Grafana and build customize dashboards for Analytics
February 26, 20267 minute read

TL;DR:Install the Redis Data Source plug-in for Grafana, point it at your Redis instance, and import the predefined dashboard to start visualizing Redis metrics. You can also create custom panels to monitor the specific data points that matter to your application.
The Redis Data Source for Grafana is a plug-in that allows users to connect to the Redis database and build dashboards in Grafana to easily monitor Redis and application data. It provides an out-of-the-box predefined dashboard, but also lets you build customized dashboards tuned to your specific needs.
#What you'll learn
- How to install Grafana and the Redis Data Source plug-in using Homebrew, Docker, or Docker Compose
- How to connect Redis as a Grafana datasource and configure connection settings
- How to import the predefined Redis dashboard for instant data visualization
- What Redis commands are supported by the Grafana Redis connector
- How to build custom analytics dashboards with Redis data in Grafana
#Prerequisites
- A running Redis instance (local, self-hosted, or Redis Cloud)
- One of the following installed on your system:
- Homebrew (macOS/Linux)
- Docker (v18.03+ on Windows/Mac)
- Docker Compose
- Basic familiarity with Grafana concepts (datasources, dashboards, panels)
#What features does the Redis Grafana datasource support?
- Grafana 7.1 and later with a new plug-in platform supported.
- Data Source can connect to any Redis database. No special configuration is required.
- Redis Cluster and Sentinel supported since version 1.2.
- Data Source supports:
- Redis Time Series:
TS.GET, TS.INFO, TS.MRANGE, TS.QUERYINDEX, TS.RANGE - Search:
FT.INFO
#How do you install the Redis Grafana datasource with Homebrew?
#Step 1. Install Grafana
#Step 2. Install the Redis datasource plug-in
Homebrew downloads and untars the files into /usr/local/Cellar/grafana/version.
#Step 3. Start the Grafana service
#Step 4. How do you access the Grafana dashboard?
Open
https://IP:3000 to access grafana. The default username/password is admin/admin.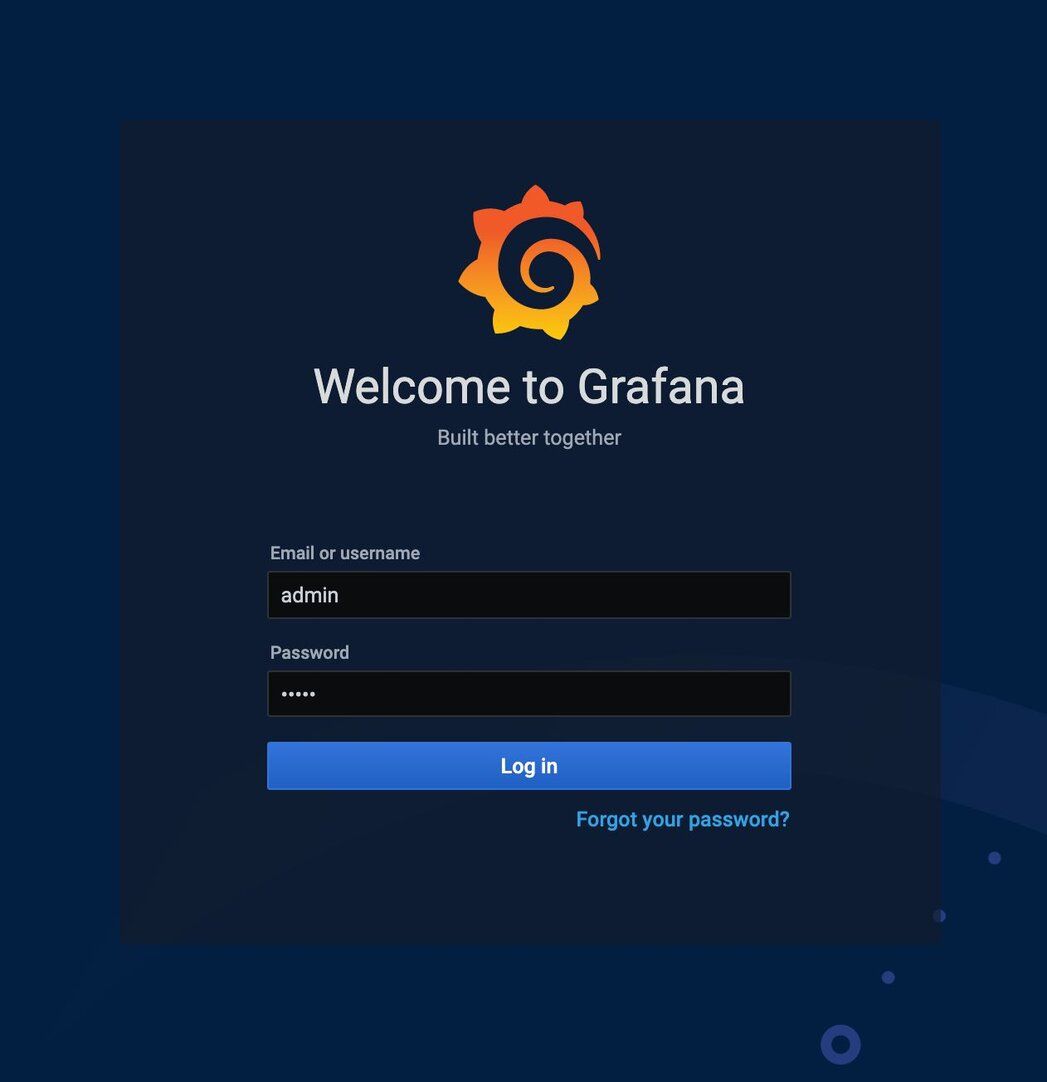
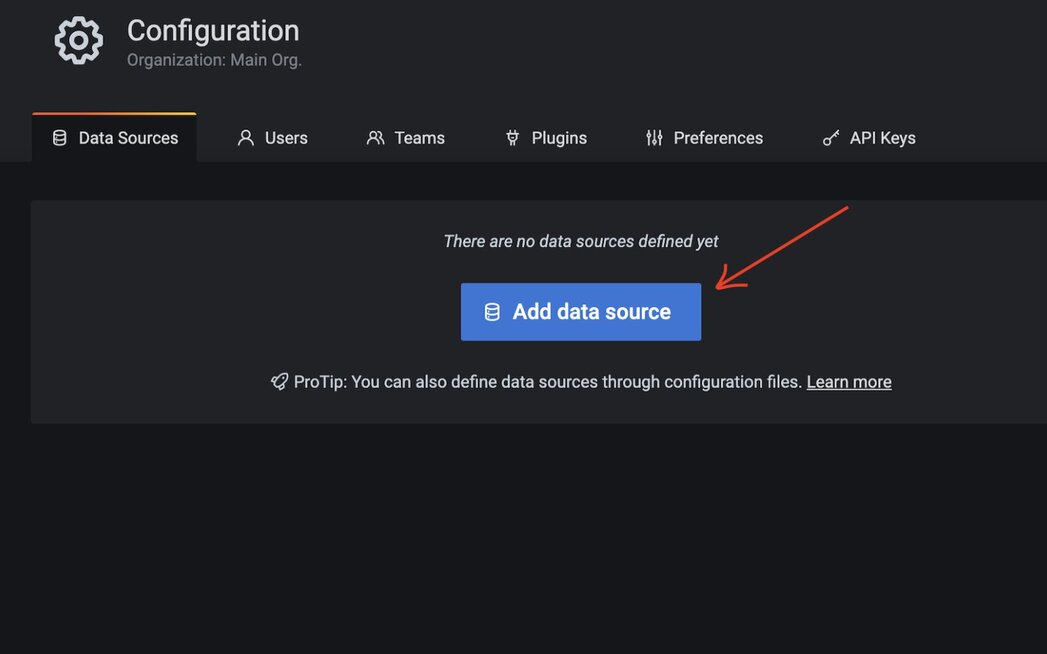
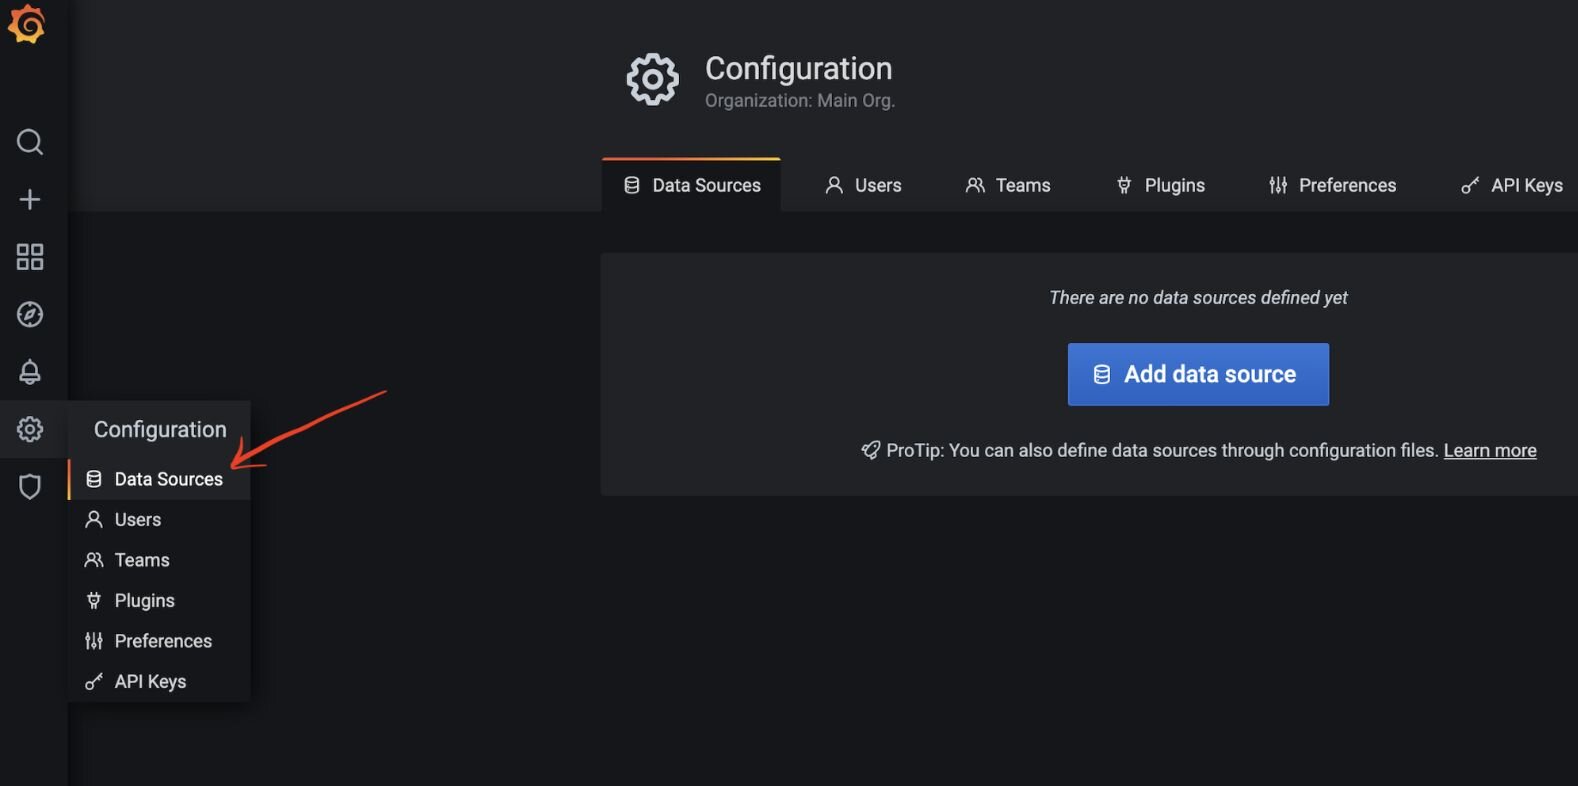
#Step 5. Open the Configuration menu

#Step 6. Add Redis as a data source
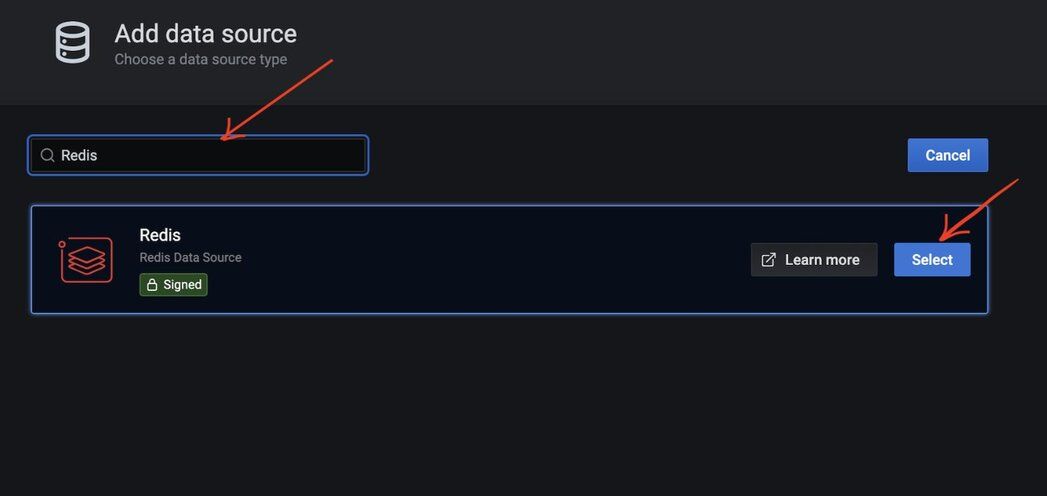
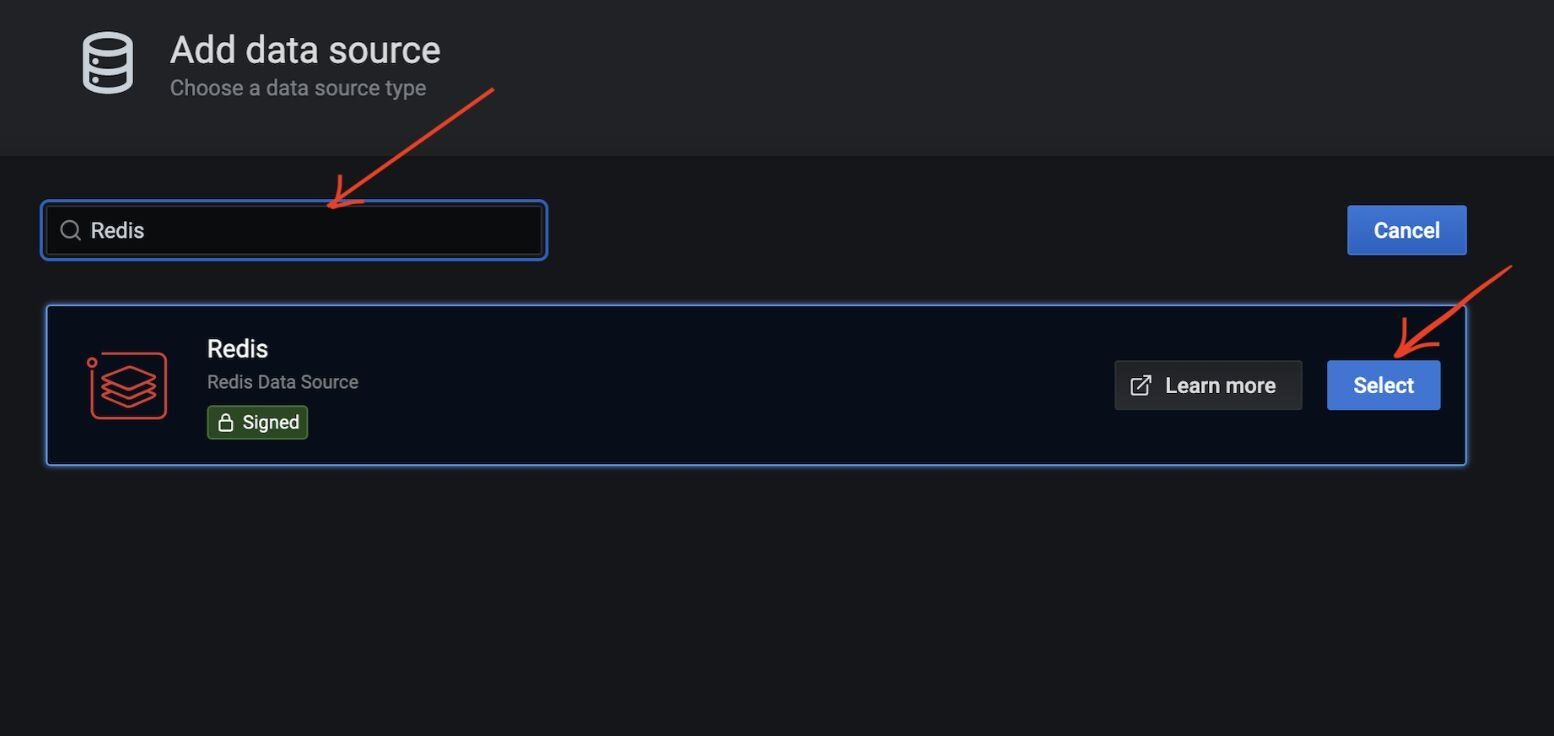
#Step 7. Select "Redis" as the data source type
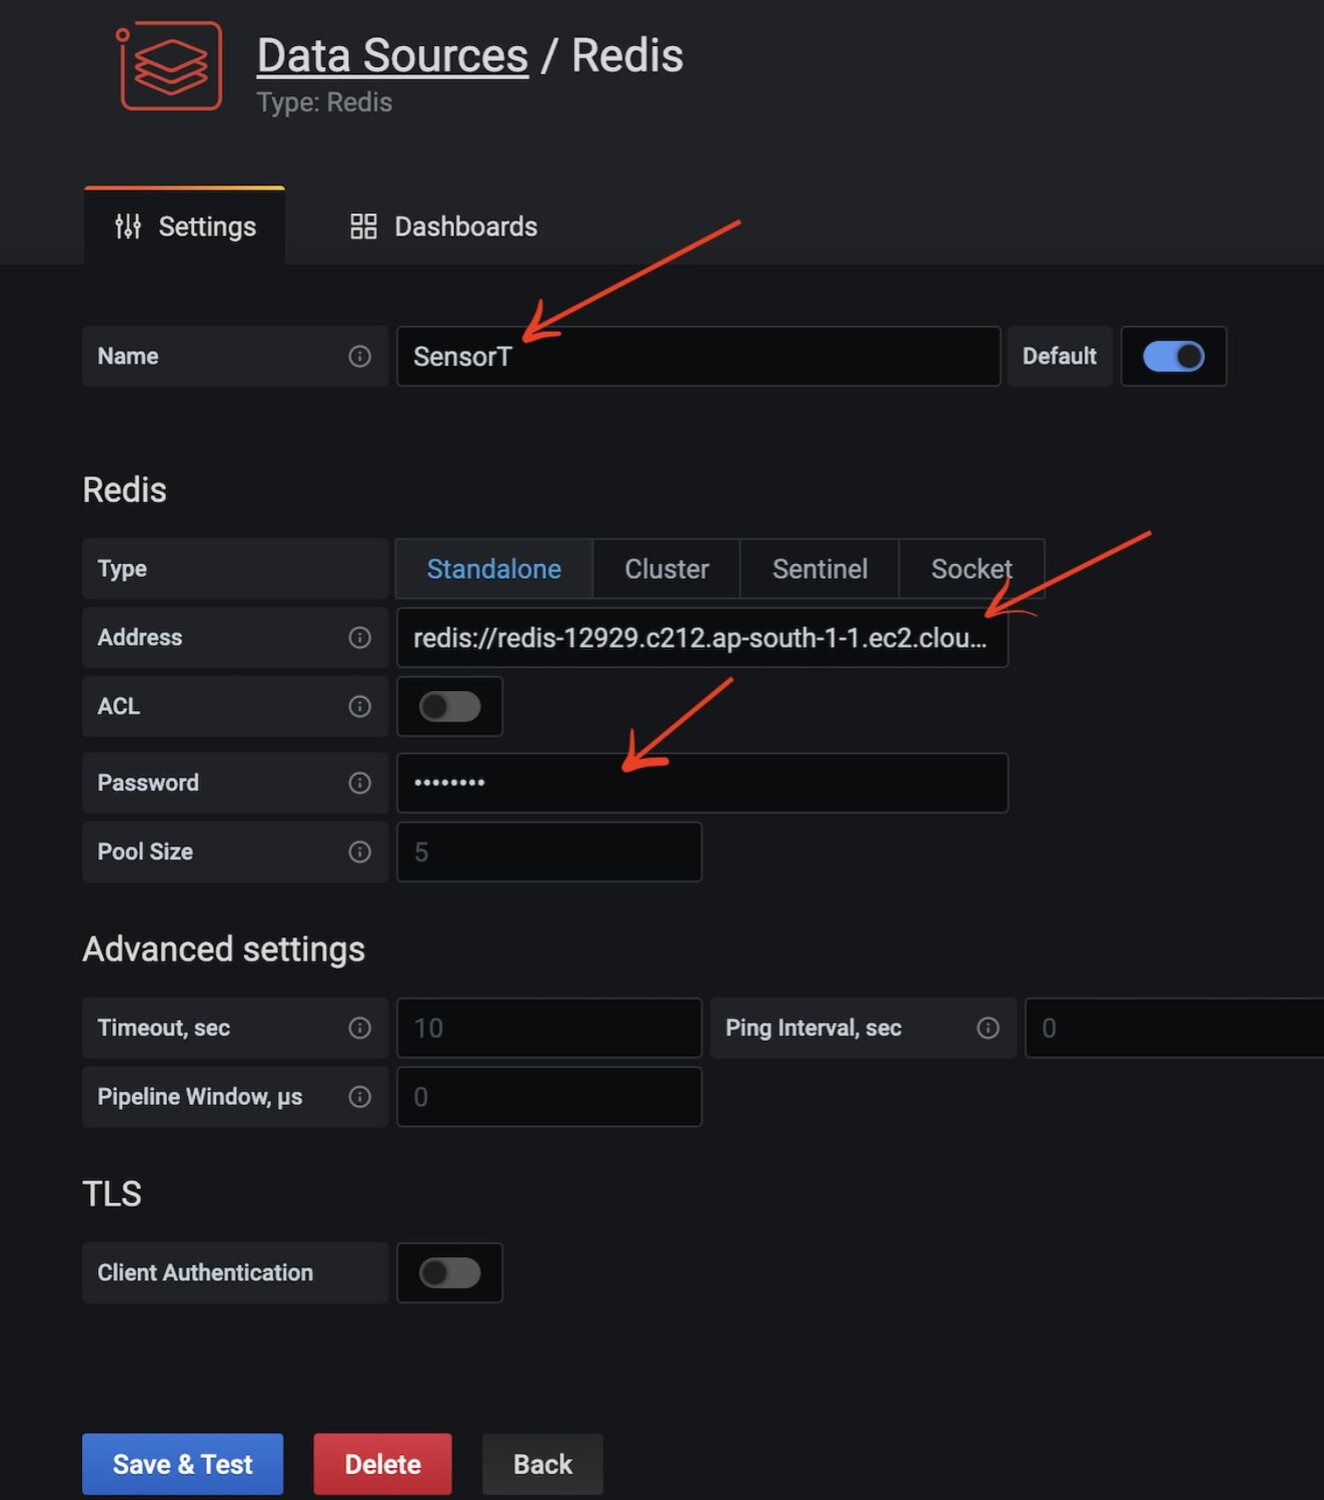
#Step 8. How do you configure the Redis connection?
Add the Redis database name, endpoint URL, and password. This assumes you already have a Redis server and database up and running in your infrastructure. You can also use Redis Cloud as shown in the example below.

#Step 9. Import the predefined Redis dashboard
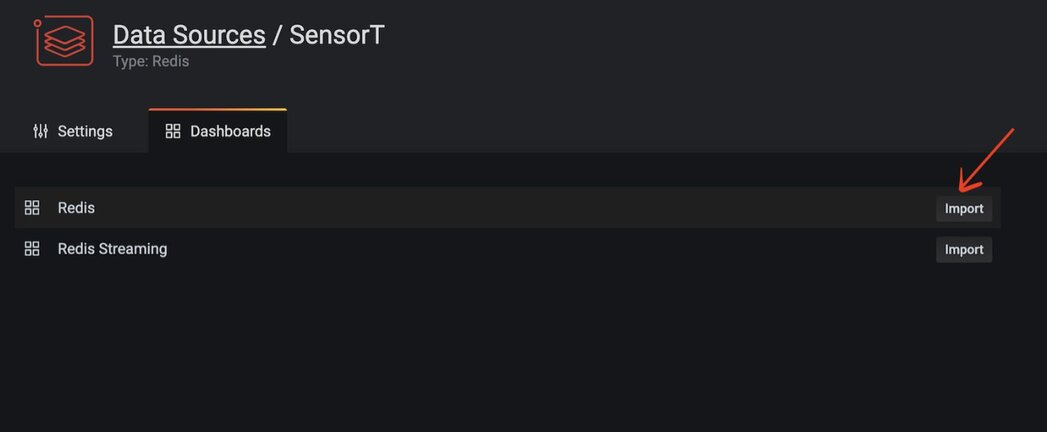
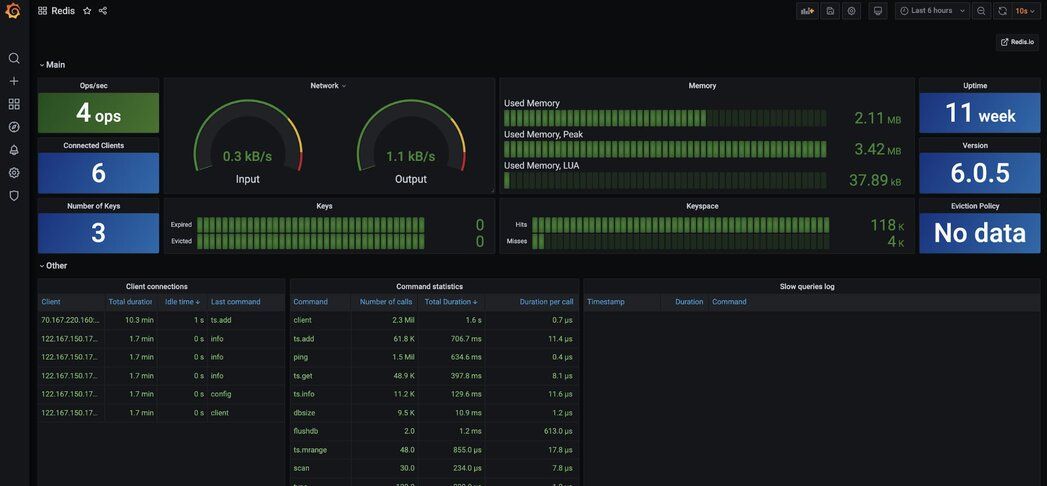
#Step 10. View the Redis datasource dashboard
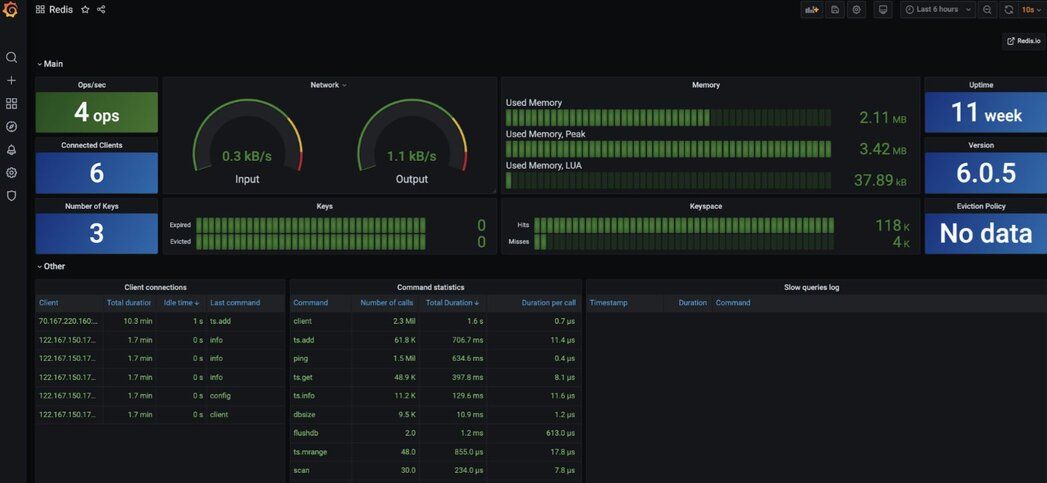
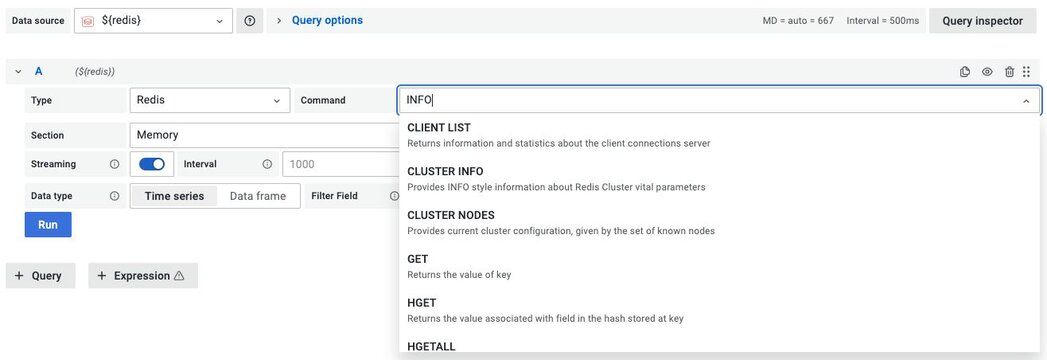
#What Redis commands does the Grafana datasource support?
Data Source supports various Redis commands using custom components and provides a unified interface to query any command.
#Further references for Homebrew
- Introducing the Redis Data Source Plug-in for Grafana
- How to Use the New Redis Data Source for Grafana Plug-in
- 3 Real-Life Apps Built with Redis Data Source for Grafana
- How to Manage Real-Time IoT Sensor Data in Redis
- Real-time observability with Redis and Grafana
#How do you set up the Redis Grafana datasource with Docker?
You can install and run Grafana using the official Docker image.
#Step 1. Install Docker
The first step is to install Docker for your operating system. Run the
docker version command in a terminal window to make sure that Docker is installed correctly.NOTEOn Windows and Mac, install Docker version 18.03 or higher. You can run docker version to find out your Docker version.
#Step 2. How do you run Grafana with the Redis datasource in Docker?
Specify the plugins you want installed to Docker as a comma-separated list in the
GF_INSTALL_PLUGINS environment. This sends each plugin name to grafana-cli plugins install ${plugin} and installs them when Grafana starts. In our case, we will be using redis-datasource.#Step 3. Access the Grafana dashboard
Open
https://IP:3000 to access Grafana. The default username/password is admin/admin.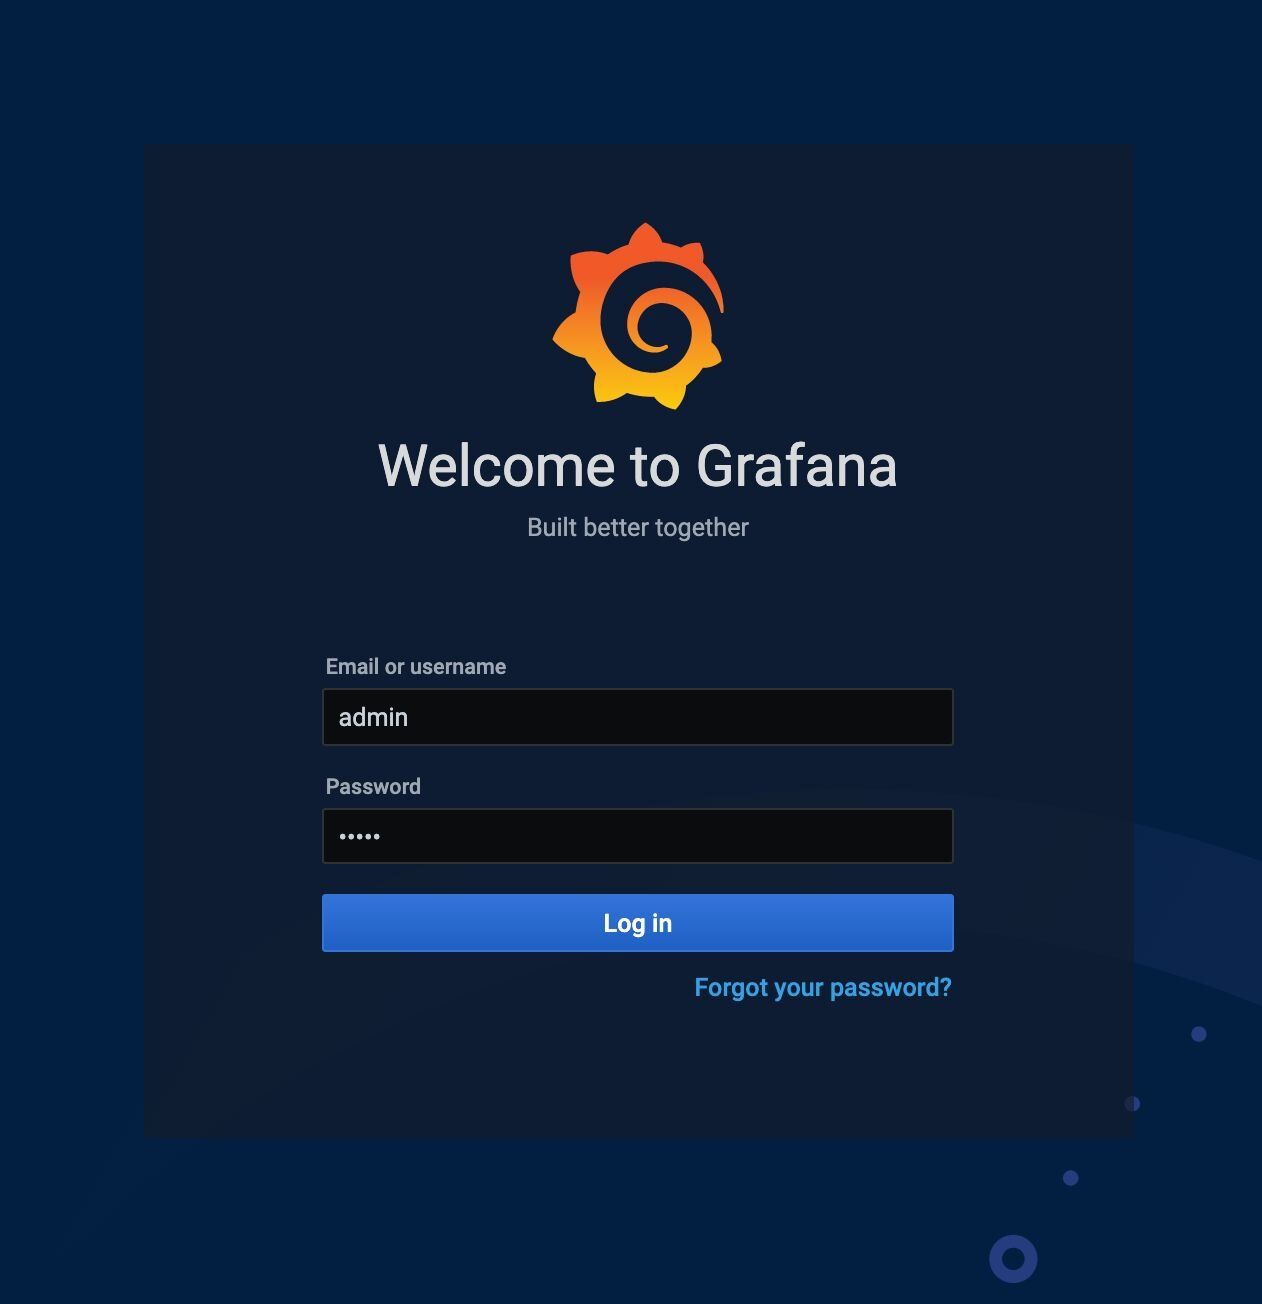
#Step 4. Open the Configuration menu
#Step 5. Add Redis as a data source

#Step 6. Select "Redis" as the data source type
#Step 7. How do you configure the Redis connection in Docker?
Add the Redis database name, endpoint URL, and password. This assumes you already have a Redis server up and running in your infrastructure. You can also use Redis Cloud as demonstrated below.
#Step 8. Import the predefined Redis dashboard

#Step 9. View the Redis datasource dashboard

#What Redis commands does the Docker datasource support?
Data Source supports various Redis commands using custom components and provides a unified interface to query any command.

#Further references for Docker
- Introducing the Redis Data Source plug-in for Grafana
- How to use the New Redis Data Source for Grafana plug-in
- 3 real-life apps built with Redis Data Source for Grafana
- How to manage real-time IoT Sensor Data in Redis
- Real-time observability with Redis and Grafana
#How do you set up the Redis Grafana datasource with Docker Compose?
Assuming that Docker Compose is already installed on your system, follow these steps:
#Step 1. Clone the repository
#Step 2. Start the services with Docker Compose
The project provides a
docker-compose.yml file that starts Redis with all modules and Grafana.#Step 3. Access the Grafana dashboard
#Step 4. Open the Configuration menu
#Step 5. Add Redis as a data source
#Step 6. Select "Redis" as the data source type
#Step 7. How do you configure the Redis connection in Docker Compose?
Add the Redis database name, endpoint URL, and password. This assumes you already have a Redis server up and running in your infrastructure. You can also use Redis Cloud as shown below:
#Step 8. Import the predefined Redis dashboard
#Step 9. View the Redis datasource dashboard
#What Redis commands does the Docker Compose datasource support?
Data Source supports various Redis commands using custom components and provides a unified interface to query any command.
#Further references for Docker Compose
- Introducing the Redis Data Source Plug-in for Grafana
- How to Use the New Redis Data Source for Grafana Plug-in
- 3 Real-Life Apps Built with Redis Data Source for Grafana
- How to Manage Real-Time IoT Sensor Data in Redis
- Real-time observability with Redis and Grafana
#Next steps
- Monitor Redis Software with Prometheus and Grafana - Set up full-stack Redis observability using Prometheus as a metrics collector alongside Grafana dashboards.
- Monitor Redis with Datadog - Integrate Redis monitoring into Datadog to track latency, memory usage, and cache hit rate.
- Redis Time Series documentation - Learn more about the time series data type that the Grafana Redis datasource can query.