Consolidated health report
View the consolidated health report to get a read-only snapshot of a Redis Software cluster's current system health.
| Redis Software |
|---|
The consolidated health report is a read-only, consolidated snapshot of a cluster's current system health, including:
-
License and certificate status
-
Nodes and services health
-
Node memory breakdown, including free and provisioned memory
-
Running actions status
-
Active alerts
-
Basic database status and version
-
High availability health
The consolidated health report consolidates cluster and database health information that was previously scattered across multiple APIs and CLI commands, such as rladmin status extra all and required SSH access to view.
As of Redis Software version 8.0.16, you can access the cluster and database health reports using the Cluster manager UI or REST API requests.
View health overview
You can access the cluster and database health reports using the Overview screen in the Cluster Manager UI.
You can view node health
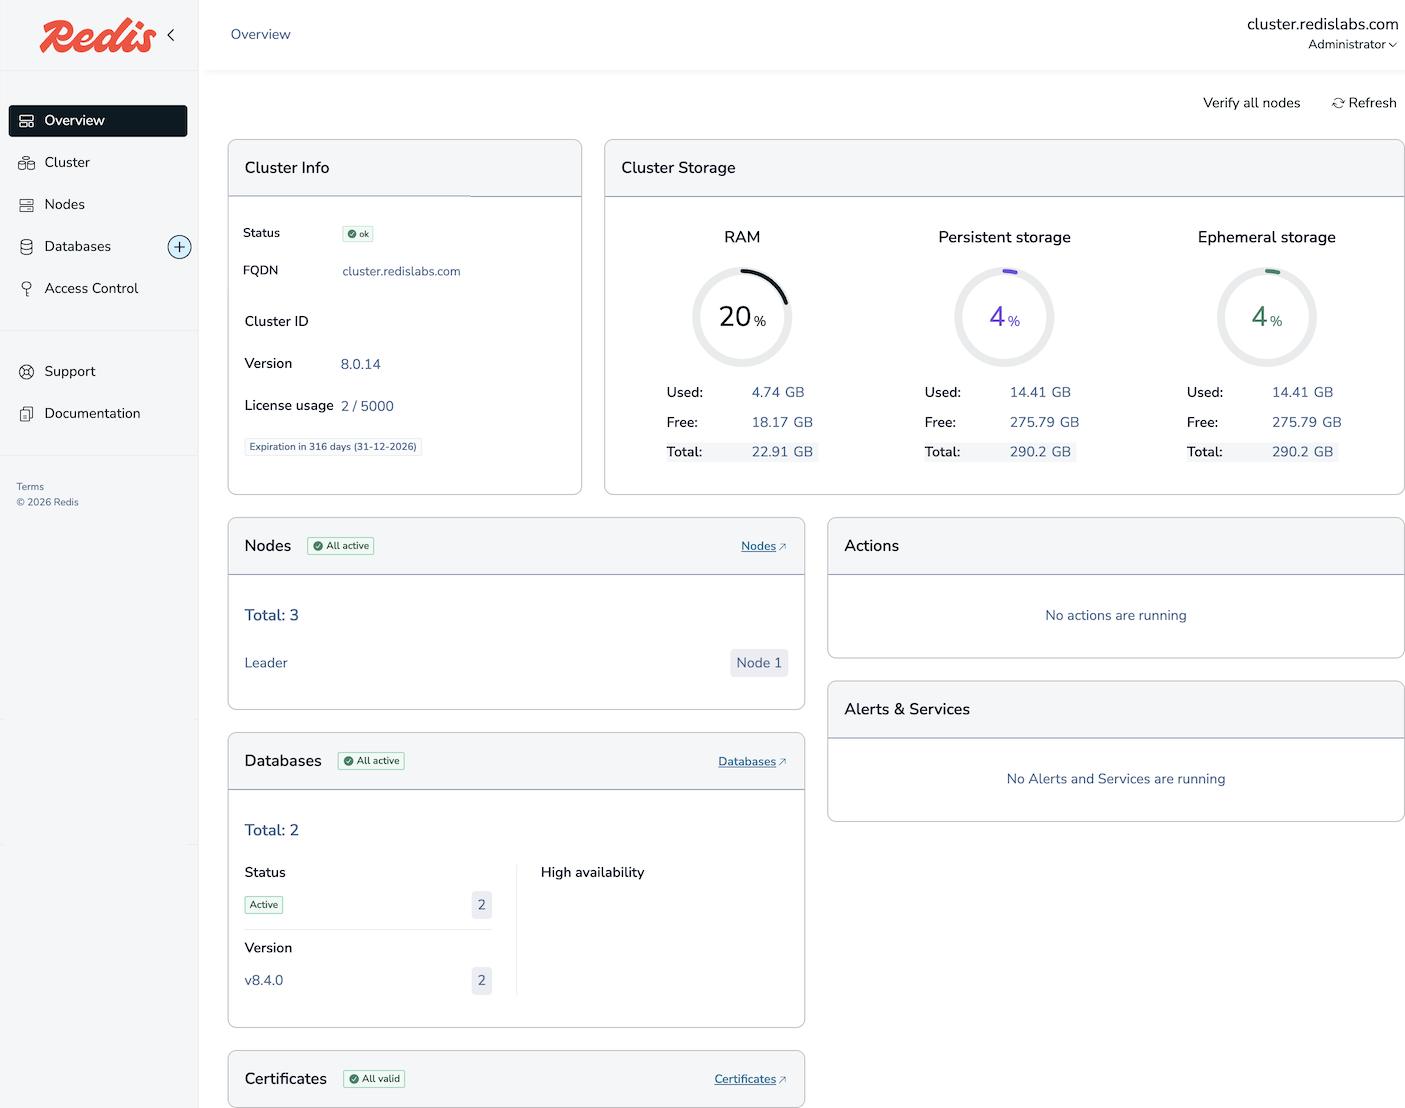
Cluster info
The Cluster Info section provides basic cluster details, including:
-
Overall cluster status
-
Redis Software cluster version
-
License usage and expiration date
Cluster storage
The Cluster Storage section provides memory usage details, including used memory, free memory, and total memory for RAM, flash, persistent storage, and ephemeral storage on the cluster.
Nodes
The Nodes section shows the status of nodes in the cluster and indicates which node is the leader or primary node.
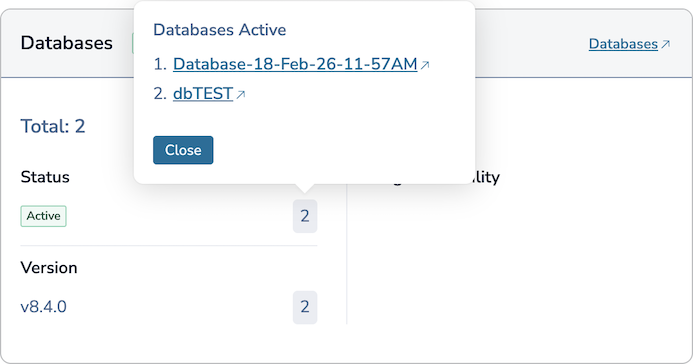
Databases
In the Databases section, you can check each database's status and Redis version. You can click the number listed by each field to display the relevant database names and click on the database links to view database details.
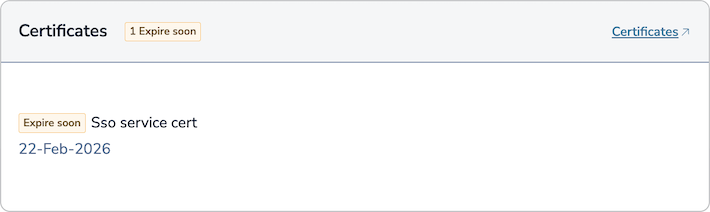
Certificates
The Certificates section shows whether the cluster's certificates are still valid. If a certificate appears as no longer valid, you can click the Certificates link to update the certificate.
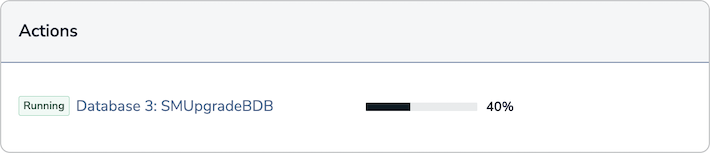
Actions
In the Actions section, you can view currently running actions.
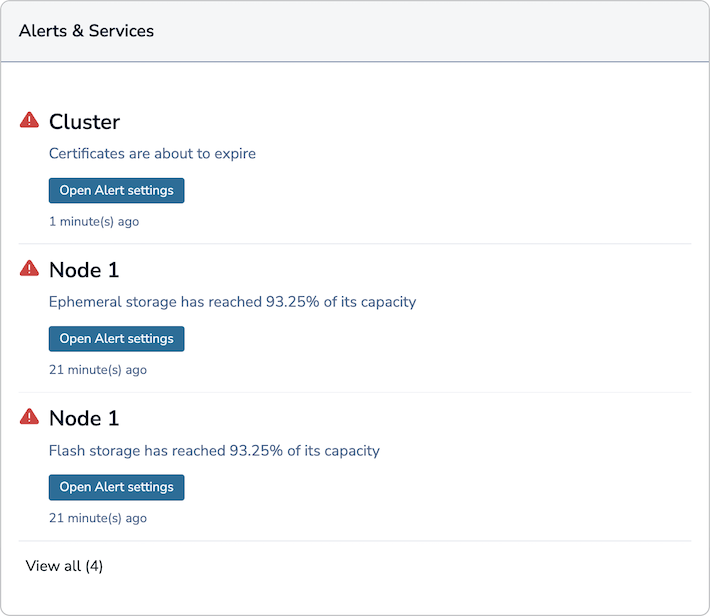
Alerts and services
If a configured alert threshold is reached or a running service stops, an alert will appear in the Alerts & Services section.
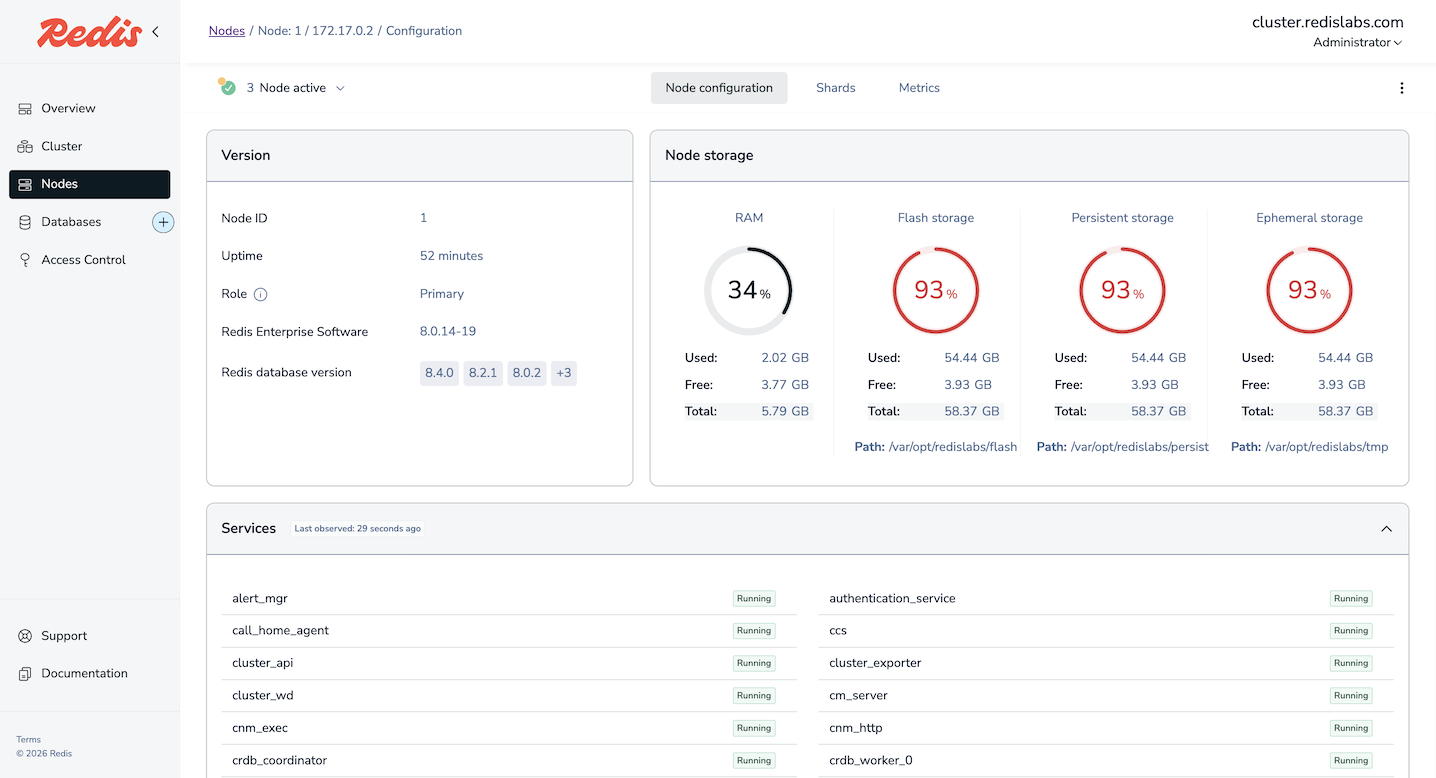
View node health
On the Nodes screen of the Cluster Manager UI, you can click on a node to go to its Node configuration tab and view node health details.
Verify nodes
You can check if nodes are functioning properly using one of the following methods:

Node storage
The Node storage section of the Node configuration tab provides memory usage details, including used memory, free memory, and total memory for RAM, flash, persistent storage, and ephemeral storage on the node.
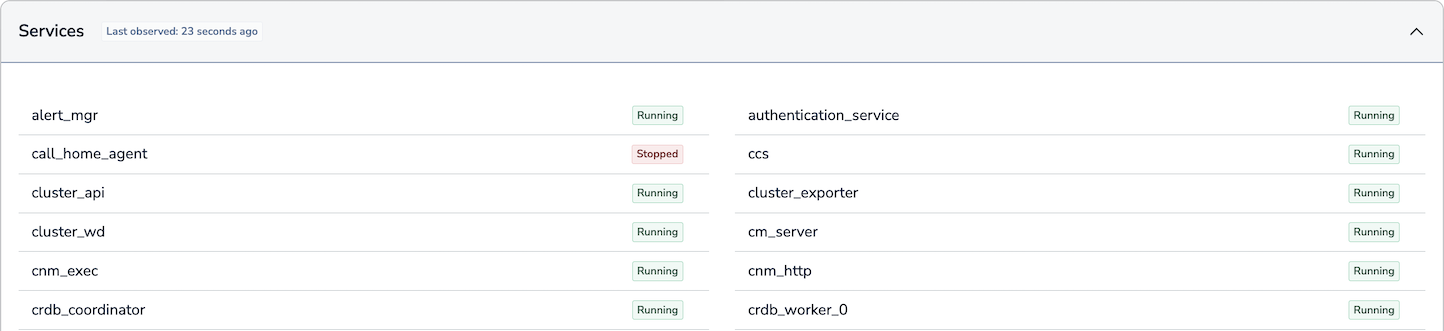
Services
In the Services section Node configuration tab, you can view the list of services running on the node and the most recent status of each.
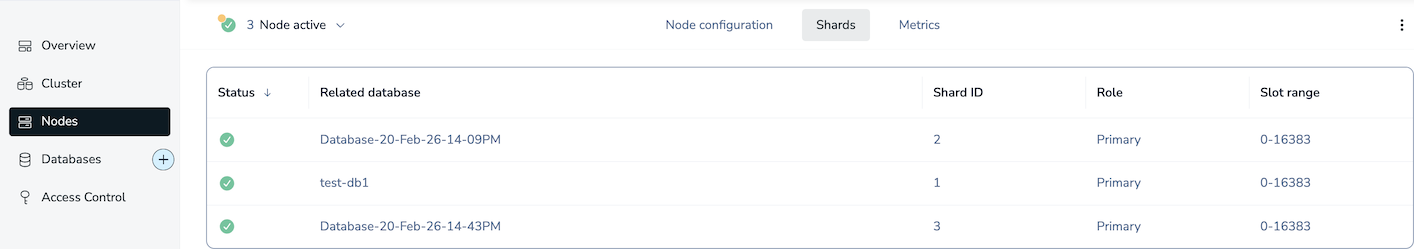
Shards
When viewing a node's configuration, you can click the Shards tab to view a list of database shards running on the node and related details such as each shard's ID, current status, role, and slot range.
Health report REST API requests
Cluster health report requests
Cluster health report REST API requests provide overall health information for a cluster:
GET https://<host>:<port>/v4/cluster/health
Database health report requests
Database health report REST API requests provide detailed health information for a specific database:
GET https://<host>:<port>/v4/bdb/<database_id>/health