Tutorial
Redis Observability: Monitoring, Metrics, and Troubleshooting
February 26, 202617 minute read
TL;DR:Monitor Redis in production using the built-inINFOcommand for real-time metrics (memory, clients, throughput),SLOWLOGto catch slow queries, the latency monitoring framework for spike detection, and external tools like Datadog or Prometheus with Grafana for dashboards and alerting.
#Course Structure
This tutorial is part of the Running Redis at Scale course. You can jump to any section:
- Introduction to Running Redis at Scale
- Talking to Redis - CLI, clients, and tuning
- Persistence and Durability - RDB and AOF
- High Availability - Replication and Sentinel
- Scalability - Redis Cluster
- Observability ← You are here
- Course Conclusion
#What you'll learn
- How to use the Redis
INFOcommand to inspect server, memory, replication, and keyspace metrics - How to measure latency with
redis-clioptions like--latency,--latency-history, and--latency-dist - How to configure and query the Redis Slow Log to find expensive commands
- How to enable the latency monitoring framework and interpret its output
- How to identify problematic keys with
--bigkeys,--memkeys, and--hotkeys - How to set up Redis log files and forward them to a remote logging server
- How to connect Redis metrics to external monitoring tools for production dashboards
The last thing you want to do after successfully deploying and scaling Redis is to be stuck working on the weekend because performance is down or the service is unavailable!
If you're running a managed service like Redis Cloud, you won't have to worry about these questions as much. But even then, it's still worthwhile to know about certain key Redis metrics.
Some of the questions you always want to be able to answer include:
- Is Redis up and running right now?
- Where is my Redis capacity at?
- Is Redis accessible at this moment?
- Is Redis performing the way we expect?
- When failures occur… what exactly happened to Redis?
Then of course you must ask...
- How can I find this out ahead of time?
Let's dig into these questions and more as we look into observability with Redis.
#What metrics does Redis expose for monitoring?
There are several Redis metrics that can be viewed through
redis-cli.#How do I use the Redis INFO command?
Running the
INFO command provides many of the metrics available in a single view.There are several sections that can be pulled individually. For example, if you wanted to just get the CLIENTS section you can pass that section as an argument to the
INFO command.#INFO Sections
#Server**: the current Redis server inf
Metrics of note:
redis_versionprocess_idconfig_fileuptime_in_secondsuptime_in_days
#Clients**: available data on clients connected or failed connection
Metrics of note:
connected_clientsblocked_clients
#Memory**: memory usage and sta
Metrics of note:
used_memorymem_fragmentation_ratio
#Persistence**: RDB or AOF metri
Metrics of note:
rdb_last_save_timerdb_changes_since_last_saveaof_rewrite_in_progress
#Stats**: some general statisti
Metrics of note:
keyspace_hitskeyspace_missesexpired_keysevicted_keysinstantaneous_ops_per_sec
#Replication**: replication data including primary/replica identifiers and offse
Metrics of note:
master_link_down_sinceconnected_slavesmaster_last_io_seconds_ago
#CPU**: compute consumption sta
Metrics of note:
used_cpu_sysused_cpu_user
#Modules**: data from any loaded modul
Metrics of note (per module):
veroptions
#Cluster**: whether cluster is enabl
Metric of note:
cluster_enabled
#Keyspace**: keys and expiration da
Metrics of note (per db):
keysexpiresavg_ttl
The output can be read from the results or piped into a file.
This could be done at intervals and consumed by a local or third party monitoring service.
Some of the data returned by
INFO are going to be static. For example the Redis version which won't change until an update is made. Other data is dynamic, for keyspace_hits ÷ keyspace_misses. The latter could be taken to compute a hit ratio and observed as a long term metric. The replication section field master_link_down_since could be a metric to connect an alert.Some examples of possible alerts that could be setup for a given metric:
| Metric | Example Alert |
|---|---|
uptime_in_seconds | < 300 seconds: to ensure the server is staying up |
connected_clients | < minimum number of expected application connections |
master_link_down_since | > 30 seconds: replication should be operational |
rdb_last_save_time | > maximum acceptable interval without taking a snapshot |
NOTEThis is not an exhaustive list, but just to give you an idea of how the metrics in INFO could be used.
#How do I measure Redis latency and stats from the command line?
The redis-cli client has some built-in options that allow you to pull some real-time latency and stats data.
NOTEThese are not available as commands from Redis but as options in redis-cli.
#Latency options
Continuously sample latency:
The
raw or csv output flag can be added:In order to sample for longer than one second you can use
latency-history which has a default interval of 15 seconds but can be specified using the -i param.This can also be combined with the
csv or raw output format flag.Both of these could be piped to a file as well.
The
latency-dist option shows latency as a spectrum. The default interval is one second but can be changed using the -i param.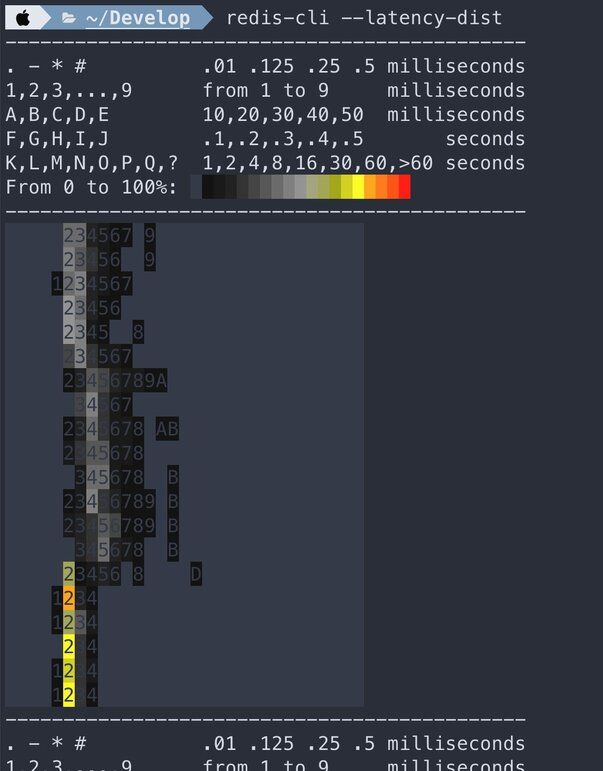
#Stats option
Get rolling stats from the server using the
stat flag.#How do I check Redis memory usage?
Redis includes a
MEMORY command that includes a subcommand to get stats.These values are available in the
INFO MEMORY command as well, but here they are returned in a typical Redis RESP Array reply.There is also a
LATENCY DOCTOR subcommand with an analysis report of the current memory metrics.#How do I enable Redis latency monitoring?
As we know Redis is fast and as a result is often used in very extreme scenarios where low latency is a must. Redis has a feature called Latency Monitoring which allows you to dig into possible latency issues. Latency monitoring is composed of the following conceptual parts:
- Latency hooks that sample different latency sensitive code paths.
- Time series recording of latency spikes split by different events.
- A reporting engine to fetch raw data from the time series.
- Analysis engine to provide human readable reports and hints according to the measurements.
By default this feature is disabled because most of the time it is not needed. In order to enable it you can update the threshold time in milliseconds that you want to monitor in your Redis configuration. Events that take longer than the threshold will be logged as latency spikes. The threshold configuration should be set accordingly if the requirement is to identify all events blocking the server for a time of 10 milliseconds or more.
If the debugging session is intended to be temporary the threshold can be set via redis-cli.
To disable the latency framework the threshold should be set back to 0.
The latency data can be viewed using the LATENCY command with it's subcommands:
LATENCY LATEST- latest samples for all eventsLATENCY HISTORY- latest time series for a given eventLATENCY RESET- resets the time series dataLATENCY GRAPH- renders an ASCII-art graphLATENCY DOCTOR- analysis report
| Event | Description |
|---|---|
command | regular commands |
fast-command | O(1) and O(log N) commands |
fork | the fork(2) system call |
aof-write | writing to the AOF |
aof-fsync-always | the fsync(2) system call when invoked by the appendfsync always policy |
expire-cycle | the expiration cycle |
eviction-cycle | the eviction cycle |
For example, you can use the
LATENCY LATEST subcommand and you may see some data like this:The results of this command provide the timestamp, latency and max latency for this event.
While the cost of enabling latency monitoring is near zero and memory requirements are very small it will raise your baseline memory usage so if you are getting the required performance out of Redis there is no need to leave this enabled.
#What tools can I use to monitor Redis in production?
There are many open source monitoring tools and services to visualize your Redis metrics - some of which also provide alerting capabilities.
One example of this is the Redis Data Source for Grafana. It is a Grafana plug-in that allows users to connect to the Redis database and build dashboards to easily observe Redis data. It provides an out-of-the-box predefined dashboard but also lets you build customized dashboards tuned to your specific needs.
For step-by-step setup guides, see:
- Redis Monitoring with Datadog — integrate Redis metrics into Datadog dashboards with alerting
- Redis Software Observability with Prometheus and Grafana — scrape Redis metrics with Prometheus and visualize them in Grafana
#Exercise: Working with Redis Metrics
Change into the
observability-stats directory.#Requirements
- docker
- docker compose
- internet connection
#Starting Environment
#Connect to the Environment
In a terminal run this command to get a shell prompt inside the running Docker container:
#Generate load
A simple way to to generate some load is to open another terminal and run:
#Explore INFO
Since most of the stats data comes from the INFO command you should first run this to view that there.
Try piping this output to a file.
#Memory usage
Since we generally recommend setting the
maxmemory size, it is possible to calculate the percentage of memory in use and alert based on results of the maxmemory configuration value and the used_memory stat.First set the
maxmemory.Then you can pull the two data points to see how that could be used to calculate memory usage.
#Client data
You can pull the
clients section of the INFO commandor maybe a particular metric you would want to track:
#Stats section
Use
redis-cli to list the full 'stats' section.#Hit ratio
A cache hit/miss ratio could be generated using two data points in the stats section.
#Evicted keys
Eviction occurs when Redis has reached its maximum memory and
maxmemory-policy in redis.conf is set to something other than volatile-lru.#Keyspace
The following data could be used for graphing the size of the keyspace as a quick drop or spike in the number of keys is a good indicator of issues.
#Workload (connections received, commands processed)
The following stats are a good indicator of workload on the Redis server.
#How do I troubleshoot Redis performance issues?
Besides the metrics from the data points from info, memory and the latency framework in the sections above, you may need to pull data from other sources when troubleshooting.
#How do I check if Redis is running?
The Redis server will respond to the PING command when running properly:
#How do I use the Redis Slow Log to find slow queries?
Redis Slow Log is a system to log queries that exceed a specific execution time which does not include I/O operations like client communication. It is enabled by default with two configuration parameters.
This indicates if there is an execution time longer than the time in microseconds, in this case one second, it will be logged. The slow log can be disabled using a value of -1. It can also be set to log every command with a value of 0.
This sets the length of the slow log. When a new command is logged the oldest one is removed from the queue.
These values can also be changed at runtime using the
CONFIG SET command.You can view the current length of the slow log using the
LEN subcommand:Entries can be pulled off of the slow log using the
GET subcommand.The slow log can be reset using the
RESET subcommand.#How do I find large or hot keys in Redis?
There are a few options that can be passed to redis-cli that will trigger a keyspace analysis. They use the
SCAN command so they should be safe to run without impacting operations.#Key Stats (--keystats):** This option will scan the dataset for keys based on memory size and lengt
#Big Keys (--bigkeys):** This option will scan the dataset for big keys and provide information about the
#Mem Keys (--memkeys):** Similarly to big keys, mem keys will look for the biggest keys but also report on the average size
#Hot Keys (--hotkeys):** The hot keys scan is only available when the maxmemory-policy is set to volatile-lfu or allkeys-lfu. If you need to identity hot keyyou can add this argument to redis-cli
#How do I watch live Redis commands with MONITOR?
The
MONITOR command allows you to see a stream of every command running against your Redis instance.CAUTIONSinceMONITORstreams back all commands, its use comes at a cost. It has been known to reduce performance by up to 50% so use with caution!
#How do I configure Redis logging?
The Redis log file is the other important log you need to be aware of. It contains useful information for troubleshooting configuration and deployment errors. If you don't configure Redis logging, troubleshooting will be significantly harder.
Redis has four logging levels, which you can configure directly in
redis.conf file.Log Levels:
WARNINGNOTICEVERBOSEDEBUG
Redis also supports sending the log files to a remote logging server through the use of syslog.
Remote logging is important to many security professionals. These remote logging servers are frequently used to monitor security events and manage incidents. These centralized log servers perform three common functions: ensure the integrity of your log files, ensure that logs are retained for a specific period of time, and to correlate logs against other system logs to discover potential attacks on your infrastructure.
Let's set up logging on our Redis deployment. First we'll open our
redis.conf file:The
redis.conf file has an entire section dedicated to logging.First, find the logfile directive in the
redis.conf file. This will allow you to define the logging directory. For this example lets use /var/log/redis/redis.log.If you'd like to use a remote logging server, then you'll need to uncomment the lines
syslog-enabled, syslog-ident and syslog-facility, and ensure that syslog-enabled is set to yes.Next, we'll restart the Redis server.
You should see the log events indicating that Redis is starting.
And next let's check that we are properly writing to syslog. You should see these same logs.
Finally, you'll need to send your logs to your remote logging server to ensure your logs will be backed up to this server. To do this, you'll also have to modify the rsyslog configuration. This configuration varies depending on your remote logging server provider.
#Next steps
Now that you understand Redis observability fundamentals, explore these resources to deepen your monitoring setup:
- Redis Monitoring with Datadog — set up Datadog integration to track Redis KPIs with dashboards and alerts
- Redis Software Observability with Prometheus and Grafana — collect metrics with Prometheus and build Grafana dashboards for Redis
- Course Conclusion → — wrap up the Running Redis at Scale course