RDI in Redis Insight
Connect to RDI from Redis Insight, configure pipelines, and more.
Redis Data Integration (RDI) and its ingest pipeline capability is an end-to-end solution for mirroring your application's primary database in Redis. RDI employs a capture data change mechanism and a stream processor to map and transform source data such as relational tables into fast Redis data structures that match your use cases. You can read more about RDI's ingest architecture on these pages.
As of version 2.54.0, Redis Insight includes RDI connectivity, which allows you to connect to RDI management planes, create, test, and deploy RDI pipelines, and view RDI statistics.
Connect
Open Redis Insight and then click on the Redis Data Integration tab, which looks like this:
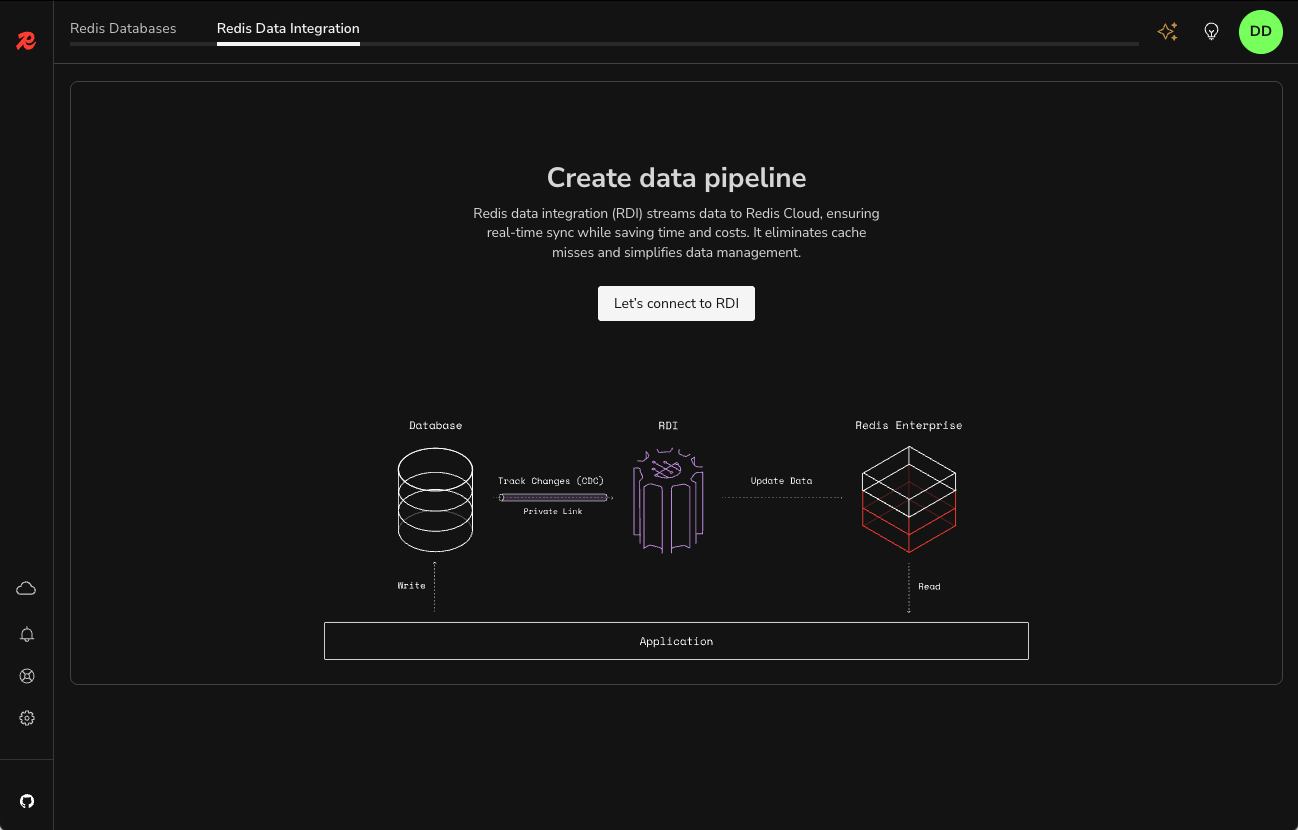
Next, click on Let's connect to RDI, which will open the Add RDI Endpoint dialog.
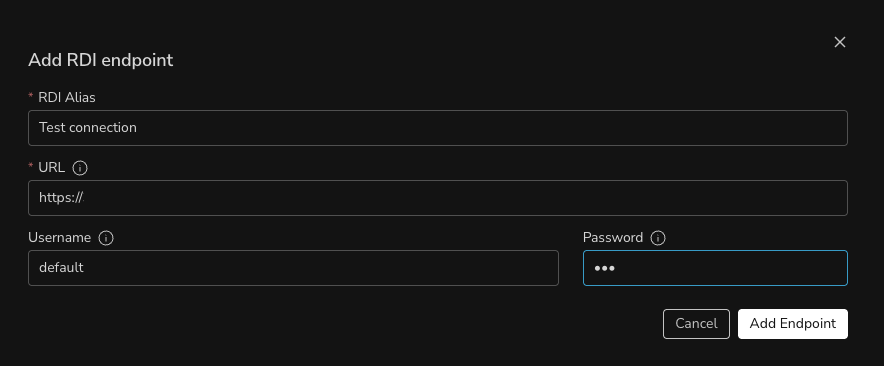
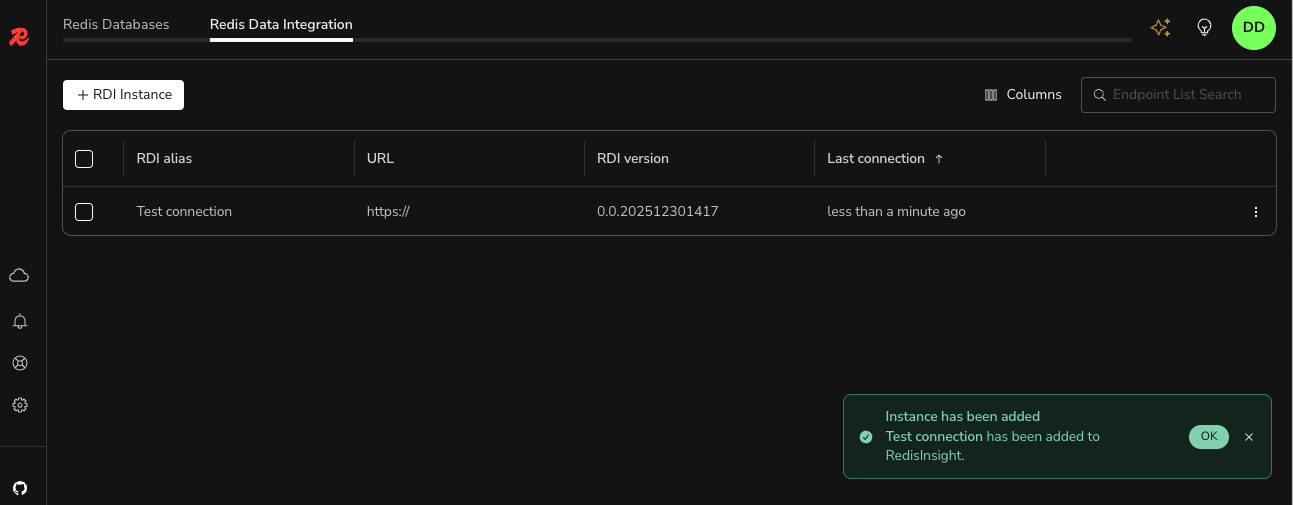
Enter your RDI server details into the dialog and then click Add Endpoint. The RDI Alias field can be any name you choose and it will be used as the primary name in the RDI Instances list view. The URL field string needs to begin with "https://", followed by the IP address or hostname of your RDI server. You'll receive notification if your connection is successful.
Create, test, and deploy RDI pipelines
Begin by clicking the alias of your newly configured RDI endpoint in the RDI Instances view (for example, Test connection in the above image), which will reveal the Pipeline Management view:
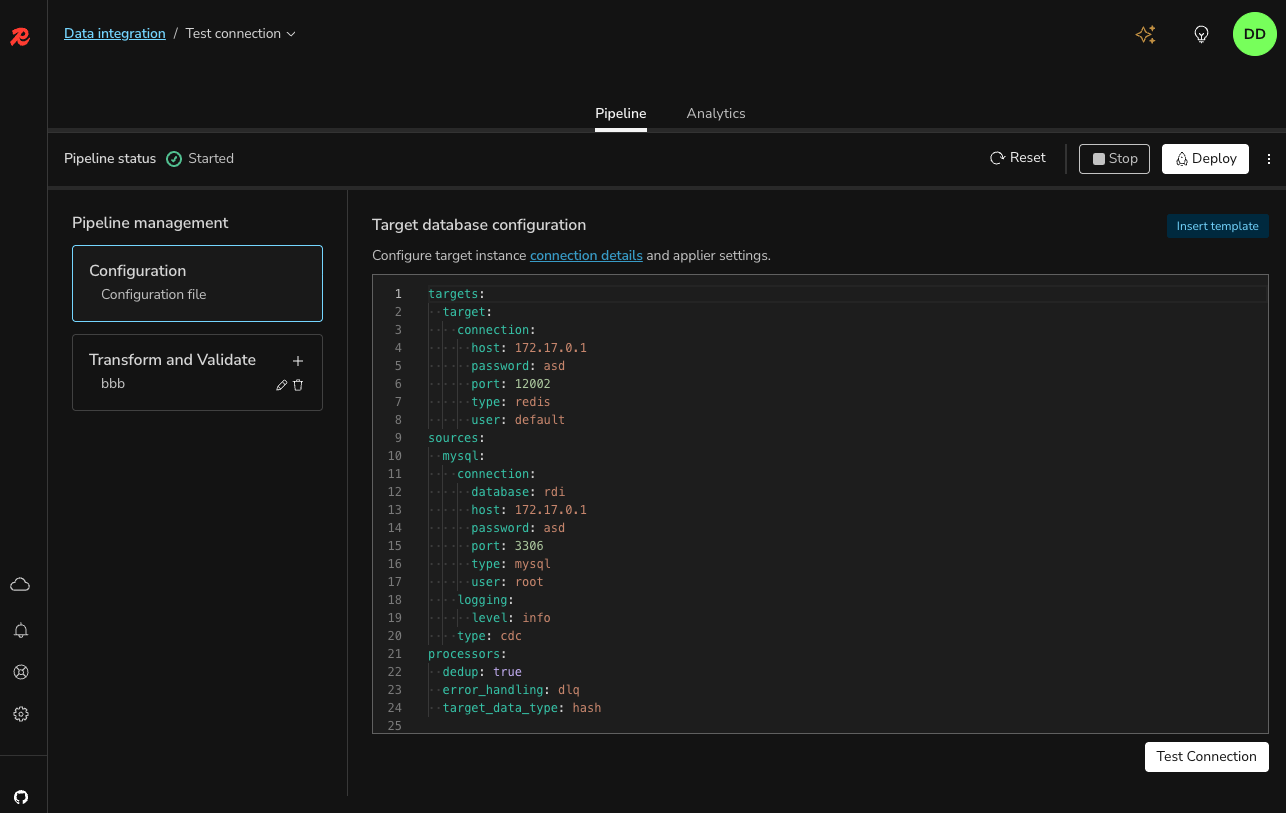
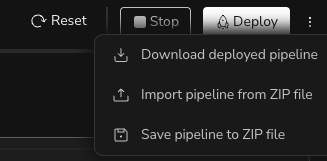
The vertical ellipses ("kebab") menu, which is adjacent to the Deploy button, contains the following options:
- Download deployed pipeline - Download an existing pipeline from your RDI configuration.
- Import pipeline from ZIP file - Upload YAML pipeline files from your local computer in ZIP format.
- Save pipeline to ZIP file - Save YAML pipeline files to your local computer in ZIP format.
Redis Insight will automatically download the RDI pipeline content from your server when the connection is opened for the first time.
Download a deployed pipeline from your RDI configuration
Select the Download deployed pipeline option from the kebab menu to download a previously defined pipeline from your RDI configuration. The downloaded pipeline will be displayed in the Pipeline management pane. As shown below, each pipeline consists of a configuration file (config.yaml) and zero or more job YAML files; both shown in the leftmost panel. The configuration file will be displayed in the rightmost editor panel.

Import a pipeline from your local machine
Select the Import pipeline from ZIP file option from the kebab menu to upload your configuration and job YAML files from your local computer. The files must be stored in a ZIP file that has the following structure.
.
├── config.yaml
└── jobs
    └── bbb.yaml
The config.yaml file, your configuration YAML file, is required. The jobs directory can be empty, as job pipelines are not required, but the empty directory must exist in the ZIP file. Otherwise, the jobs folder might contain one or more job YAML files.
Create a new configuration file using the built-in editor
If you wish to create a new pipeline from scratch, first delete any existing YAML code from the editor panel. If you're familiar with the structure of a configuration file, you can begin editing. If you're not familiar, you can insert a database template using the Insert template button menu, which has the following options:
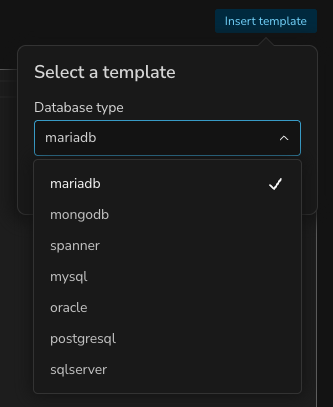
After you make your selections and click Apply, Redis Insight will populate the editor window with an appropriate template.
The Insert template menu is only available when the editor panel is empty.
See the RDI documentation for information about required fields.
Test your target database connection
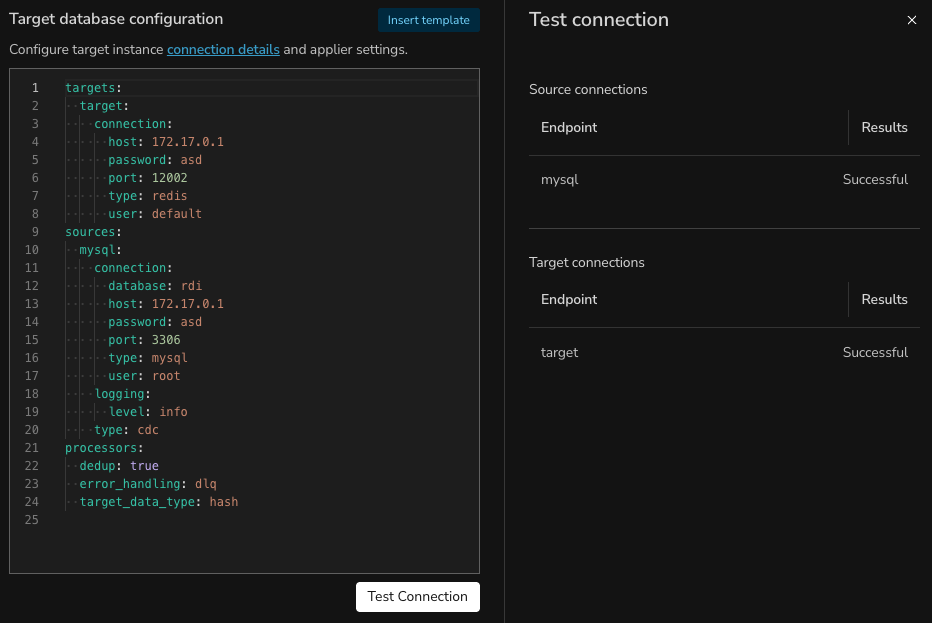
After you've created your Target database configuration, you can test the connection using the Test Connection button in the bottom right of the editor pane. A new panel will open to the right containing the test results.
Create a new transformation job file using the built-in editor
In the Pipeline Management pane, click the + next to the Transform and Validate folder label and enter a name for the new transformation job.
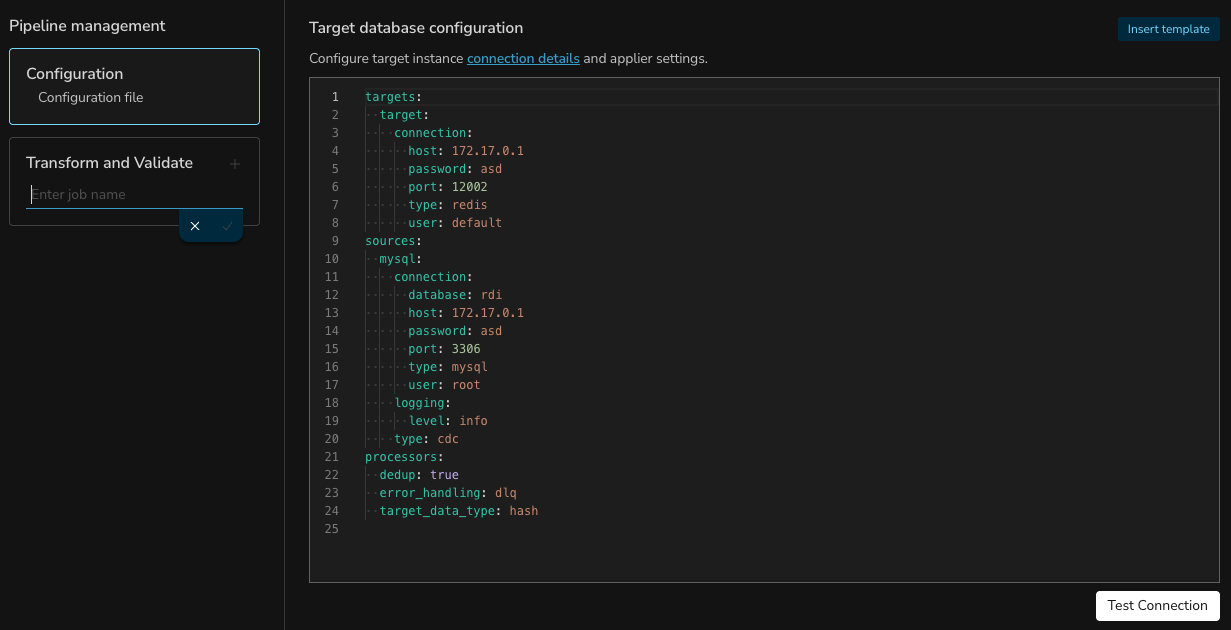
Next, click the job name you just created. You can either begin manually editing your transformation job or you can select Insert template, which will populate a sample, non-functional job template in the editor.
The RDI documentation has several examples of transformation jobs that can help get you started. Note: RDI uses a very specific YAML format for job files. See here for more information.
Use the built-in editors
The Redis Insight pipeline file editors are context-aware. They provide auto-completion, syntax highlighting, and error detection for:
- YAML files in the configuration and job file editors
- JMESPath and SQL function snippets in a dedicated editor. To open the JMESPath and SQL editor, click the SQL and JMESPathEditor button as shown below. A new editor panel will open in the lower half of the screen. At the bottom-left of that panel, you select either SQLite functions or JMESPath.
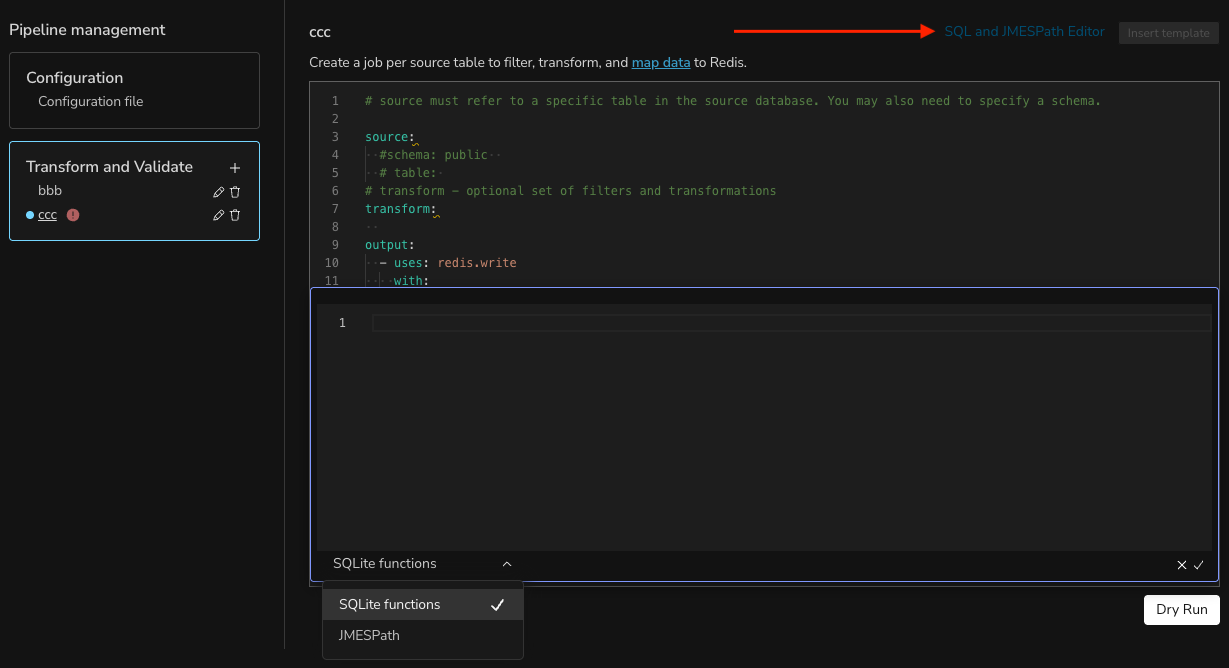
Here's a reference to the supported JMESPath extension functions and expressions that you can use in your job files.
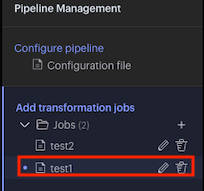
Dry run transformation job pipelines
After you've created a transformation job pipeline, you can execute a dry run on the RDI server. To do that, click on Dry Run in the lower right side of the editor panel. A new Test transformation logic panel will open to the side. There are two vertically-stacked panes: Input and a lower panel that has two tabs: Transformation output and Job output. In the Input section, enter JSON data that will trigger the transformation and then click Dry run. Any results will be displayed in the lower section.
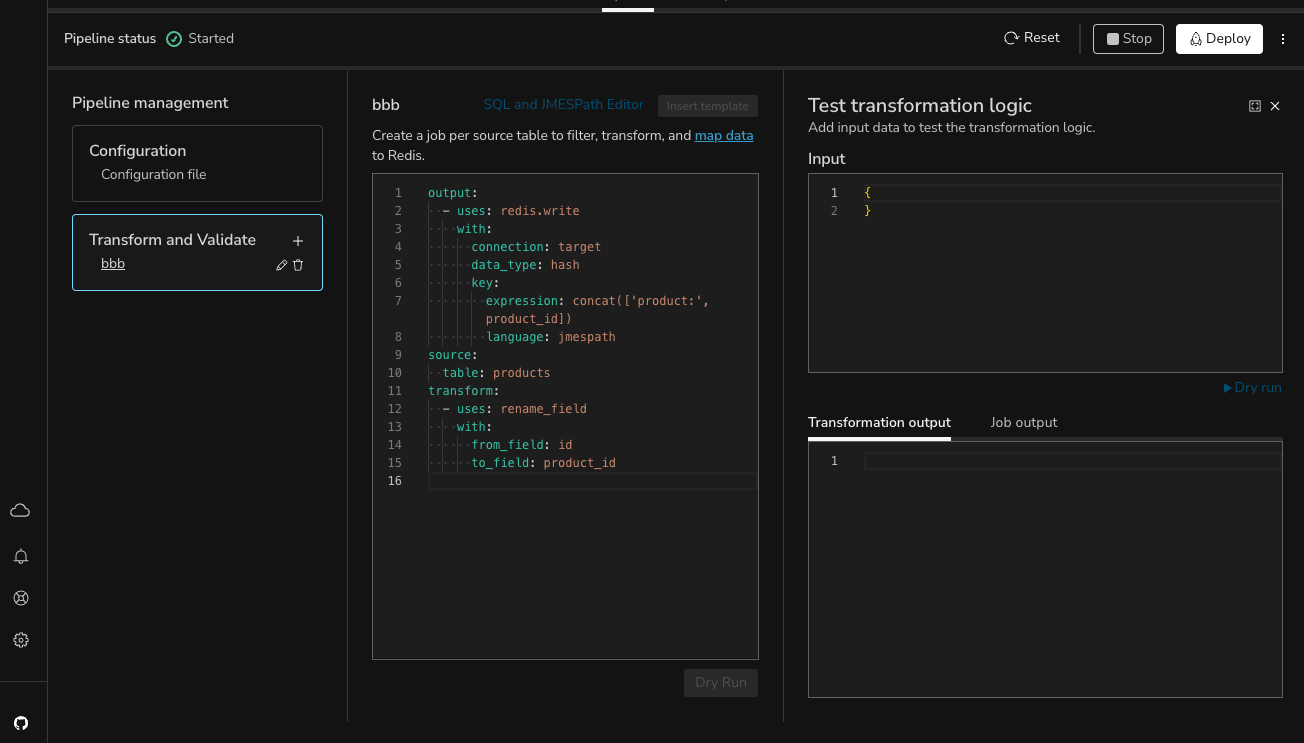
There are two tabs in the lower section:
- Transformation output - this is where you'll see JSON output from your dry run.
- Job output - this is where you'll see the Redis commands that would have been run in a real scenario.
Deploy pipelines and add target DB to Redis Insight
If you're satisfied with your configuration and transformation job pipelines, you can deploy them to the RDI management plane. Click the Deploy button to proceed.

After your pipelines have been deployed, you can add the RDI target Redis database defined in your config.yaml file to Redis Insight.
Doing so will allow you to monitor key creation from your RDI pipeline over time.
View RDI analytics
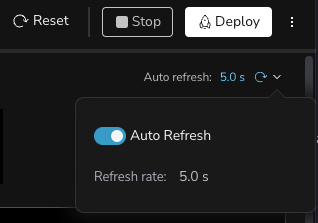
You can view various analytics (statistics) for your RDI deployment. To do so, click the Analytics tab button.
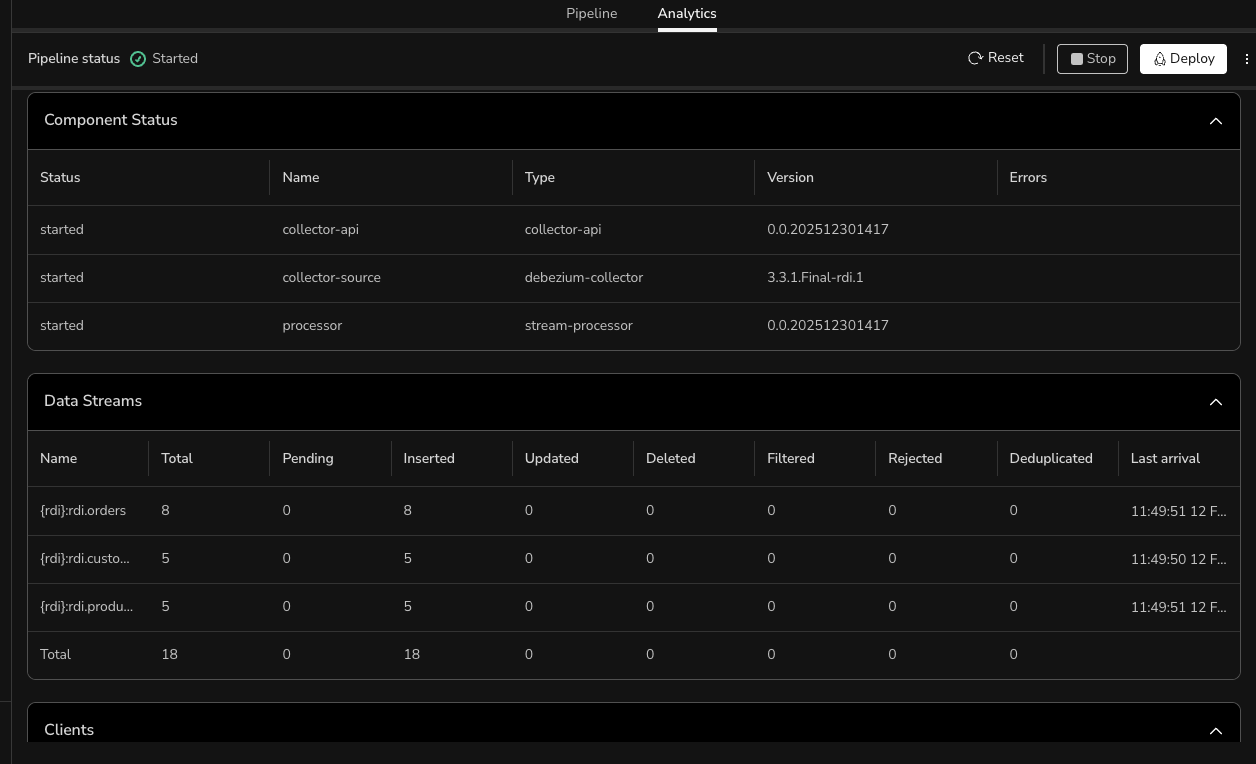
Analytics results are refreshed in an interval of your choosing. You can set the refresh interval by clicking on the arrow to the right of the Auto refresh control. You can either set the Refresh rate in seconds by clicking on the pencil control, or disable refresh altogether using the Auto Refresh slider control.
