Datadog with Redis Cloud
To collect, view, and monitor metrics data from your databases and other cluster components, you can connect Datadog to your Redis Cloud cluster using the Redis Datadog Integration.
Datadog is used by organizations of all sizes and across a wide range of industries to enable digital transformation and cloud migration, drive collaboration among development, operations, security and business teams, accelerate time to market for applications, reduce time to problem resolution, secure applications and infrastructure, understand user behavior, and track key business metrics.
The Datadog Integration for Redis Cloud uses the Datadog Integration API to connect to Redis metrics exporters. The integration is based on Datadog's OpenMetrics integration in their core API. This integration enables Redis Cloud users to export metrics directly to Datadog for analysis, and includes Redis-designed dashboards for use in monitoring Redis Cloud clusters.
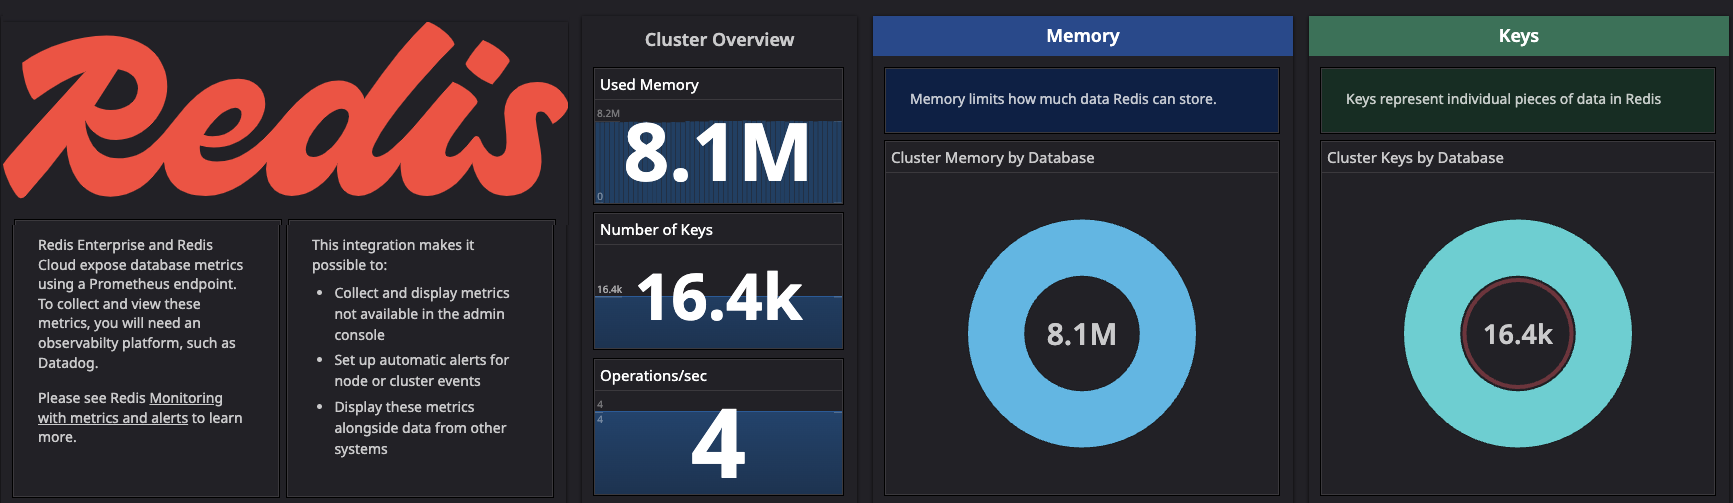
This integration makes it possible to:
- Collect and display metrics not available in the admin console
- Set up automatic alerts for node or cluster events
- Display these metrics alongside data from other systems
Install Redis' Datadog Integration for Redis Cloud
Installing the Datadog integration is a two-step process. Firstly, the installation must be part of your configuration. Select 'Integrations' from the menu in the Datadog portal and then enter 'Redis' in the search bar, then select 'Redis Cloud by Redis, Inc.'. Next click 'Install Integration' in the top-right corner of the overview page.
If you have not already created a VPC between the Redis Cloud cluster and the network in which the machine hosting the Datadog agent lives you should do so now. Please visit VPC Peering and follow the instructions for the cloud platform of your choice.
Returning to the Datadog console, open the 'Configure' tab of the integration and follow the instructions for installing the integration on the local machine. After it has been installed follow the instruction for adding an instance to the conf.yaml in /etc/datadog-agent/conf.d/redis_cloud.d.
After you have edited the conf.yaml file please restart the service and check its status:
sudo service datadog-agent restart
followed by:
sudo service datadog-agent status
to be certain that the service itself is running and did not encounter any problems. Next, check the output of the service; in the terminal on the Datadog agent host run the following command:
tail -f /var/log/datadog/agent.log
It will take several minutes for data to reach Datadog. Finally, check the Datadog console by selecting Infrastructure -> Host Map from the menu and then finding the host that is monitoring the Redis Cloud instance. The host should be present, and in its list of components there should be a section called 'rdsc', which is the namespace used by the Redis Cloud integration, although this can take several minutes to appear. It is also possible to verify the metrics by choosing Metrics -> Explorer from the menu and entering 'rdsc.bdb_up'.
View metrics
The Redis Cloud Integration for Datadog contains pre-defined dashboards to aid in monitoring your Redis Cloud deployment.
The following dashboards are currently available:
- Overview
- Database
- Network
A number of additional dashboards will be included in the next release (v1.1.0).
Monitor metrics
See Observability and monitoring guidance for monitoring details.