Monitoring guide
Monitor Write-behind engine and data processing jobs
Write-behind accumulates operating statistics that you can:
- Observe and analyze to discover various types of problems.
- Use for optimization purposes.
Console metrics
Write-behind can display its operating metrics in the console using the
redis-di status
command. The command provides information about the current Write-behind engine status, target database configuration, and processing statistics broken down by stream. This tool is intended to be used by Operator to get the current snapshot of the system as well as monitoring ongoing data processing (when used in live mode).
Prometheus integration
Write-behind allows collecting and exporting its metrics to Prometheus and visualizing them in Grafana. Operator can start the built-in exporter using the
redis-di monitor
command. The diagram describes this flow and the components involved:
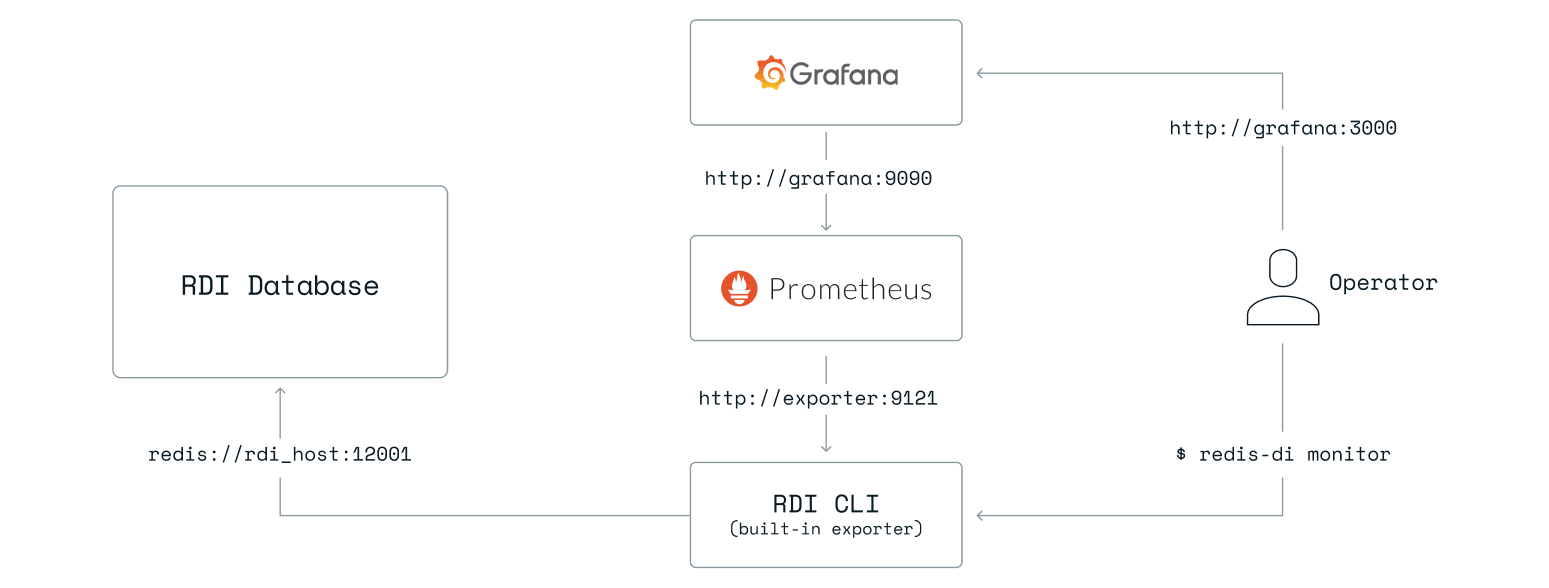
Note: The host names and ports above are examples only and can be changed as needed.
Test Write-behind metrics exporter
Start the Write-behind metrics exporter using the command below:
redis-di monitor
Note: The default port for the exporter is
9121. If you need to change it, use the--exporter-portoption. The default metrics collection interval is 5 seconds. If you need to change it, use the--collect-intervaloption.
Then navigate to http://localhost:9121/ to see the exported metrics. You should be able to see the following metric:
rdi_engine_state{state="RUNNING",sync_mode="UNKNOWN"} 1.0
Note: The actual value of the metric above can be 0 if you haven't started Write-behind engine yet (in which case, the
statelabel should indicate that as well). You must have the Write-behind database created and configured before observing any metrics. If you are not seeing it or getting an error value instead, this indicates that the Write-behind database is not properly configured.
Configure Prometheus
Next, configure the Prometheus scraper. Edit the prometheus.yml file to add the following scraper config:
scrape_configs:
  # scrape Write-behind metrics exporter
  - job_name: rdi-exporter
    static_configs:
      - targets: ["redis-exporter:9121"]
Notes:
- Make sure the
targetsvalue above points to the host and port you configured to run the Write-behind metrics exporter. - The
scrape_intervalsetting in Prometheus should be the same or higher than thecollect_intervalsetting for the exporter. For example, if thecollect_intervalis set to 5 seconds, thescrape_intervalshould also be set to 5 seconds or more. If thescrape_intervalis set to less than thecollect_interval, Prometheus will scrape the exporter before it has a chance to collect and refresh metrics, and you will see duplicated values in Prometheus.
Test the Prometheus scraper
After the scraper config is added to the Prometheus configuration, you should now be able to navigate to http://<HOSTNAME>:9090/graph (replace <HOSTNAME> with a valid Prometheus hostname or IP address).
Explore Write-behind metrics using the expression browser.
In the expression box, type in a metric name (for example, rdi_engine_state) and select Enter or the Execute button to see the following result:
rdi_engine_state{instance="redis-exporter:9121", job="rdi-exporter", status="RUNNING", sync_mode="UNKNOWN"} 1
Note: You may see more than just one Write-behind metric if Write-behind engine has already processed some data. If you do not see any metrics, check your scraper job configuration in Prometheus.
Use Grafana to analyze metrics
Optionally, you may deploy the sample Grafana dashboard to monitor the status of Write-behind engine and its individual jobs. Follow these steps to import the dashboard:
-
Download the dashboard file to your local machine.
-
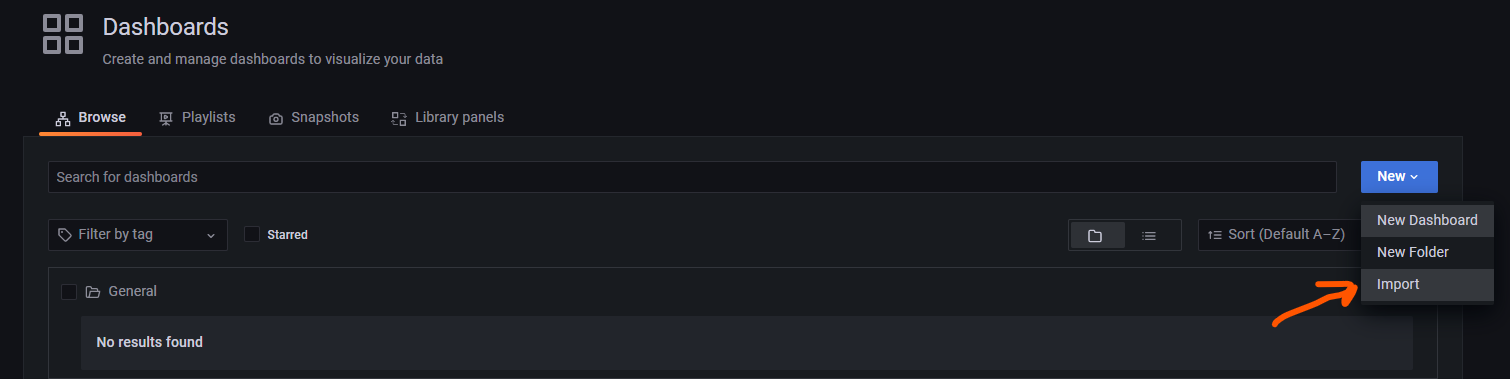
Log into Grafana and navigate to the list of dashboards, then choose New > Import:
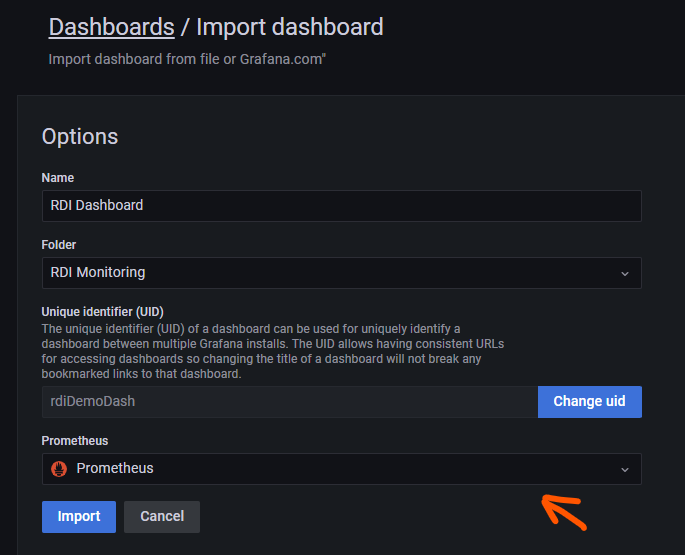
- On the next screen, select Upload JSON file and upload the file you downloaded in step 1. Make sure you select the data source that is connected to the Write-behind metrics exporter:
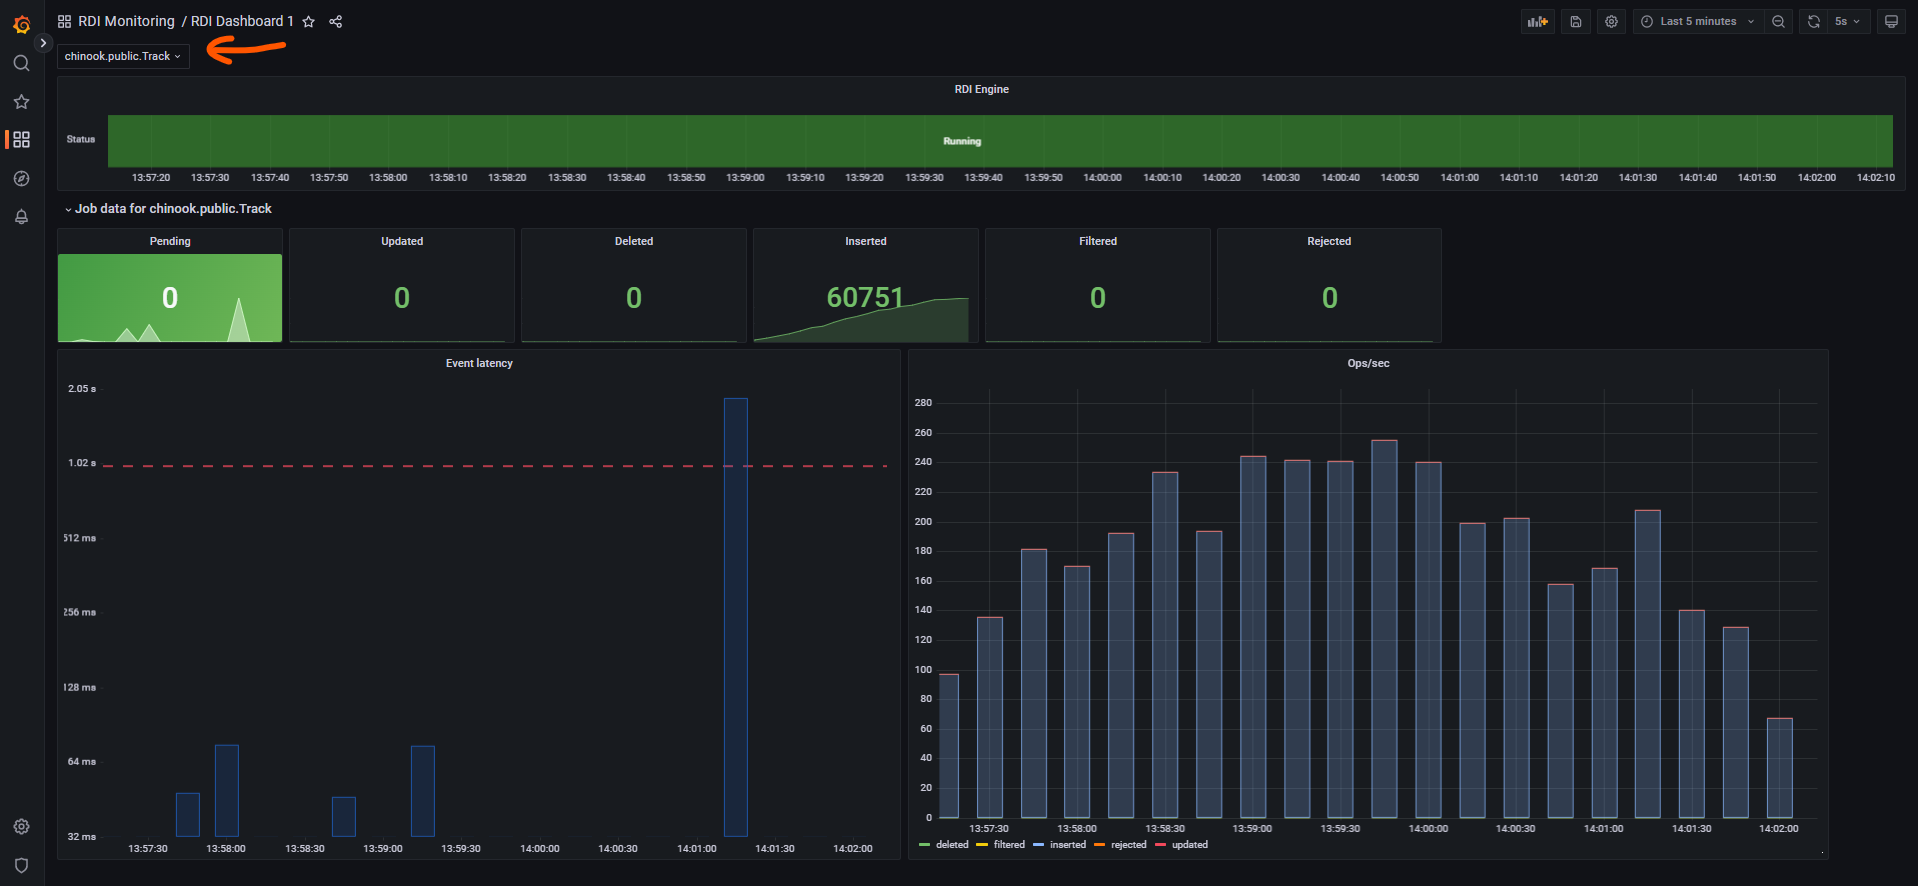
- Select Import and make sure you choose the jobs to monitor from the drop-down list (this will be empty if you don't have any jobs running yet):
Write-behind metrics
This list shows exported Write-behind metrics along with their descriptions:
| Metric Name | Labels | Values | Description |
|---|---|---|---|
| rdi_engine_state | {status=RUNNING | STOPPED, sync_mode=SNAPSHOT | STREAMING | UNKNOWN} | 0, 1 | Status of Write-behind engine. 0 - Write-behind engine is stopped, 1 - Write-behind engine is running. Sync mode label indicates the last reported ingest synchronization mode. |
| rdi_incoming_entries | {data_source=<stream name>, operation=pending | inserted | updated | deleted | filtered | rejected} |
<count of records> |
Counters, indicating the number of operations performed for each stream. |
| rdi_stream_event_latency_ms | {data_source=<stream name>} |
0 - ∞ | Latency calculated for each stream. Indicates the time in milliseconds the first available record has spent in the stream waiting to be processed by Write-behind engine. If no records pending it will always return zero. |