Real-time metrics
Documents the metrics that are tracked with Redis Software.
| Redis Software | Redis Cloud |
|---|
Cluster manager metrics
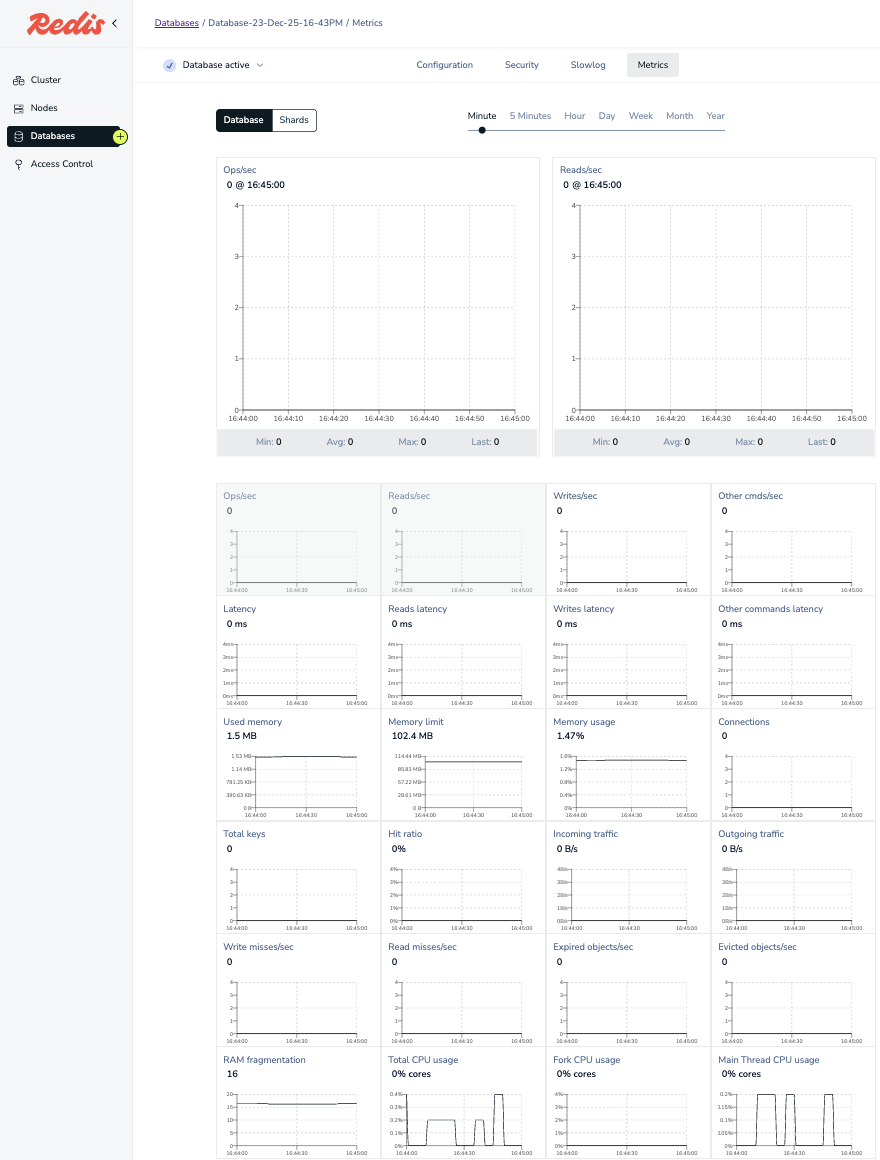
In the Redis Software Cluster Manager UI, you can see real-time performance metrics for clusters, nodes, databases, and shards, and configure alerts that send notifications based on alert parameters. Select the Metrics tab to view the metrics for each component. For more information, see Monitoring with metrics and alerts.

See the following topics for metrics definitions:
- Database operations for database metrics
- Resource usage for resource and database usage metrics
- Auto Tiering for additional metrics for Auto Tiering databases
Prometheus metrics
To collect and display metrics data from your databases and other cluster components, you can connect your Prometheus and Grafana server to your Redis Software cluster. We recommend you use Prometheus and Grafana to view metrics history and trends.
See Prometheus integration to learn how to connect Prometheus and Grafana to your Redis Software database.
The new metrics stream engine that exposes the v2 Prometheus scraping endpoint at https://<IP>:8070/v2 is generally available as of Redis Software version 8.0.
This new engine exports all time-series metrics to external monitoring tools such as Grafana, DataDog, NewRelic, and Dynatrace using Prometheus.
The new engine enables real-time monitoring, including full monitoring during maintenance operations, providing full visibility into performance during events such as shards' failovers and scaling operations.
For a list of available metrics, see the following references:
If you are already using the existing scraping endpoint for integration, follow this guide to transition and try the new engine. It is possible to scrape both existing and new endpoints simultaneously, allowing advanced dashboard preparation and a smooth transition.
Limitations
Shard limit
Metrics information is not shown for clusters with more than 128 shards. For large clusters, we recommend you use Prometheus and Grafana to view metrics.
Metrics not shown during shard migration
The following metrics are not measured during shard migration when using the internal monitoring systems. If you view these metrics while resharding, the graph will be blank.
- Evicted objects/sec
- Expired objects/sec
- Read misses/sec
- Write misses/sec
- Total keys
- Incoming traffic
- Outgoing traffic
- Used memory
This limitation does not apply to the new metrics stream engine.