Blog
Native OpenTelemetry metrics for Redis client libraries

When Redis server metrics look healthy but an application isn’t performing adequately (for instance, service time outs or p99 latency climbing for no obvious reason) the explanation is often not inside Redis at all. These symptoms frequently trace back to the client layer: connection pools can get under strain, requests can start queuing for an available connection, or retries could silently inflate the latency that users experience.
Server-side monitoring was never designed to capture this. It tells you a lot about what Redis is doing internally (memory consumption, replication lag, command throughput, persistence behavior) but very little about how each app process is interacting with it. That gap matters more than it sounds, because the client is where app problems are felt. Without visibility into that layer, debugging tends to come down to inference and elimination rather than direct observation.
That’s the gap we set out to close.
We are introducing native OpenTelemetry metrics support in Redis client libraries as the first phase of a broader Redis client observability initiative.
This feature doesn’t replace server-side monitoring. It makes the client side visible enough that engineers can see what’s happening inside their application: how connections are behaving, which errors occur, how connections are created, where pool pressure builds, what’s the stream message processing lag, client-side caching and pub-sub stats and more.
This release focuses on metrics - the first piece of client-side observability.
The current scope is intentionally focused:
- Native OpenTelemetry metrics in Redis client libraries (currently available in redis-py v7.3.0+, go-redis v9.18.0+ and node-redis v5.12.0+).
- Export through the standard OpenTelemetry pipeline
- Dashboarding and filtering built around practical troubleshooting workflows
Design principles
Disabled by default
Observability is disabled by default. When it is enabled, the instrumentation code paths are still there, but they resolve to empty stubs via the OpenTelemetry SDK's no-op implementation. When disabled, overhead stays well under 1% in all tested scenarios. This was a non-functional requirement from the start, and we validated it explicitly as part of the benchmark work. Enabling observability is done by deliberate choice; leaving it off is essentially free.
Process-wide OpenTelemetry integration
The client libraries do not instantiate OpenTelemetry providers on their own. Instead, they plug into the process-wide OpenTelemetry SDK model. Apps initialize observability once, and Redis client metrics are emitted through that existing telemetry setup.
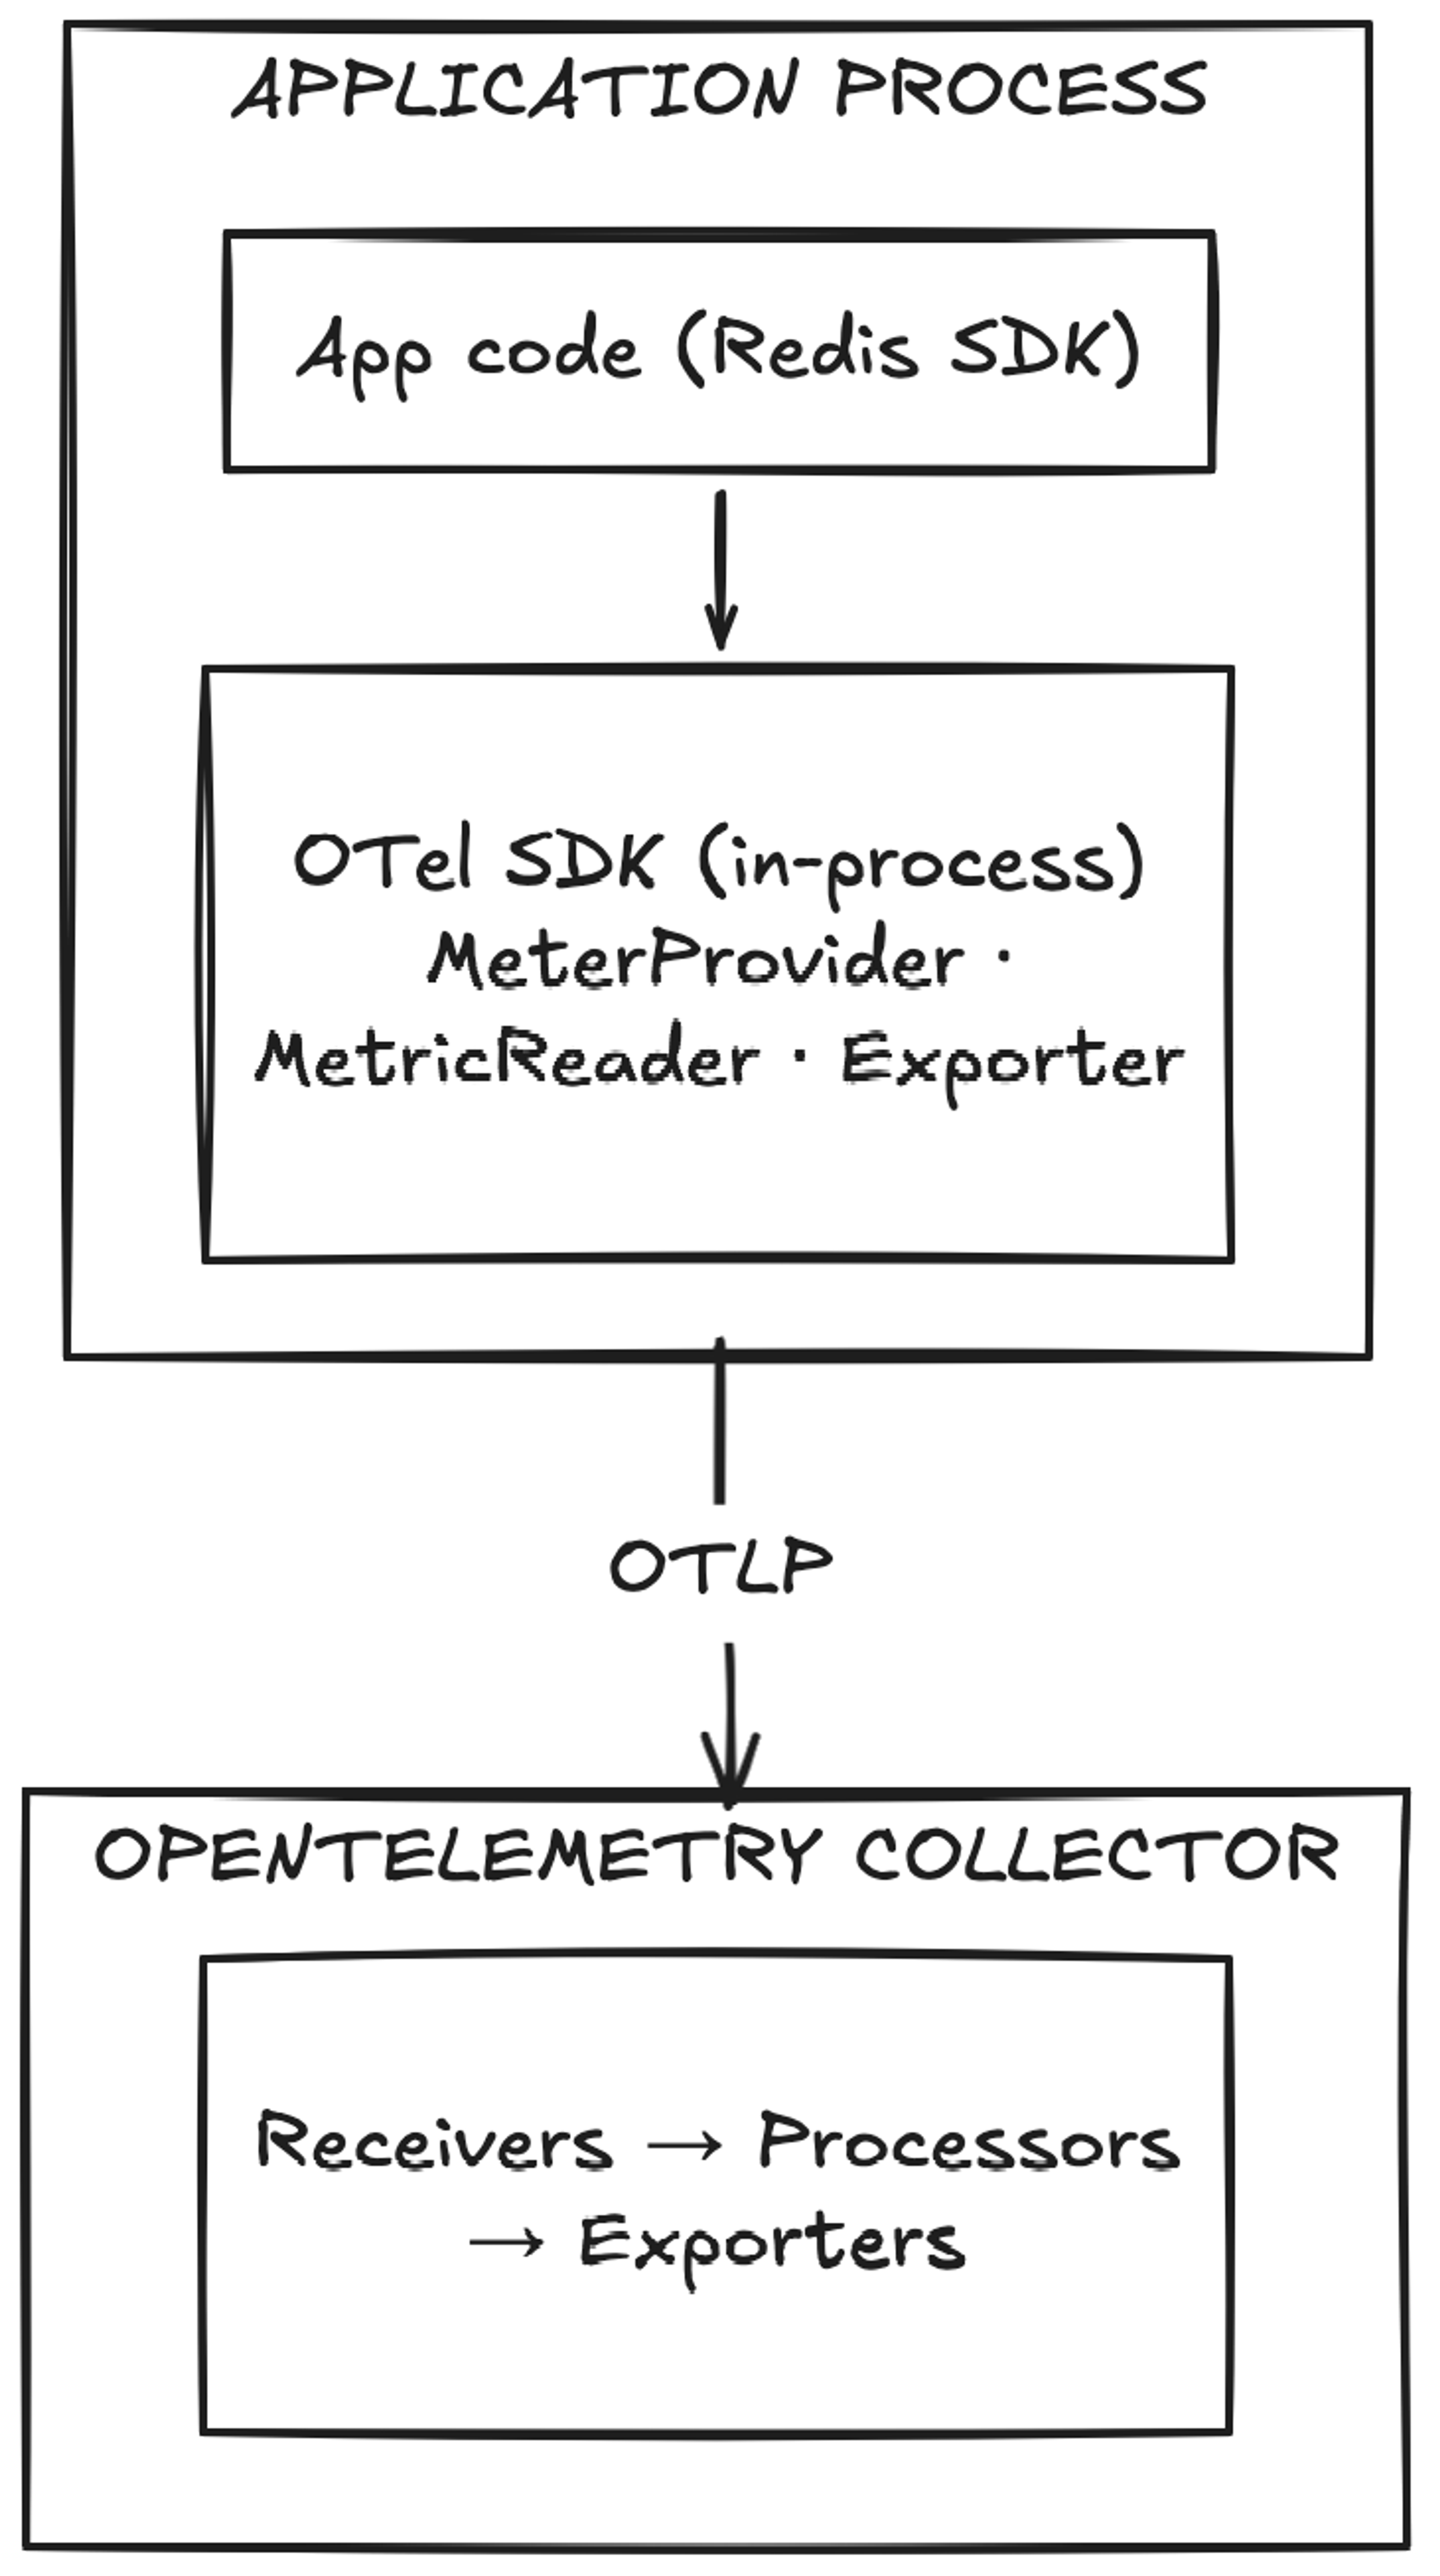
How Redis client metrics flow through the OpenTelemetry pipeline
This avoids a common integration problem where libraries try to manage telemetry lifecycle independently and end up conflicting with the application’s own observability stack.
Aligned with OpenTelemetry semantic conventions
Where OTel Semantic Conventions already define the right shape, the metric names follow them directly. Names like db.client.operation.duration and db.client.connection.count, for example, aren’t Redis-specific inventions — they are part of the OTel standard for how database clients report telemetry. For those metrics, existing dashboards and alerting rules built around OTel SemConv conventions will work naturally without Redis-specific adaptations.
For Redis-specific signals that aren’t covered by the standard, the spec introduces metrics under the redis.client.* namespace. Examples include redis.client.errors (with error category and internal/user-visible classification), redis.client.maintenance.notifications (tracking server-side maintenance events), redis.client.geofailover.failovers, and the full set of client-side caching metrics like redis.client.csc.requests and redis.client.csc.evictions. These are Redis-defined extensions and will need a Redis-aware dashboard configuration.
Low overhead intent with explicit controls
We benchmarked aggressively, and the results weren’t uniform across clients. In go-redis the overhead is negligible even when all metrics are enabled - well under 0.2% at default settings. node-redis is similarly lightweight in normal operation, with the caveat that a saturated event loop amplifies the costs noticeably. redis-py is the outlier: the overhead of the most common metrics stays around 0.5%, but the command latency metric alone adds roughly 7–8%. These numbers are what shaped the metric groups model. A 7–8% hit from a single signal is only acceptable if it's opt-in, and that's exactly how it works. Each group is controlled independently, so teams can decide which overhead is worth paying for and which isn't.
The same logic applies to the metric storage layer: fewer enabled groups mean fewer active series and lower storage and query costs on the backend.
Configuration also includes command allow/block lists and options to suppress stream or channel names when cardinality needs to be constrained.
The metrics model: Grouped for signal, performance & cardinality control
The currently defined groups are:
resiliency- different error counts, server-side maintenance notifications, etc.connection-basic- number of idle/active connections, connection time, etc.connection-advanced- time to obtain a connection from the pool, total closed connections etccommand- command latencyclient-side-cachingpubsubstreaming
By default, only resiliency and connection-basic are enabled, a default that’s conservative on purpose. It covers the most common debugging needs without forcing every signal on from the start.
It also helps manage two things that always matter in observability: overhead and cardinality. The more granular the signal, the more important it becomes to make conscious choices about where it’s worth collecting.
Each group maps to a specific class of question you might ask when debugging client behavior: connection health, command latency, cache efficiency, pub/sub throughput, stream lag. The full breakdown of what each group covers is in the observability docs.
A minimal initialization example
The intended setup is intentionally simple. Apps initialize observability once and choose the metric groups they want.
For Python, the OTel extras need to be installed first:
Then observability is initialized once at application startup:
A practical rollout path is to start with the default groups or something close to them, establish a baseline, and then enable additional groups only where they answer a real operational question.
For example:
- start with
resiliencyandconnection-basic - add command if
commandlatency is important to your debugging workflow - add
connection-advancedwhen pool wait time and pending requests matter - add
client-side-caching,pubsub, orstreamingif your application uses those features heavily
That staged approach is usually better than enabling everything immediately and sorting out the costs later.
We also provide a Grafana dashboard with Prometheus as the data source if you want a starting point for visualizing the metrics, along with full initialization examples for Python and Go, with Node.js coming soon.
Native metrics vs. external wrappers
External instrumentation libraries exist, and some teams are already using them. They typically work by monkey-patching the Redis client at runtime, which gets you some visibility, but only at the call boundary. Signals that live deeper inside the client, like connection pool state, handoff timing, retry-aware command duration, client-side cache eviction triggers, aren't reachable from outside. That's the gap native instrumentation fills.
Try it
Available now in go-redis v9.18.0, redis-py v7.3.0 and node-redis v5.12.0. Start with the default metric groups and enable more only where they answer a real question. If something useful is missing, or something adds too much overhead, we want to know, so please open an issue in the relevant repository:
Get started with Redis today
Speak to a Redis expert and learn more about enterprise-grade Redis today.