Learn

How to add Redis as a datasource in Grafana and build customize dashboards for Analytics

Ajeet Raina
Author
Ajeet Raina, Former Developer Growth Manager at Redis

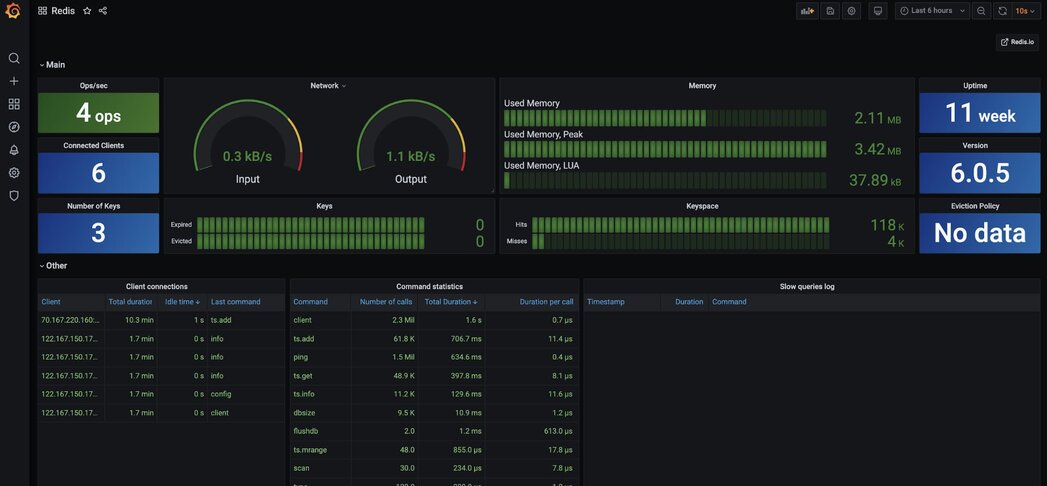
The Redis Data Source for Grafana is a plug-in that allows users to connect to the Redis database and build dashboards in Grafana to easily monitor Redis and application data. It provides an out-of-the-box predefined dashboard, but also lets you build customized dashboards tuned to your specific needs.

Features and Capabilities#

  • Grafana 7.1 and later with a new plug-in platform supported.
  • Data Source can connect to any Redis database. No special configuration is required.
  • Redis Cluster and Sentinel supported since version 1.2.
  • Data Source supports:
  • Redis Time SeriesTS.GET, TS.INFO, TS.MRANGE, TS.QUERYINDEX, TS.RANGE
  • Triggers and FunctionsRG.DUMPREGISTRATIONS, RG.PYEXECUTE, RG.PYSTATS
  • SearchFT.INFO
  • GraphGRAPH.QUERY, GRAPH.SLOWLOG

Using Homebrew#

Step 1. Install Grafana#

 brew install grafana

Step 2. Install Redis Datasource#

Homebrew downloads and untars the files into /usr/local/Cellar/grafana/version.

Step 3. Start Grafana service#

 brew services start grafana

Step 4. Access Grafana dashboard#

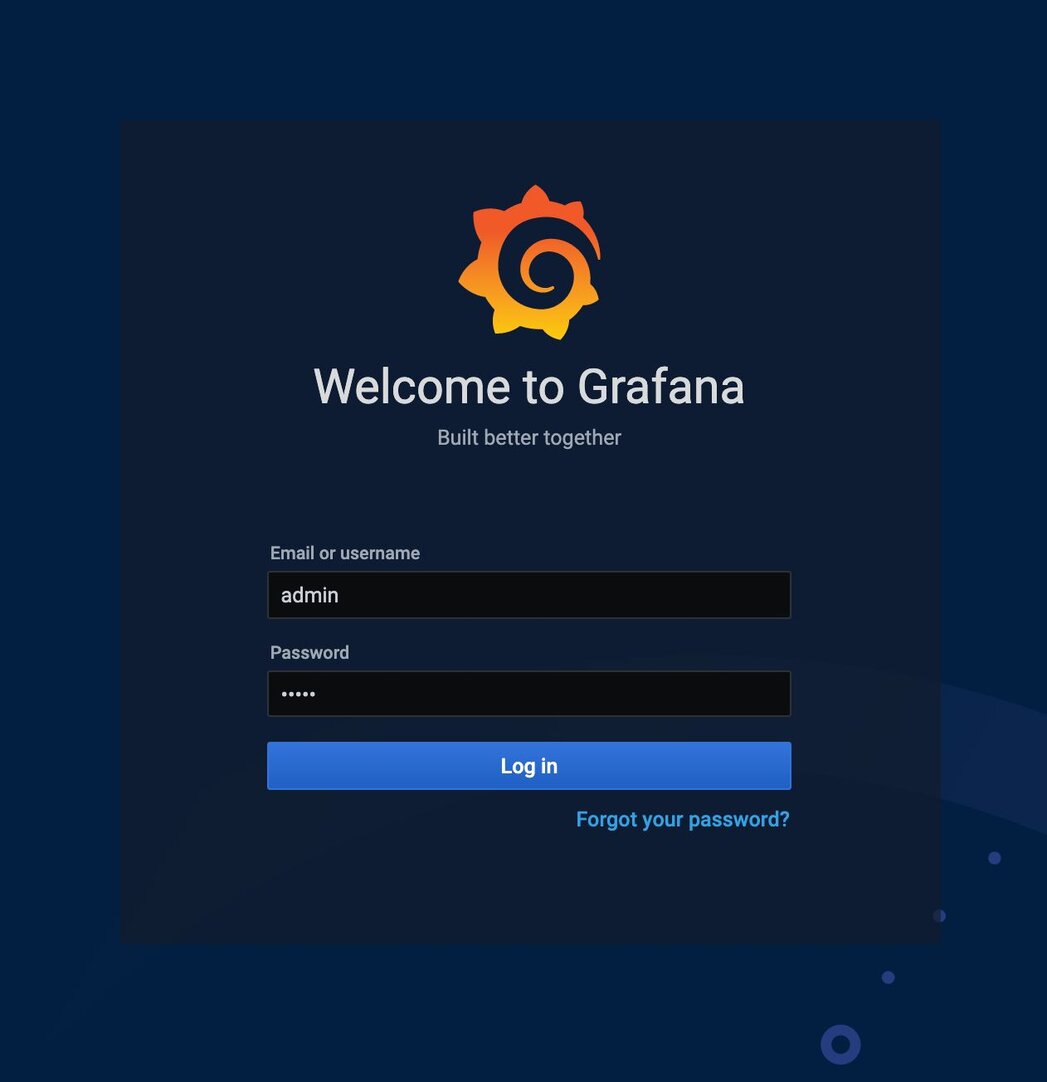
Open https://IP:3000 to access grafana. The default username/password is admin/admin.
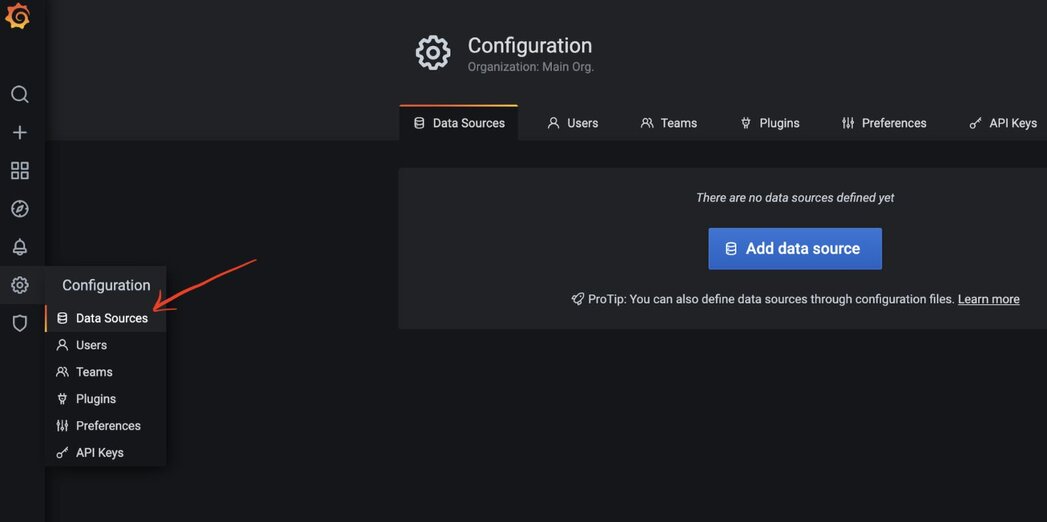
Step 5. Click "Configuration"#
Step 6. Add Redis as a Data Source#
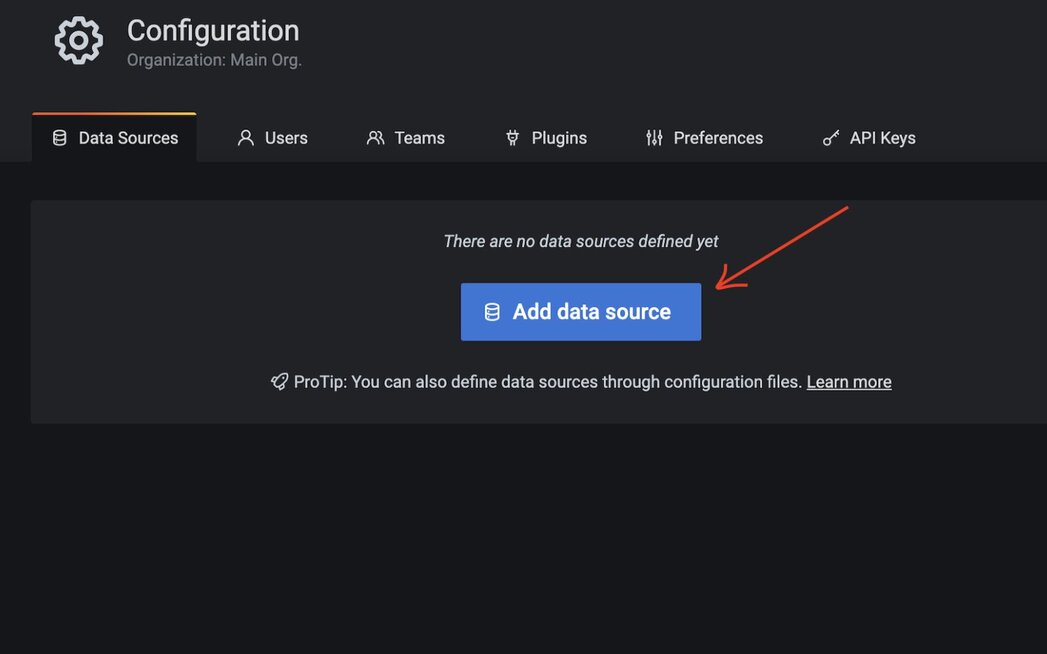
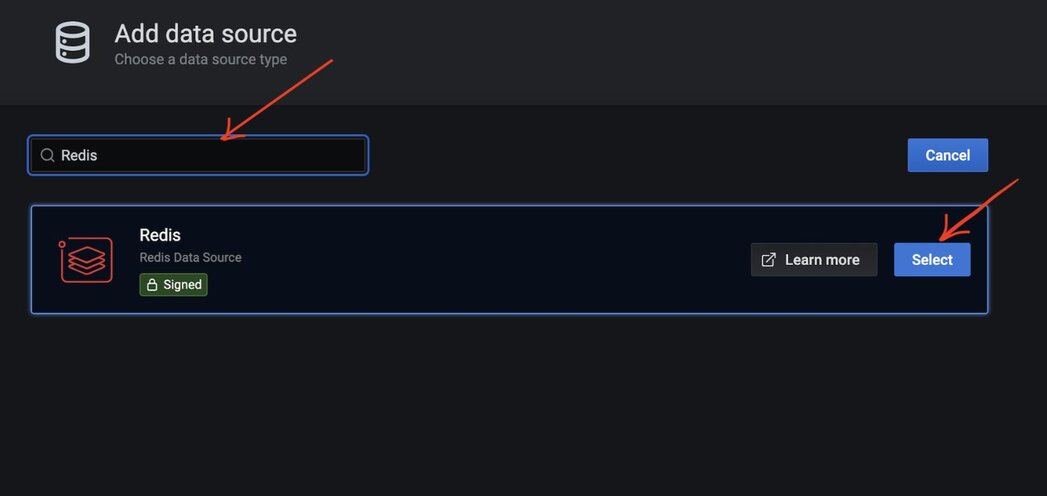
Step 7. Select "Redis" as data source type#
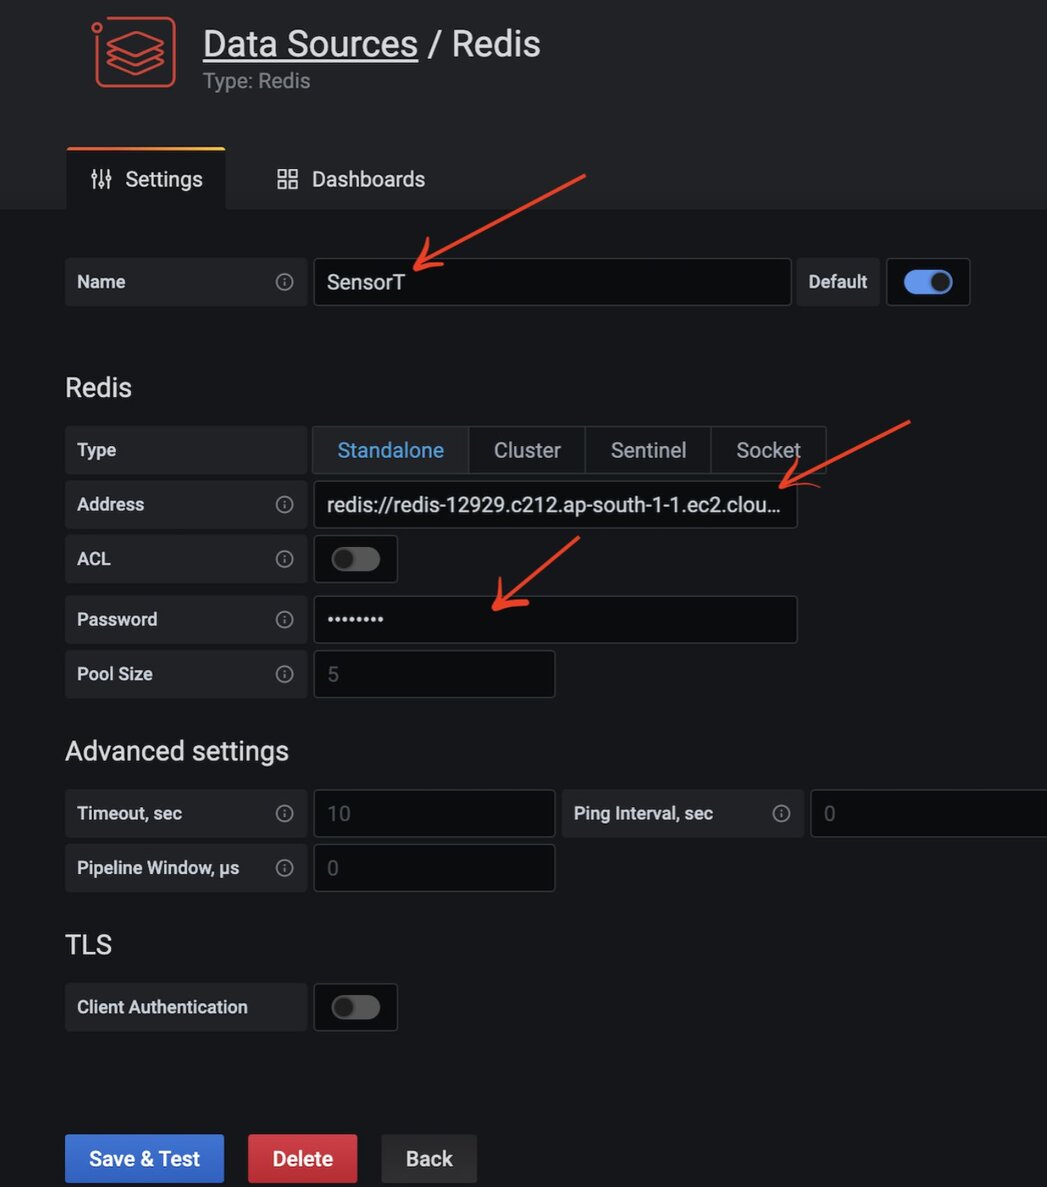
Step 8. Add Redis Database name, Endpoint URL and password#

Assuming that you already have Redis server and database up and running in your infrastructure. You can also leverage Redis Cloud as showcased in the below example.
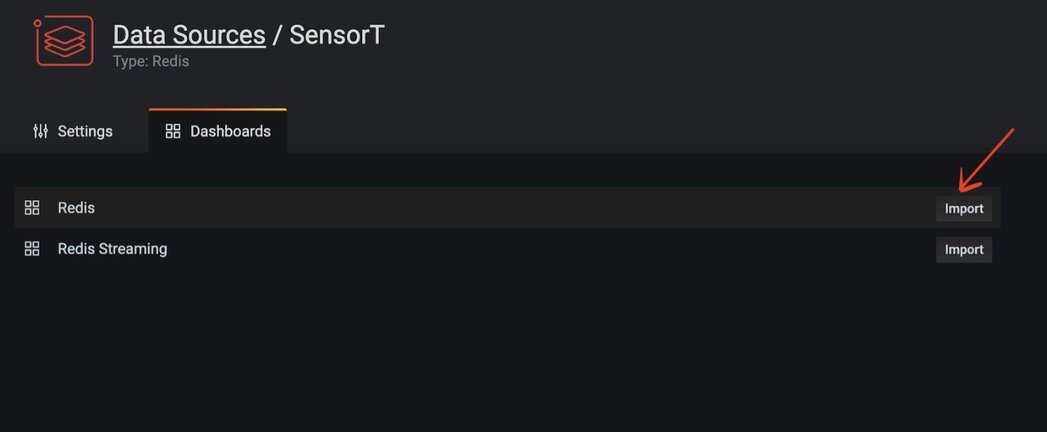
Step 9. Click "Import" under Dashboard#
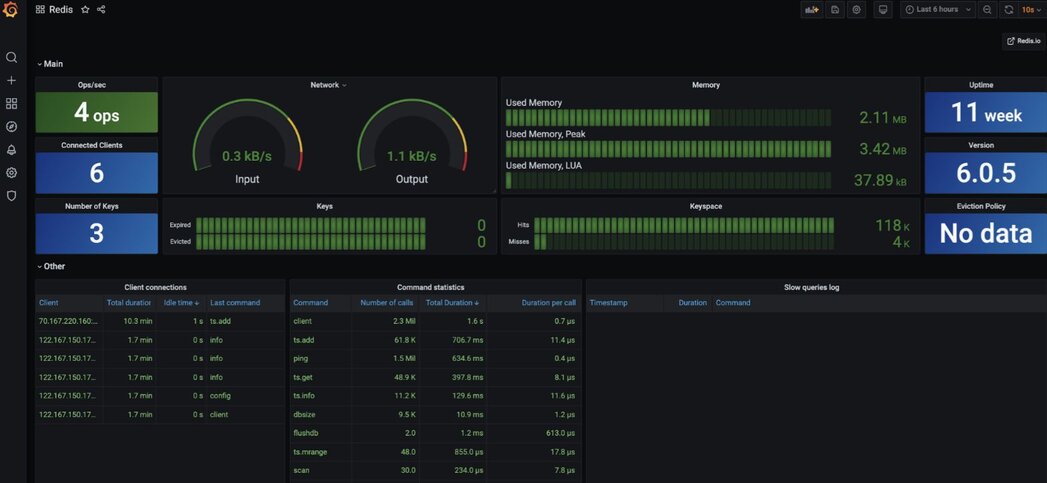
Step 10.Access the Redis datasource Dashboard#
Supported commands#

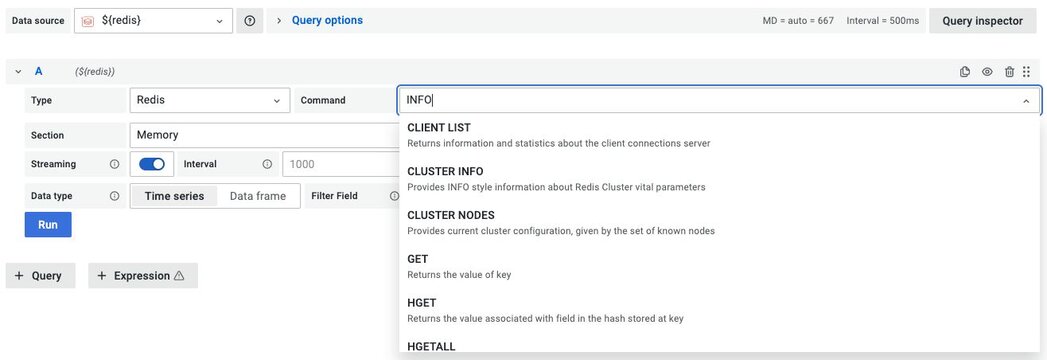
Data Source supports various Redis commands using custom components and provides a unified interface to query any command.
Further References#