
TL;DR:Build a real-time analytics dashboard with Redis Bitmaps and Node.js. UseSETBIT,BITCOUNT, andBITOPto track daily active users, page views, traffic sources, and product purchases using memory-efficient bitmap counters. Clone the repo and follow the steps below to get started.
Interactive analytics dashboards allow you to share data and provide vital information for making game-changing decisions at a faster pace. Building a real-time dynamic dashboard using a traditional relational database might require a complex set of queries. By using a NoSQL database like Redis, you can build a powerful interactive and dynamic dashboard with a small number of Redis commands.
#What will you learn?
- How to use Redis Bitmaps to track user activity with minimal memory overhead
- How to count daily active users, page views, and traffic sources with
BITCOUNT - How to combine bitmap data across time periods using
BITOP - How to model cohort analysis and customer retention using Redis Sets and Bitmaps
- How to build a full-stack analytics dashboard with Node.js and Vue.js
#Prerequisites
- Node.js v12.19.0 or later
- NPM v6.14.8 or later
- Docker v19.03.13 or later (optional)
- Basic familiarity with Redis commands
#Why use Redis Bitmaps for analytics?
Redis Bitmaps are a memory-efficient way to track binary state (true/false) for large populations of users. A single bitmap can track whether each of millions of users performed a specific action, using only 1 bit per user. For example, tracking whether 10 million users visited your site in a given day requires only ~1.2 MB of memory.
Key advantages of Redis Bitmaps for analytics:
- Memory efficiency: 1 bit per user per metric, compared to storing full records in a relational database
- Sub-millisecond queries:
BITCOUNTreturns the count of active users instantly, regardless of population size - Set operations on populations:
BITOPlets you compute intersections, unions, and differences across time periods or segments - Real-time updates:
SETBITis an O(1) operation, so recording each user action is instantaneous
#How do you set up the analytics dashboard?
#Step 1. Clone the repository
#Step 2. Set up the backend
Go to the
/server folder and copy the environment file:#Step 3. Install backend dependencies
#Step 4. Run Docker Compose to install Redis
You may need to preface the docker command with
sudo. If you don't want to use sudo, create a Unix group called docker and add users to it. When the Docker daemon starts, it creates a Unix socket accessible by members of the docker group. Once the Redis database is up and running, you can connect to it using the redis-cli command.TIP
- By default, Redis runs on port 6379 but you can change it by specifying an alternative host port in the docker compose file.
- You can use a Redis configuration file and mount it as volumes in the docker compose YAML file.
- You can connect to the Redis instance by using redis-cli -h hostname -p port command.
- You can run the Redis INFO command to get statistics, metrics and health information from the Redis instance like cache, memory stats, Redis metrics and modules enabled.
- Use the Redis MONITOR command to get a real time view of commands that clients send to Redis.
#Step 5. Run the backend
#Step 6. Set up the frontend
Go to the
/client folder and copy the environment file:#Step 7. Install frontend dependencies
#Step 8. Run the frontend
#How is the analytics data stored in Redis?
The event data is stored in various keys and various data types. For each combination of time span, scope, and data type, the application generates a unique Redis key.
#What time spans are tracked?
- year: e.g.
2021 - month: e.g.
2021-03(March 2021) - day: e.g.
2021-03-03(3rd March 2021) - weekOfMonth: e.g.
2021-03/4(4th week of March 2021) - anytime: all-time aggregate
#What scopes are tracked?
- source
- action
- source + action
- action + page
- userId + action
- global
#What data types are used?
- count (Integer stored as String)
- bitmap
- set
The generated key format is:
where values in
[] are optional.#How are counts stored?
For each generated key like
rab:count:*, data is stored with INCR:#How are sets stored?
For each generated key like
rab:set:*, data is stored with SADD:#How are bitmaps stored?
For each generated key like
rab:bitmap:*, data is stored with SETBIT:#How does cohort analysis work with Redis?
Cohort data tracks users who registered and then bought products (the order matters).
- For each buy action in December, the app checks if the user performed a register action before (register counter must be greater than zero).
- If so, the user's bit is set:
SETBIT rab:bitmap:custom:cohort-buy:timeSpan:{timeSpan} {userId} 1 - Example: User Id 2 bought 2 products on 2015-12-17 but never registered. This is not stored.
- Example: User Id 10 bought 1 product on 2015-12-17 and registered on 2015-12-16. This is stored:
SETBIT rab:bitmap:custom:cohort-buy:timeSpan:2015-12 10 1 - The application assumes that a user cannot buy without registering.
#How does retention tracking work with Redis?
Retention means users who bought on two different dates.
- For each buy action, the app checks if the user bought more products anytime than on the current day (current purchase not included).
- If so, the user id is added to a set:
SADD rab:set:custom:retention-buy:timeSpan:{timeSpan} {userId} - Example: User Id 5 bought 3 products on 2015-12-15. Retention is not stored (products bought on that day: 2, products bought anytime before: 0).
- Example: User Id 3 bought 1 product on 2015-12-15 and previously bought 1 product on 2015-12-13. Retention is stored:
SADD rab:set:custom:retention-buy:timeSpan:2015-12 3
#How is the analytics data queried?
#How do you get total traffic?
December total:
A specific week of December:
#How do you get traffic per page?
The
{page} parameter is one of: homepage, product1, product2, product3.December total:
A specific week of December:
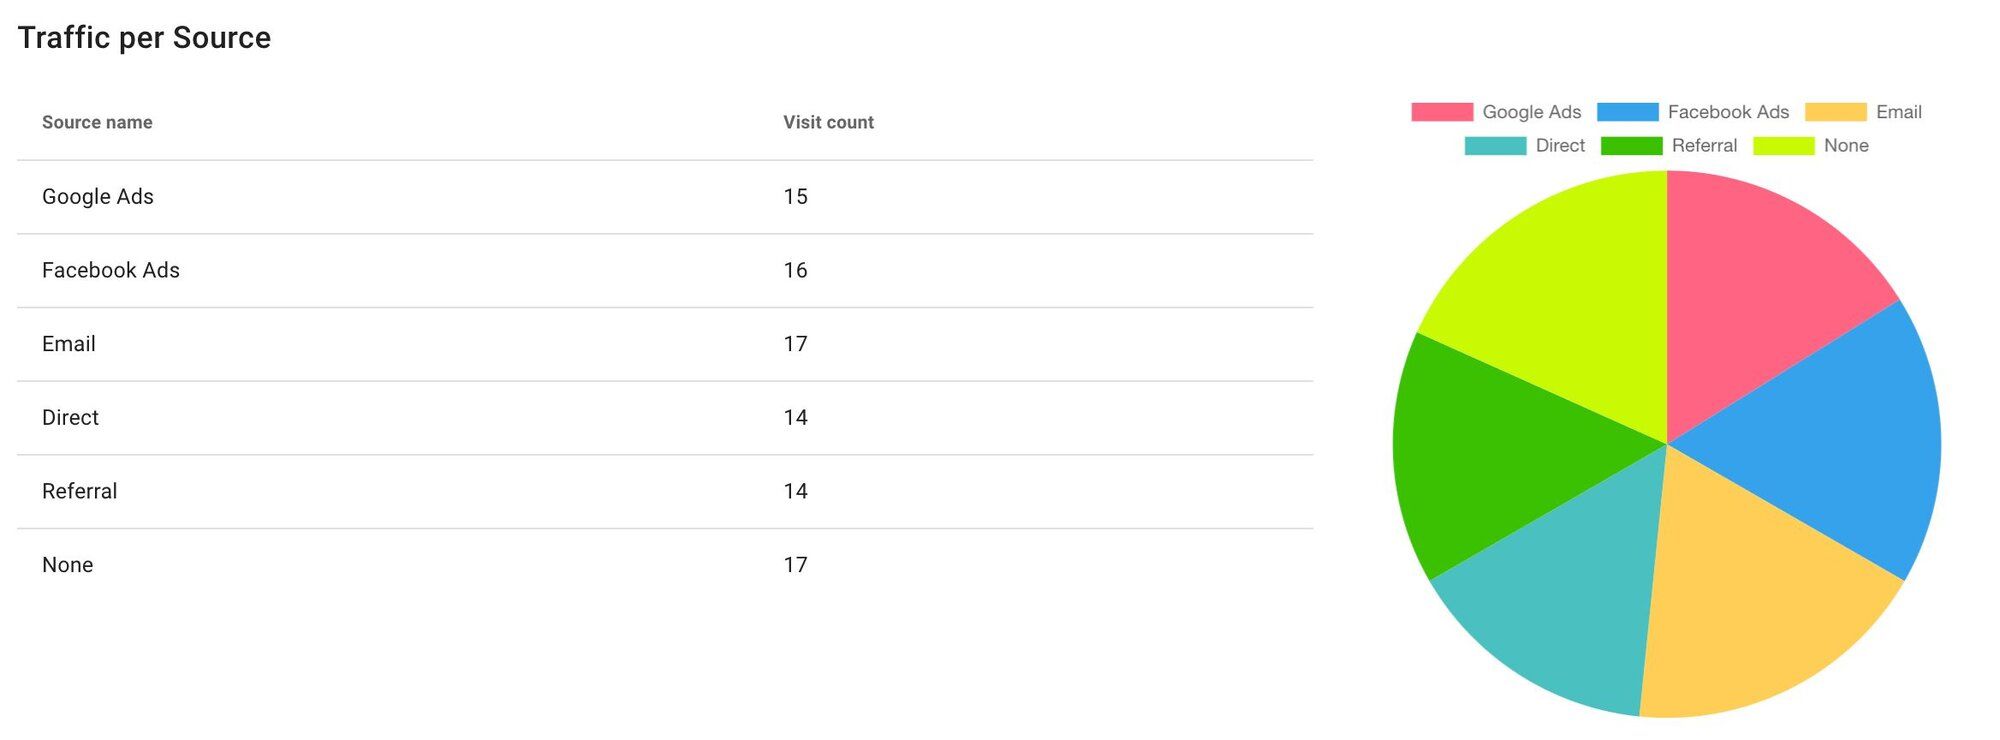
#How do you get traffic per source?
The
{source} parameter is one of: google, Facebook, email, direct, referral, none.December total:
A specific week of December:
#How do you get trend traffic?
The
{page} parameter is one of: homepage, product1, product2, product3.- December: run
BITCOUNTfor each day from2015-12-01to2015-12-31 - Week 1: from
2015-12-01to2015-12-07 - Week 2: from
2015-12-08to2015-12-14 - Week 3: from
2015-12-15to2015-12-21 - Week 4: from
2015-12-22to2015-12-28 - Week 5: from
2015-12-29to2015-12-31
Example for week 5:
#How do you get product purchase totals?
December total:
A specific week of December:
#How do you get add-to-cart totals?
December total:
A specific week of December:
#How do you get product purchase shares?
The
{productPage} parameter is one of: product1, product2, product3.December total:
A specific week of December:
#How do you run customer and cohort queries?
People who registered:
People who registered then bought (order matters):
Dropoff rate:
(People who registered then bought / People who registered) * 100 [%]Customers who bought only a specified product:
Customers who bought both Product 1 and Product 2:
Customer retention (customers who bought on different dates):
#Next steps
- Build a shopping cart application using Node.js and Redis for another e-commerce use case
- Learn how to cache REST API responses using Redis and Node.js for faster backend performance
- Explore real-time fraud detection with Redis to see another bitmap-friendly use case
- Read about building a popup store with Redis Streams for real-time event processing
- Get started quickly with the Redis quick start guide
- Browse the complete source code on GitHub
- Learn more about Redis Bitmaps in the official documentation