
TL;DR:Build a real-time popup store with Redis by using Redis Streams for event-driven order processing, Redis time series for live analytics, and a Node.js backend to simulate customer traffic. Visualize the entire data pipeline in Grafana with the Redis Datasource plugin. Clone the repo and rundocker-compose upto get started.
Pop-up stores are becoming a popular channel for retailers to create a new revenue stream, generate buzz with customers, test product concepts, or unload excess inventory. Since the idea is to spin up the store quickly and then close it shortly thereafter, it doesn't make sense to spend a lot of time on development. With the right Redis data structures, you can create a robust, real-time customer experience without a lot of development effort.
#What will you learn?
- How to use Redis Streams for real-time event processing in an e-commerce scenario
- How to track inventory and sales metrics with Redis time series
- How to visualize a live data pipeline using Grafana and the Redis Datasource
- How to process and complete orders in real time using stream consumers
#Prerequisites
- Docker and Docker Compose installed
- Basic familiarity with Node.js
- A basic understanding of Redis Streams
#What is a popup store application?
This pop-up store demo illustrates a company that sells a single product and has 10,000 units available for purchase. Each customer can purchase one unit and the sale lasts only 10 minutes, so order processing must be instantaneous. The demo shows how to visualize a data pipeline in real time using Redis Streams, Redis time series, and Redis Datasource with Grafana.
NOTEThis demo originally used RedisGears for stream processing. RedisGears has been deprecated and is no longer available as a standalone module. The stream processing concepts demonstrated here can be implemented using Redis triggers and functions or application-level stream consumers. The repository may require updates to run with current Redis versions.
#How do you clone and run the popup store?
#Step 1. Clone the repository
#Step 2. Run the application
#How do you access the Grafana dashboard?
Open
http://localhost:3000 to access the Grafana dashboard.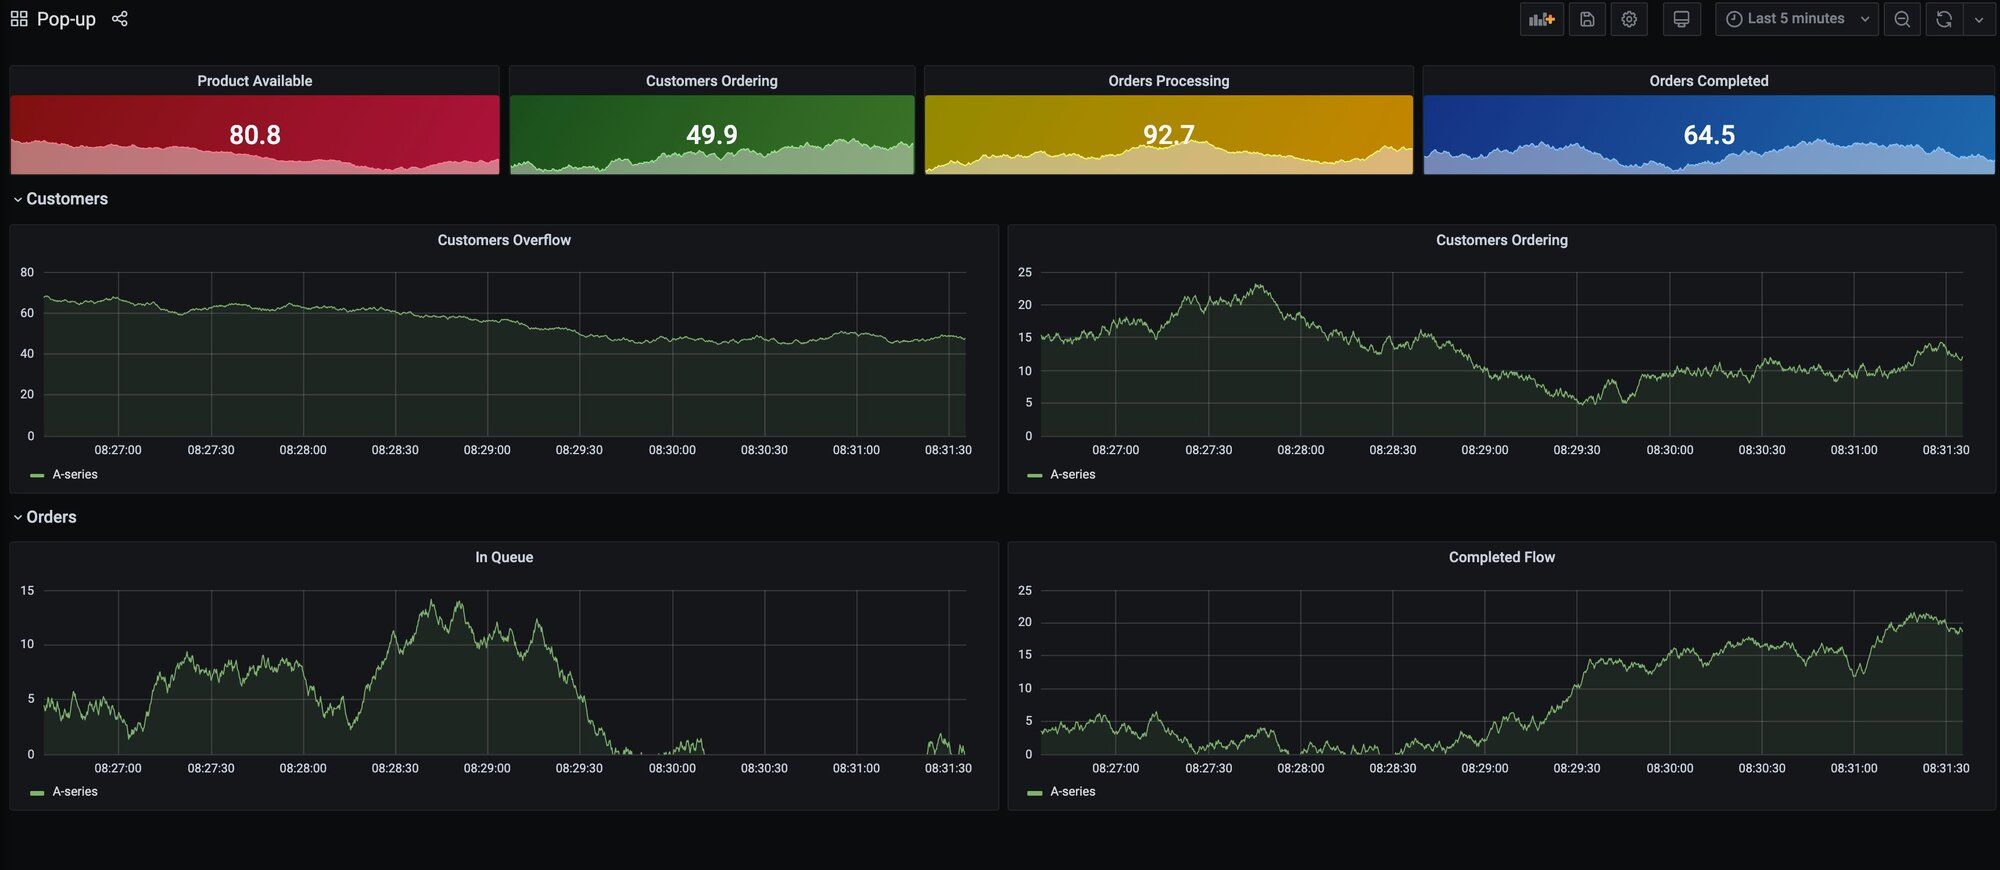
Grafana queries Redis Streams and time series keys every 5 seconds to display live samples using the Grafana Redis Datasource. The dashboard displays:
- Product Available: the value of the
productkey, which decreases as orders complete - Customers Ordering, Orders Processing, and Orders Completed: the length of
queue:customers,queue:orders, andqueue:completestreams - Customers Overflow: the difference between customer-submitted orders and orders completed
- Customers Ordering: orders created in the last 5 seconds
- Orders In Queue: orders waiting to be processed
- Completed Flow: orders completed in the last 5 seconds
#How does the popup store architecture work?
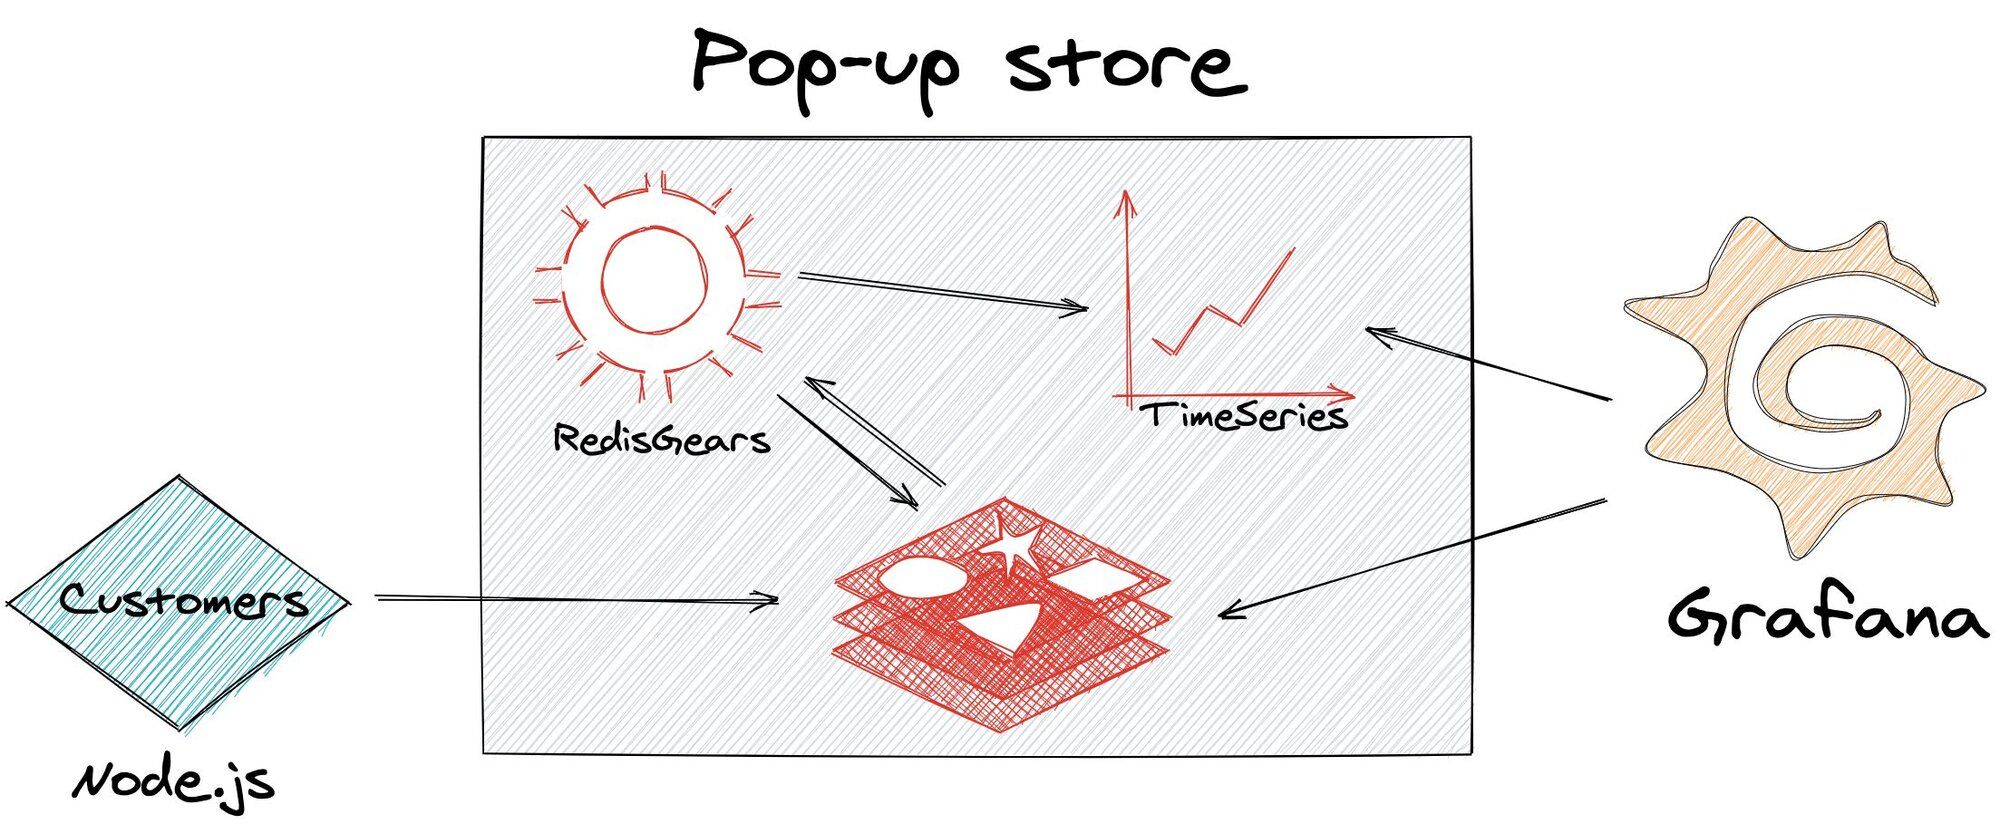
The application follows an event-driven architecture. The code samples below use the deprecated RedisGears API for reference; see the note above for modern alternatives.
- A Node.js script adds random data to the customers and orders streams, simulating flash sale traffic.
- A stream processor watches all
queue:keys and adds time series samples for monitoring.
- Another stream processor completes orders by:
- Adding data to the
queue:completestream - Deleting the client's ordering entry
- Decreasing the product amount
- Trimming the orders queue
- Adding data to the
#Next steps
- Explore available-to-promise inventory tracking with Redis for production-grade real-time inventory management
- Learn about real-time local inventory search with Redis for location-based product availability
- Build a full shopping cart application using Node.js and Redis
- Read about streaming LLM output with Redis Streams for another Redis Streams use case
- Browse the Redis Popup Store GitHub Repository for the full source code
- Read 3 Real-Life Apps Built with Redis Data Source for Grafana for more Grafana integration examples