For developersRedis Time Series


NOTERedis now supports time series data structures natively without the need for a module
Redis time series is a Redis module that enhances your experience managing time-series data with Redis. It simplifies the use of Redis for time-series use cases such as internet of things (IoT) data, stock prices, and telemetry. With Redis time series, you can ingest and query millions of samples and events at the speed of Redis. Advanced tooling such as downsampling and aggregation ensure a small memory footprint without impacting performance. Use a variety of queries for visualization and monitoring with built-in connectors to popular monitoring tools like Grafana, Prometheus, and Telegraf.
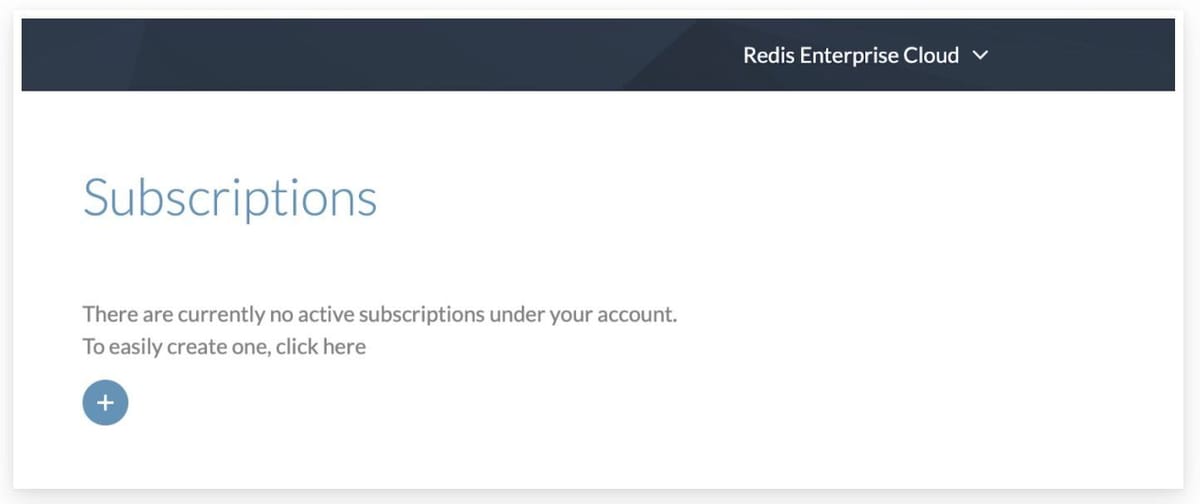
#Step 1. Register and subscribe
Follow this link to register and subscribe to Redis Cloud

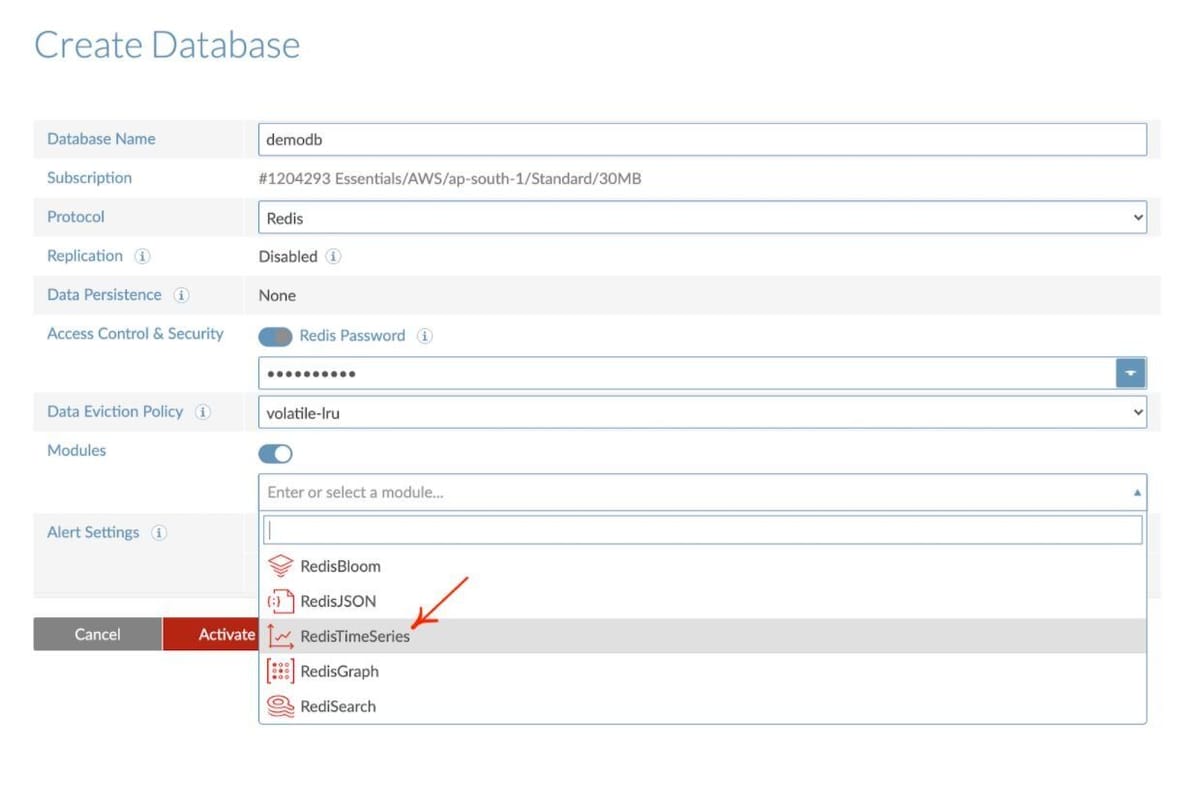
#Step 2. Create a database with Redis time series

#Step 3. Connect to a database
Follow this link to learn how to connect to a database
#Step 4. Getting Started with Redis time series
This section will walk you through using some basic Redis time series commands. You can run them from the Redis command-line interface (redis-cli) or use the CLI available in Redis Insight. (See part 2 of this tutorial to learn more about using the Redis Insight CLI.) Using a basic air-quality dataset, we will show you how to:
- Create a new time series
- Add a new sample to the list of series
- Query a range across one or multiple time series

#Create a new time series
Let’s create a time series representing air quality dataset measurements. To interact with Redis time series you will most often use the TS.RANGE command, but here you will create a time series per measurement using the TS.CREATE command. Once created, all the measurements will be sent using TS.ADD.
The sample command below creates a time series and populates it with three entries:
In the above example, ts:carbon_monoxide, ts:relative_humidity and ts:temperature are key names. We are creating a time series with two labels (sensor_id and area_id are the fields with values 2 and 32 respectively) and a retention window of 60 milliseconds:
#Add a new sample data to the time series
Let’s start to add samples into the keys that will be automatically created using this command:
#Querying the sample
Now that you have sample data in your time series, you’re ready to ask questions such as:
#“How do I get the last sample?”
TS.GET is used to get the last sample. The returned array will contain the last sample timestamp followed by the last sample value, when the time series contains data:
#“How do I get the last sample matching the specific filter?”
TS.MGET is used to get the last samples matching the specific filter:
#“How do I get the sample with labels matching the specific filter?”
#Query a range across one or more time series
TS.RANGE is used to query a range in forward directions while TS.REVRANGE is used to query a range in reverse directions, They let you answer such questions as:
#“How do I get the sample for a time range?”
#Aggregation
You can use various aggregation types such as avg, sum, min, max, range, count, first, last etc. The example below example shows how to use “avg” aggregation type to answer such questions as:
#“How do I get the sample for a time range on some aggregation rule?”
#Next Steps
- Learn more about Redis time series in the Redis quick start tutorial.