Tutorial
Redis Software Observability with Prometheus and Grafana
February 26, 202611 minute read
How do you monitor Redis Software with Prometheus and Grafana? Deploy a turnkey observability stack that scrapes Redis metrics via the v2 Metrics Stream Engine, visualizes them in pre-built Grafana dashboards, and alerts you to issues before they impact your applications.
This tutorial walks you through the full setup in about an hour and is aimed at system administrators and DevOps professionals running Redis Software.
#What you'll learn
- How to deploy a Prometheus and Grafana monitoring stack for Redis Software
- How to read and interpret Redis Software v2 metrics and dashboards
- How to configure alerting rules in Prometheus for Redis performance and availability
- How to build custom Grafana dashboards with advanced Redis metrics
NOTEThis tutorial relies on an existing Redis Software instance. You may follow our quickstart guide for testing environments or our installation documentation for production environments.
#Prerequisites
- A running Redis Software v7.8.2+ instance (required for v2 metrics support)
- Docker and Docker Compose installed
- Network access to your Redis Software cluster (port 8070 must be reachable)
- Your Redis Software cluster FQDN
- Intermediate familiarity with Redis and enterprise-grade infrastructure
#How do you set up the Redis monitoring stack?
The Redis Field Engineering team provides a turnkey solution that sets up Prometheus + Grafana with pre-configured dashboards. You can quickly set it up by running the following commands:
NOTEYou must usevery-secret-passwordin the setup script above. If you use a different password, the script won't run properly. This password is configured in thedocker-compose.ymlfile.
This script automatically:
- Configures Prometheus to scrape v2 metrics from your cluster
- Deploys Grafana with Redis Software dashboards
- Sets up the complete monitoring stack via Docker Compose
#How do you access the monitoring stack?
After the setup completes:
- Grafana: http://localhost:3000 (user: admin, pass: very-secret-password)
- Prometheus: http://localhost:9090
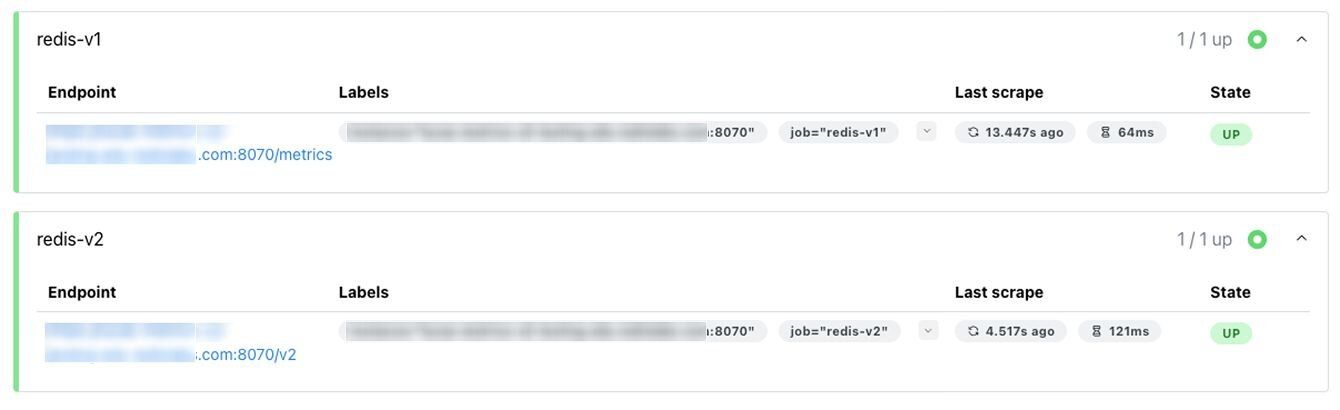
#How do you verify Prometheus is scraping Redis metrics?
1. Check that Prometheus is collecting metrics:
- Go to http://localhost:9090/targets
- redis-v1 and redis-v2 should show as "UP"
2. View your dashboards in Grafana:
- Sign in using user: admin, pass: very-secret-password
- Navigate to Dashboards
- Open "Cluster Status Dashboard" or other dashboards
- Verify data is populating
To see the metrics as they start to come in, you may want to make the time range smaller in the top right of the dashboard, e.g. "Last 5 Minutes".
#What is the difference between v1 and v2 Redis metrics?
This setup uses Redis Software Metrics Stream Engine. Below, you can compare features between the original Metrics v1 and v2.
| Feature | Metrics v1 | Metrics v2 |
|---|---|---|
| Precision | Millisecond averages | Microsecond histograms |
| Real-time | Snapshot-based | Stream-based |
| Maintenance visibility | Limited | Full visibility during failovers |
| Required version | Any | v7.8.2+ |
Why v2 matters: Real-time monitoring with sub-millisecond precision and visibility during all operations, including maintenance windows.
#How do you calculate latency with v2 metrics?
V1 approach (snapshot-based):
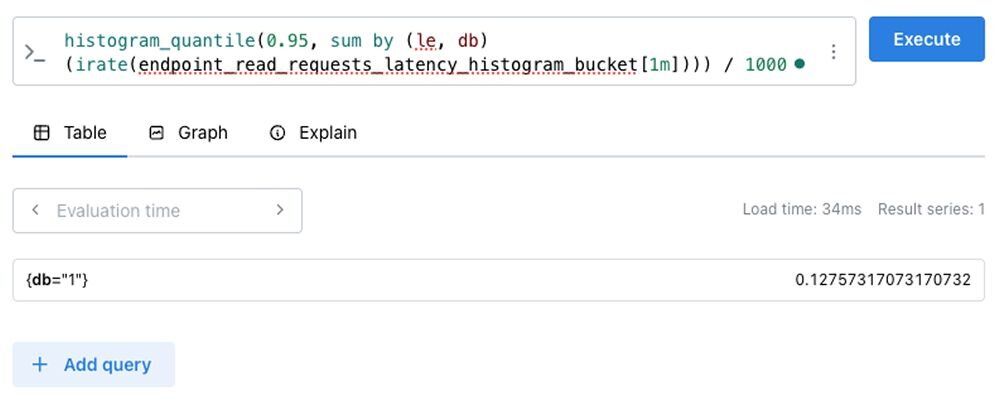
V2 approach (stream-based with PromQL):
The metrics take a couple minutes to come into Prometheus. If you're seeing no data and you're sure you're getting read requests, wait a few minutes and refresh or increase the time window, e.g. 1m -> 5m.
The v2 metrics stream engine provides finer-grained control over metric queries, including the ability to filter or aggregate results by quantile — for example, extracting the p95 (95th percentile) latency metric for specific operations.
This update gives you greater flexibility and precision in querying metrics, leveraging PromQL aggregation functions for powerful custom analysis.
#How do you migrate from v1 to v2 metrics?
For a comparison of queries if you're looking to move from V1 to V2, check out our Transition from Prometheus v1 to Prometheus v2 documentation
#How do you read and understand your Redis dashboards?
Let's dive into what the key metrics mean and how to interpret dashboard data for operational decision-making.
Your monitoring stack includes several pre-built dashboards. Here's what to focus on:
#Which dashboards should you monitor first?
Below are three important dashboards to get familiar with:
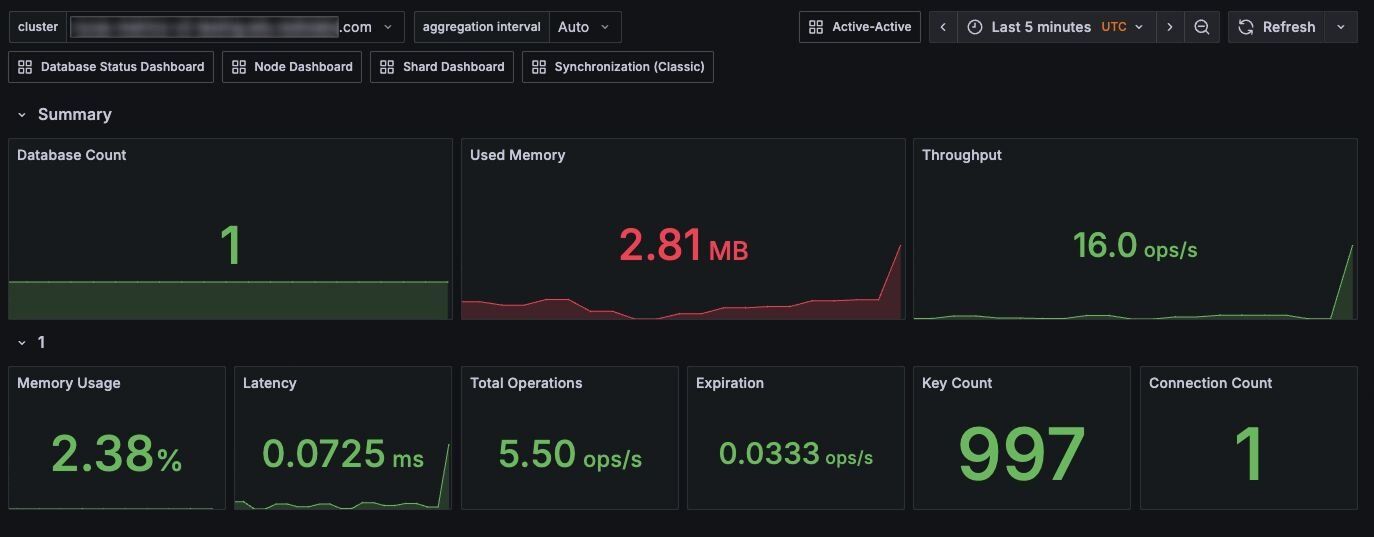
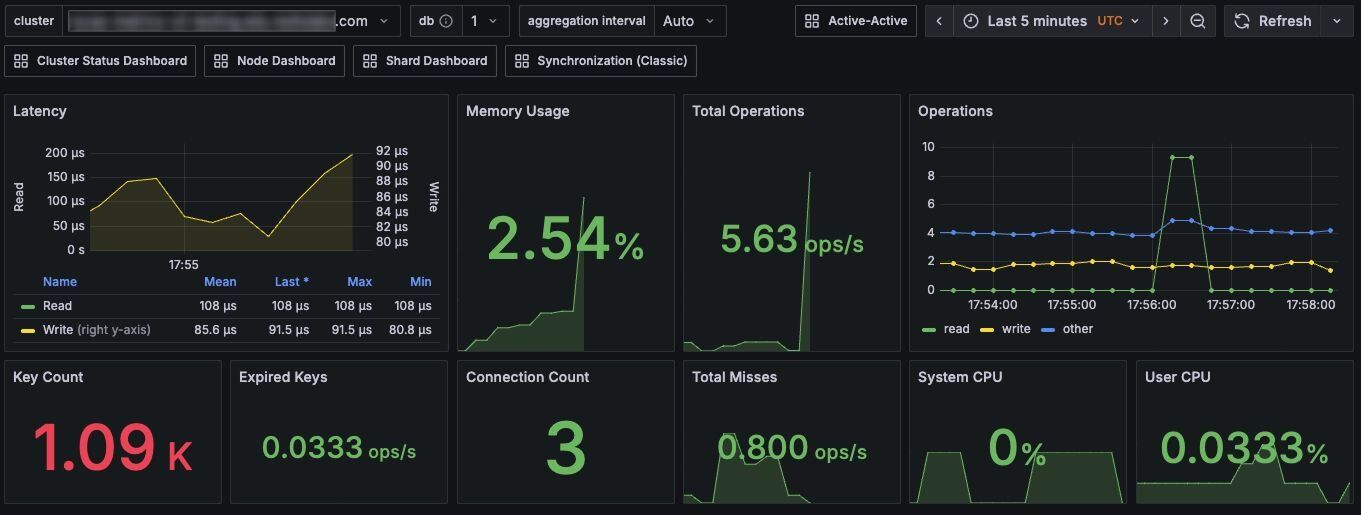
Cluster status dashboard - Your starting point for cluster health:
- Database count and status
- Overall resource utilization (used memory, memory usage)
- High-level performance indicators (total ops/sec, average latency, key count)
Database status dashboard - Application-focused metrics:
- Per-database performance (latency, throughput, error rates by database)
- Memory utilization
- Connection patterns (active connections, connection rate changes)
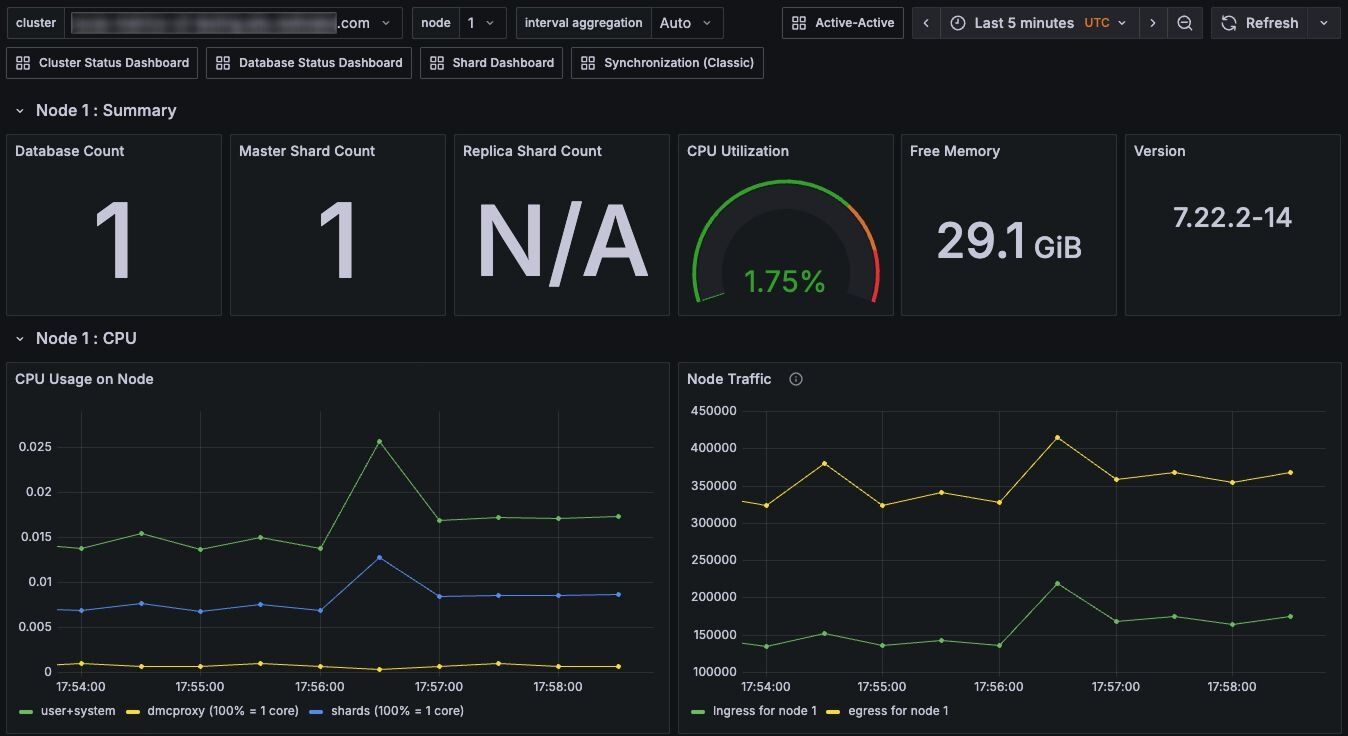
Node dashboard - Infrastructure details:
- Shard & database counts
- CPU, memory, and network per node (individual machine resource usage)
- System-level health indicators (OS metrics, file descriptors, disk I/O)
#What Redis metrics should you monitor?
#Memory utilization
Memory utilization can be calculated using the following v2 metrics in Prometheus or Grafana.
What to look for:
- Caching workloads: Safe up to 100% (relies on evictions)
- Non-caching workloads: Alert at 80%, critical at 90%
- Trend analysis: Steady growth vs. sudden spikes
#Latency performance
Latency performance can be calculated using the following metrics in Prometheus or Grafana.
Example performance targets
- Excellent: <0.5ms
- Good: 0.5-1ms
- Investigate: >1ms
- Critical: >4ms
NOTEThese targets are based on typical Redis Software performance. Your specific thresholds may vary based on network, hardware, and app requirements.
#CPU utilization
Redis Software monitors CPU at three levels:
- The shard CPU which tracks individual Redis processes (single-threaded)
- The proxy CPU which monitors the multi-threaded connection routing processes
- The node CPU which shows overall system utilization.
Since Redis shards are single-threaded, a high shard CPU utilization often indicates hot keys or data distribution problems, while a high proxy CPU utilization suggests connection issues. You'll need to establish appropriate thresholds based on your specific environment and performance requirements.
#What should you watch out for?
Hot keys - One shard has a high CPU utilization while others are idle:
- Symptom: Uneven CPU distribution across shards
- Impact: Single-threaded bottleneck
- Solution: Distribute keys, implement app caching
Large keys - High network utilization with CPU spikes:
- Symptom: Network traffic spikes correlating with CPU
- Impact: Bandwidth and processing bottlenecks
- Solution: Break large values into smaller keys
Slow operations - Commands taking excessive time:
- Symptom: Latency spikes with specific operation types
- Impact: Overall performance degradation
- Solution: Optimize queries, avoid O(n) operations like
KEYS
#How do you analyze cache performance?
For caching workloads, monitor:
Suggested target ranges:
- Excellent: >90% hit ratio
- Good: 70-90%
- Needs attention: <70%
Resources:
If you're looking to dive deeper, the following resources explain these metrics in greater detail.
- Redis Software developer observability playbook - Comprehensive analysis techniques
- Redis Software observability guide - Detailed metric explanations
#How do you set up alerting for Redis?
We can also set up intelligent alerts that notify you before issues impact apps. The setup script that we ran earlier added Prometheus Alertmanager and it's been populated with Redis-specific alert rules.
There are three primary suggested areas of monitoring and alerting:
- Performance alerts: These alerts monitor latency, CPU utilization, and memory pressure to detect degradation before it impacts apps.
- Availability alerts: These alerts provide immediate notifications for critical failures like node outages or shard unavailability.
- Capacity alerts: These alerts use predictive monitoring to warn about approaching resource limits before they cause problems. They are designed to escalate from 'warning' to 'critical,' based on severity, giving you time to respond before issues affect your users.
Alerts will appear in the Prometheus console under the Alerts tab.
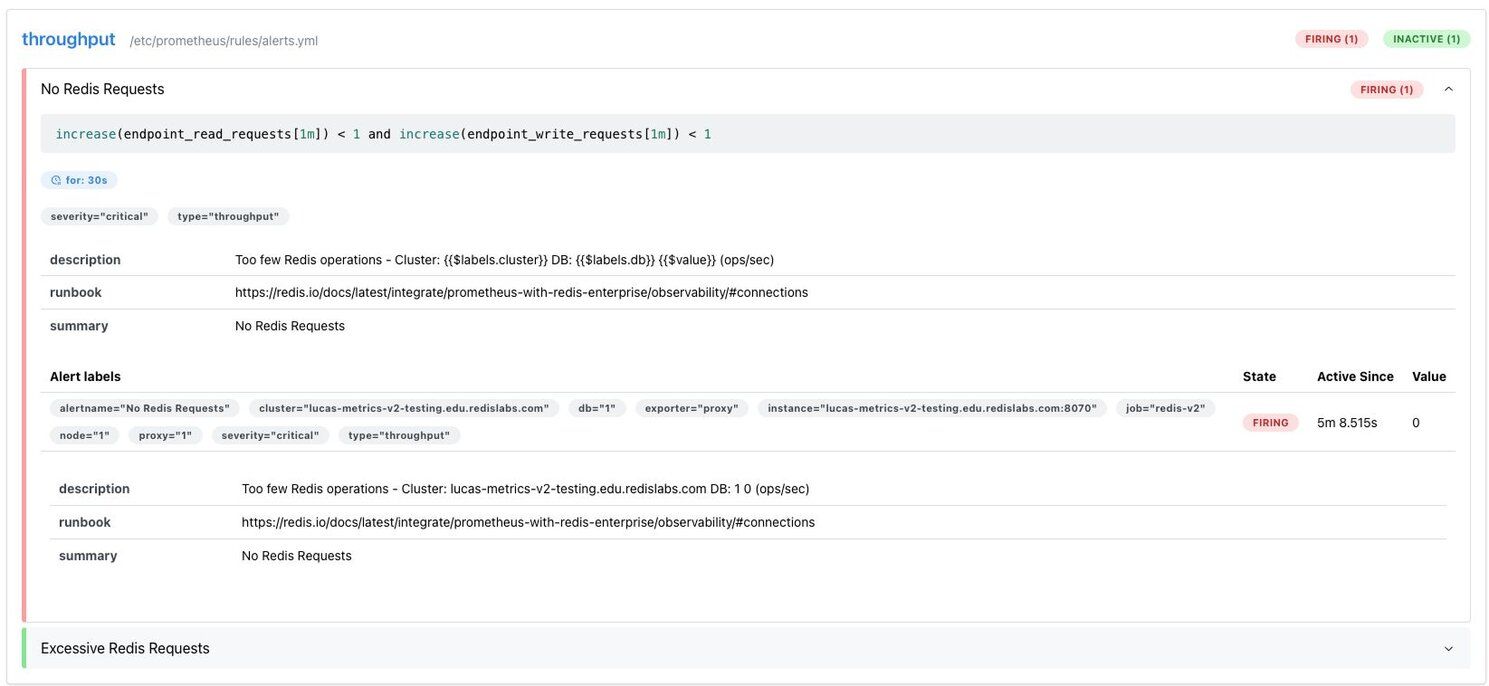
#How do you configure Redis alert rules?
The alerts used for this tutorial can be found at
redis-enterprise-observability/prometheus_v2/rules/alerts.yml. If you'd like to test edits, you'll need to bring down the dashboard Docker container and run the setup script again.Here's an example alert for high latency:
Once you have an alert like the one above, you'll then need to add the file name to the
rule_files section of the prometheus.yml file to see the alerts in action. See these in the Prometheus console under the Alerts tab.#How do you send Redis alert notifications?
You can also configure Alertmanager for your notification channels, such as Slack, PagerDuty, Email, etc. Here's an example of what a notification might look like:
Prevent false positives
- Use appropriate
fordurations (2-5 minutes for most alerts) - Set minimum traffic thresholds for meaningful alerts
- Use
avg_over_time()for noisy metrics
Resources
To dive deeper, check out the following resources on alerting:
- Prometheus Alerting docs - Complete alerting guide
#How do you build custom Redis dashboards?
Lastly, let's get familiar with what's possible with custom dashboards and v2 metrics for specialized monitoring needs.
#What v2 metrics are available for custom dashboards?
Redis Software v2 metrics (available in v7.8.2+) provide comprehensive monitoring capabilities. Note: V2 metrics are currently in preview with a partial list available.
You can test some of these queries in Prometheus to see their outputs.
Database endpoint monitoring
Node resource monitoring
Cluster status tracking
Replication monitoring
Redis shard performance
#What advanced Grafana features can you use with Redis?
Grafana provides several powerful features for creating sophisticated Redis Software dashboards:
- Template Variables: These variables allow you to create dynamic dashboards that can filter by cluster, database, or time range.
- Heat Maps: These maps can visualize latency distribution over time using v2 histogram metrics.
- Annotations: These let you mark deployment events or maintenance windows on your charts.
Resources
- V2 Metrics Complete Reference - All available v2 metrics
- Grafana Dashboard Best Practices - Dashboard design guidance
- PromQL Tutorial - Query language reference
#Next steps
Throughout this tutorial, you deployed a complete Redis Software monitoring stack with Prometheus and Grafana, learned how to interpret key Redis metrics and dashboards, configured proactive alerting rules, and explored advanced monitoring with v2 metrics.
To continue building your Redis observability skills:
- Monitor Redis with Datadog - Set up Redis monitoring using Datadog as an alternative to Prometheus and Grafana
- Add Redis as a Grafana datasource - Query Redis data directly from Grafana dashboards for custom analytics
#Additional resources
Official docs
- Redis Software Monitoring Overview - Complete monitoring guide
- Metrics Stream Engine - V2 metrics architecture
- Transition from Prometheus v1 to Prometheus v2 documentation
Learning & certification
- Redis University - Get Started with Redis Software - Free courses about all things Redis, including Redis Software
- Redis Developer Hub - Find other tutorials, client libraries, videos and dev events
Community support
- Redis Discord - Active community discussions
- GitHub Issues - Report bugs or request features for this repo
#Extending your setup
Production considerations
- Configure persistent storage for Prometheus data
- Set up high availability for monitoring infrastructure
- Implement proper authentication and TLS
- Plan retention policies for metrics data
Advanced integrations
- Connect to existing SIEM systems
- Integrate with incident management (PagerDuty, OpsGenie)
- Add business logic metrics and custom exporters
- Implement automated capacity scaling based on metrics
Your Redis Software observability foundation is now in place. The monitoring stack can grow with your deployment and provide continuous insights into your Redis operations.
Reach out to the Redis team if you're looking for help expanding further.